Review
. 2016 Jun;55(6):657-72.
doi: 10.1007/s40262-015-0343-6.

Liraglutide in Type 2 Diabetes Mellitus: Clinical Pharmacokinetics and Pharmacodynamics

Affiliations
Review

Liraglutide in Type 2 Diabetes Mellitus: Clinical Pharmacokinetics and Pharmacodynamics

Lisbeth V Jacobsen et al. Clin Pharmacokinet. 2016 Jun.

Abstract

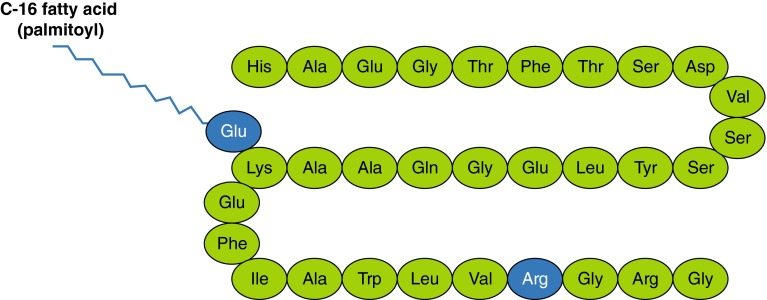
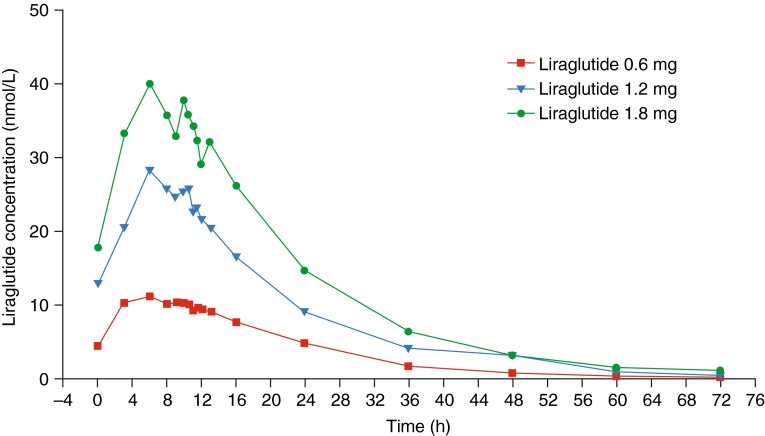
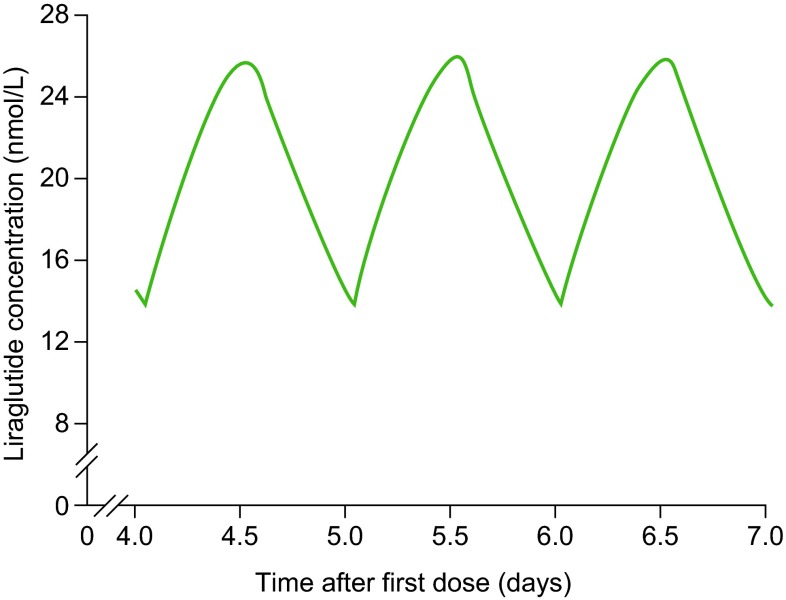
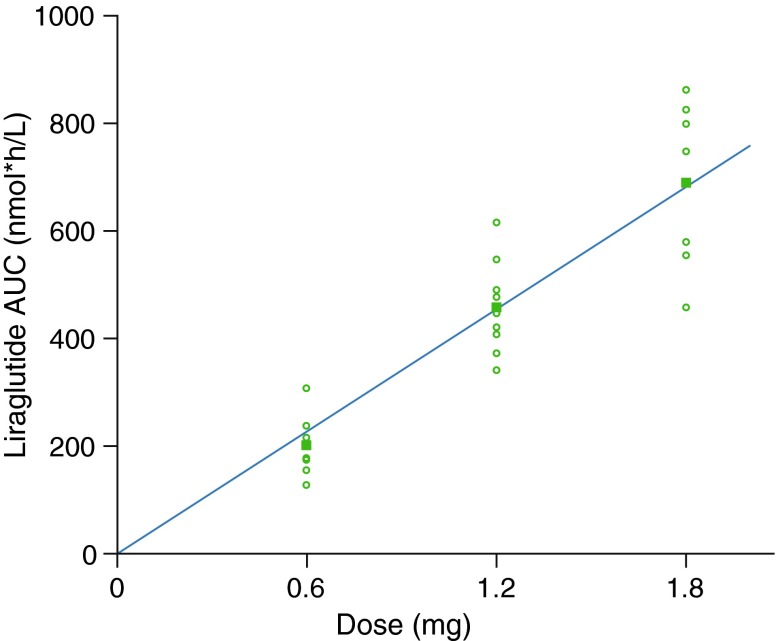
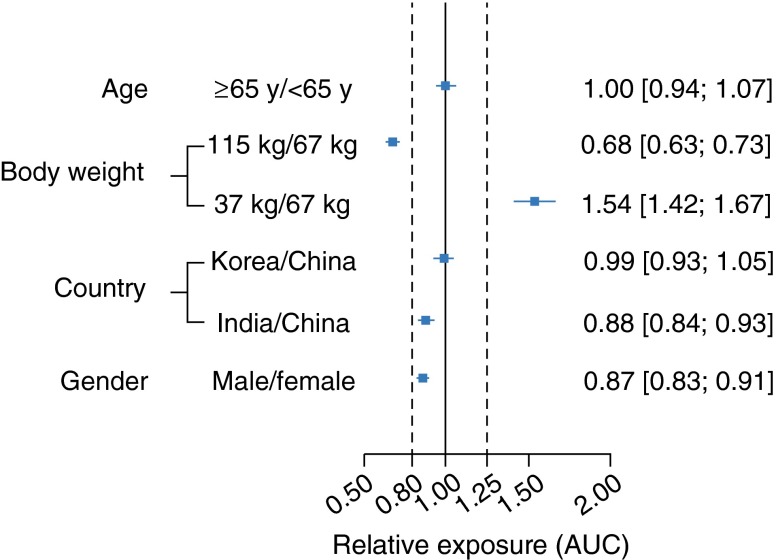
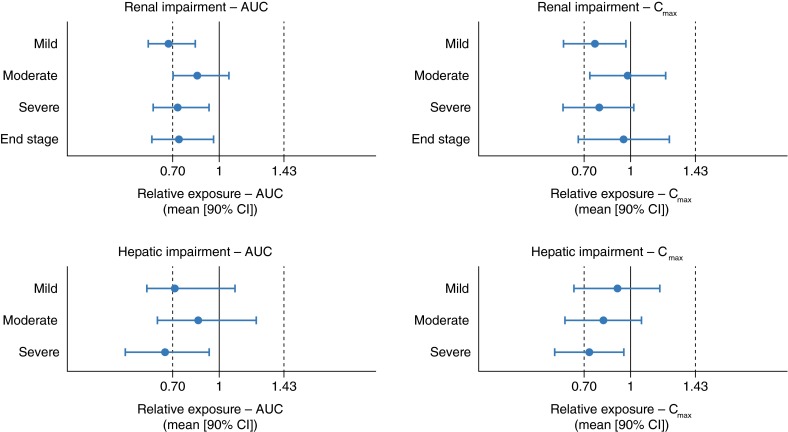
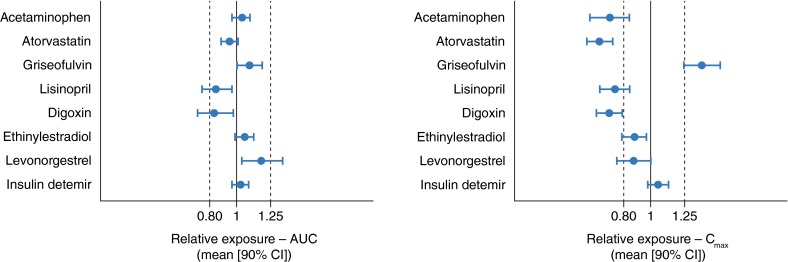
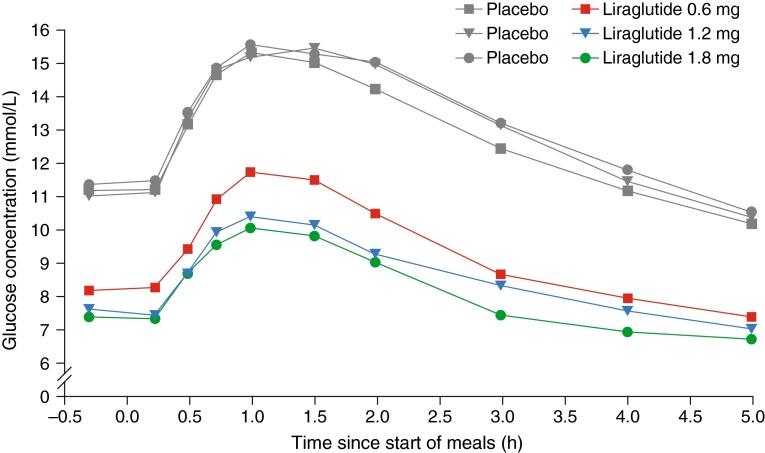
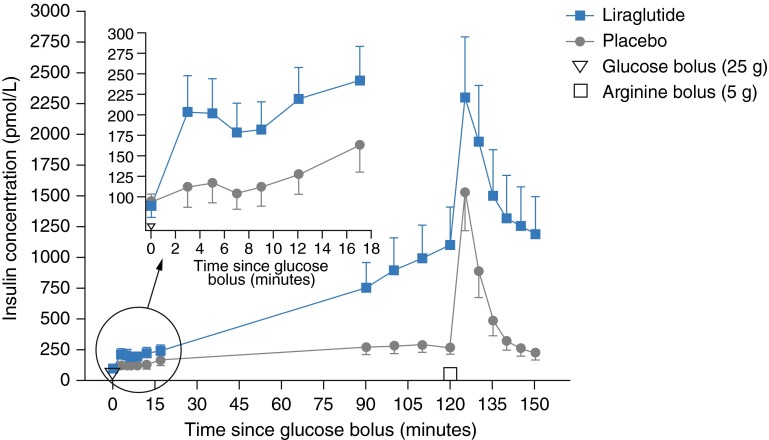
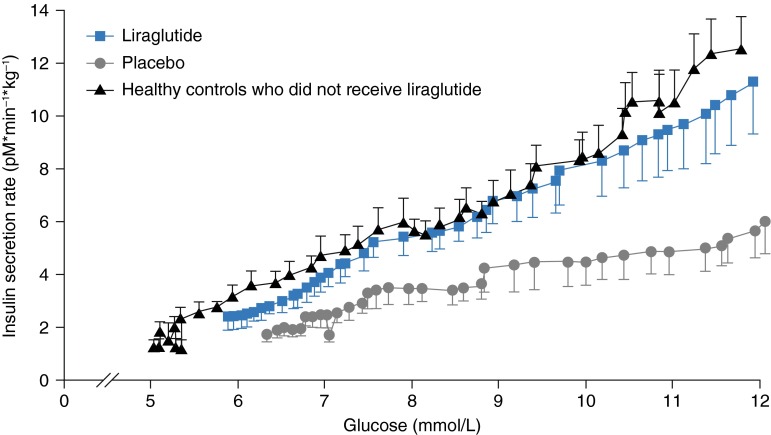
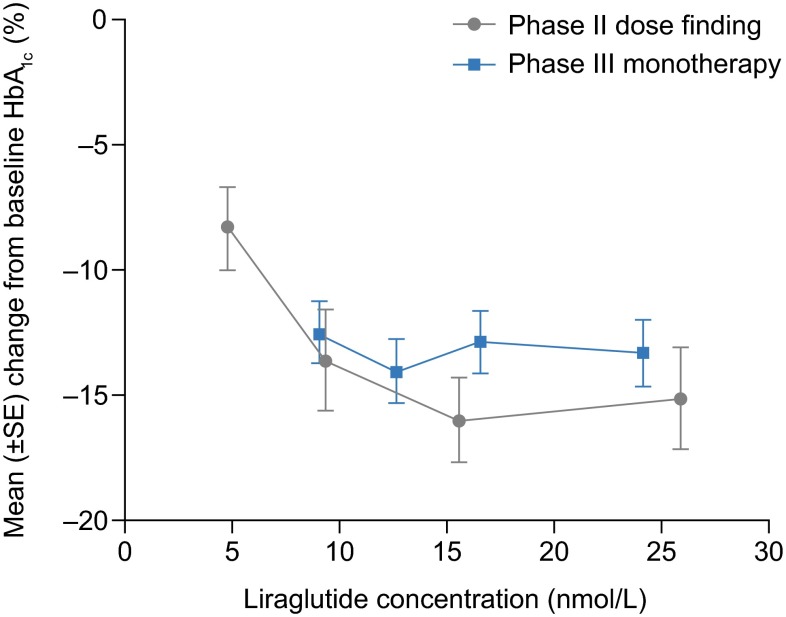
Liraglutide is an acylated glucagon-like peptide-1 analogue with 97 % amino acid homology with native glucagon-like peptide-1 and greatly protracted action. It is widely used for the treatment of type 2 diabetes mellitus, and administered by subcutaneous injection once daily. The pharmacokinetic properties of liraglutide enable 24-h exposure coverage, a requirement for 24-h glycaemic control with once-daily dosing. The mechanism of protraction relates to slowed release from the injection site, and a reduced elimination rate owing to metabolic stabilisation and reduced renal filtration. Drug exposure is largely independent of injection site, as well as age, race and ethnicity. Increasing body weight and male sex are associated with reduced concentrations, but there is substantial overlap between subgroups; therefore, dose escalation should be based on individual treatment outcome. Exposure is reduced with mild, moderate or severe renal or hepatic impairment. There are no clinically relevant changes in overall concentrations of various drugs (e.g. paracetamol, atorvastatin, griseofulvin, digoxin, lisinopril and oral combination contraceptives) when co-administered with liraglutide. Pharmacodynamic studies show multiple beneficial actions with liraglutide, including improved fasting and postprandial glycaemic control (mediated by increased insulin and reduced glucagon levels and minor delays in gastric emptying), reduced appetite and energy intake, and effects on postprandial lipid profiles. The counter-regulatory hormone response to hypoglycaemia is largely unaltered. The effects of liraglutide on insulin and glucagon secretion are glucose dependent, and hence the risk of hypoglycaemia is low. The pharmacokinetic and pharmacodynamic properties of liraglutide make it an important treatment option for many patients with type 2 diabetes.


Figures

Fig. 1
Fig. 1
Primary structure of liraglutide. Compared with native GLP-1 (7–37), liraglutide has lysine replaced with arginine in position 34, and the lysine at position 26 is acylated on its ε-amino group with the γ-carboxyl group of N-palmitoyl-l-glutamic acid. GLP-1 glucagon-like peptide-1. Republished with permission of © Dove Medical Press Ltd. from Deacon. Vasc Health Risk Manag. 2009;5:199–211 [21]; permission conveyed through Copyright Clearance Center, Inc
Fig. 2
Fig. 2
Mean concentration profiles of liraglutide following steady-state doses of 0.6 mg (n = 9), 1.2 mg (n = 9) and 1.8 mg (n = 8) in healthy male Chinese subjects. With permission of © John Wiley & Sons, Inc. from Jiang et al. J Clin Pharmacol. 2011;51:1620–7 [42]
Fig. 3
Fig. 3
Model-derived steady-state concentration profile of liraglutide (20 μg/kg) dosed once daily. With permission of © John Wiley & Sons, Inc.; adapted from Watson et al. Population pharmacokinetics of liraglutide, a once-daily human glucagon-like peptide-1 analog, in healthy volunteers and subjects with type 2 diabetes, and comparison to twice-daily exenatide. J Clin Pharmacol. 2010;50:886–94 [46]
Fig. 4
Fig. 4
Dose-proportionality plot of liraglutide exposure at steady state. Open circles represent individual study subjects. Squares represent mean values at each dose in healthy male Chinese subjects. The line represents the regression line from a linear model with logarithmic transformed AUC and dose under the assumption of dose proportionality (r 2 = 0.96). AUC area under the concentration–time curve in a dosing interval (24 h). Data from Jiang et al. The pharmacokinetics, pharmacodynamics, and tolerability of liraglutide, a once-daily human GLP-1 analogue, after multiple subcutaneous administration in healthy Chinese male subjects. J Clin Pharmacol 2011;51:1620–7 [42] © John Wiley and Sons, analysis results from data on file
Fig. 5
Fig. 5
Forest plot of covariate effects on liraglutide dose-normalised exposure (AUC) relative to a reference subject (Chinese female individual aged <65 years and with a body weight of 67 kg). Data are mean (90 % CI). Vertical dotted lines indicate bioequivalence limits of 0.8–1.25. The column to the right provides numerical values of geometric mean relative exposures with 90 % CIs obtained by likelihood profiling. AUC area under the concentration–time curve, CI confidence interval, y years. Reprinted from Ingwersen et al. Diabetes Res Clin Pract. 2015;108:113–9 [35], with permission from © Elsevier Ireland Ltd
Fig. 6
Fig. 6
Liraglutide exposure (AUC and C max) following liraglutide 0.75 mg in subjects with renal or hepatic impairment relative to healthy controls. Data are mean exposures (with 90 % CI) for each group (n = 5–7 per group) relative to healthy subjects. Broken vertical lines illustrate the no-effect boundaries (0.70–1.43) used in the assessment. AUC area under the concentration–time curve, CI confidence interval, C max maximum concentration. Renal impairment data from Jacobsen et al. Br J Clin Pharmacol. 2009;68:898–905 [41]. Hepatic impairment data from Flint et al. Br J Clin Pharmacol. 2010;70:807–14 [38]
Fig. 7
Fig. 7
Effects of liraglutide 1.8 mg on the exposure of selected co-administered drugs. Data are mean relative exposures (with 90 % CI) when co-administered with liraglutide vs. co-administration with placebo. The trials consisted of healthy subjects (atorvastatin n = 42, griseofulvin n = 27, lisinopril n = 38, digoxin n = 26, ethinylestradiol/levonorgestrel n = 21) and subjects with type 2 diabetes (acetaminophen n = 18 and insulin detemir n = 32). Broken vertical lines illustrate the no-effect boundaries (0.80–1.25) used in the assessment. Ethinylestradiol and levonorgestrel were administered as a combination product. AUC area under the concentration–time curve, C max maximum concentration. Data from Malm-Erjefält et al. Mol Pharm. 2015; doi: 10.1021/acs.molpharmaceut.5b00278 [44]; Jacobsen et al. J Clin Pharmacol. 2011;51:1696–703 [53]; Kapitza et al. Adv Ther. 2011;28:650–60 [54]; Morrow et al. Diabetes Obes Metab. 2011;13:75–80 [56]
Fig. 8
Fig. 8
Mean postprandial glucose profiles during a standardised meal test performed in 18 subjects with type 2 diabetes dosed with liraglutide or placebo. During each 3-week treatment period, the liraglutide/placebo dose was escalated weekly in 0.6-mg increments from 0.6 to 1.2 mg and 1.8 mg. Postprandial glucose measures were performed at steady-state liraglutide 0.6-mg (red squares), 1.2-mg (blue triangles), and 1.8-mg (green circles) doses, and for placebo (matched grey lines). © With kind permission from Springer Science + Business Media: Advances in Therapy, The once-daily human glucagon-like peptide-1 (GLP-1) analog liraglutide improves postprandial glucose levels in type 2 diabetes patients. 2011;28:213–26, Flint et al., Fig. 1 [61]
Fig. 9
Fig. 9
Mean insulin profiles following glucose bolus injection (inserted), during a hyperglycaemic clamp and following an arginine stimulation test in 13 subjects with type 2 diabetes treated for 9 days with liraglutide 6 µg/kg (~0.55 mg) or placebo. Glucose bolus (first phase): 0–17 min; hyperglycaemic clamp (second phase): 90–120 min; arginine stimulation test (maximum insulin secretion): 120–150 min. © American Diabetes Association. Diabetes, American Diabetes Association, 2004. Copyright and all rights reserved. Material from this publication has been adapted with the permission of the American Diabetes Association from Degn et al. Diabetes. 2004;53:1187–94 [66]
Fig. 10
Fig. 10
Glucose-dependent stimulation of insulin secretion in subjects with type 2 diabetes treated with liraglutide. Relationship between insulin secretion rate (ISR) and plasma glucose levels during graded glucose infusion in subjects with type 2 diabetes (n = 10) receiving liraglutide 7.5 µg/kg (~0.66 mg; blue squares) or placebo (grey circles). Values from healthy controls (n = 10) who did not receive liraglutide (black triangles) are also shown. ISR was derived by deconvolution of C-peptide concentrations. Data are mean ± standard error; n = 10 for each group. © American Diabetes Association. Copyright and all rights reserved. Material from this publication has been used with the permission of American Diabetes Association. From Chang et al. Diabetes. 2003;52:1786–91 [59]
Fig. 11
Fig. 11
Exposure–response relationship of liraglutide effects on HbA1c in subjects with type 2 diabetes. Figure shows percentage change from baseline in HbA1c following 14 weeks of treatment in a phase II dose-finding study (grey circles) and following 12 weeks of treatment in a phase III study (blue squares). The exposure–response relationships were evaluated by dividing liraglutide concentration values from each trial into quartiles. Exposures are trough concentrations for the phase II trial and model-derived mean concentrations for the phase III trial. HbA 1c glycated haemoglobin, SE standard error. With permission of © John Wiley & Sons, Inc.; adapted from Ingwersen et al. Dosing rationale for liraglutide in type 2 diabetes mellitus: a pharmacometric assessment. J Clin Pharmacol. 2012;52:1815–23 [33]

References

    1. International Diabetes Federation. Diabetes atlas: sixth edition. 2014 update. http://www.idf.org/diabetesatlas. Accessed 24 Sep 2015.
    1. International Diabetes Federation. About diabetes. https://www.idf.org/about-diabetes. Accessed 23 Sep 2015.
    1. Inzucchi SE, Bergenstal RM, Buse JB, Diamant M, Ferrannini E, Nauck M, et al. Management of hyperglycaemia in type 2 diabetes: a patient-centered approach. Position statement of the American Diabetes Association (ADA) and the European Association for the Study of Diabetes (EASD) Diabetologia. 2012;55:1577–1596. doi: 10.1007/s00125-012-2534-0. - DOI - PubMed
    1. Hermans MP, Brotons C, Elisaf M, Michel G, Muls E, Nobels F, et al. Optimal type 2 diabetes mellitus management: the randomised controlled OPTIMISE benchmarking study: baseline results from six European countries. Eur J Prev Cardiol. 2013;20:1095–1105. doi: 10.1177/2047487312449414. - DOI - PubMed
    1. International Diabetes Federation Clinical Guidelines Task Force. Global guideline for type 2 diabetes. 2012. http://www.idf.org/sites/default/files/IDF-Guideline-for-Type-2-Diabetes.... Accessed 23 Sep 2015.

MeSH terms