. 2016 Jan;71(1):243-55.
doi: 10.1007/s00248-015-0711-7. Epub 2015 Nov 23.

Phenotypic and Physiological Characterization of the Epibiotic Interaction Between TM7x and Its Basibiont Actinomyces

Affiliations

Phenotypic and Physiological Characterization of the Epibiotic Interaction Between TM7x and Its Basibiont Actinomyces

Batbileg Bor et al. Microb Ecol. 2016 Jan.

Abstract

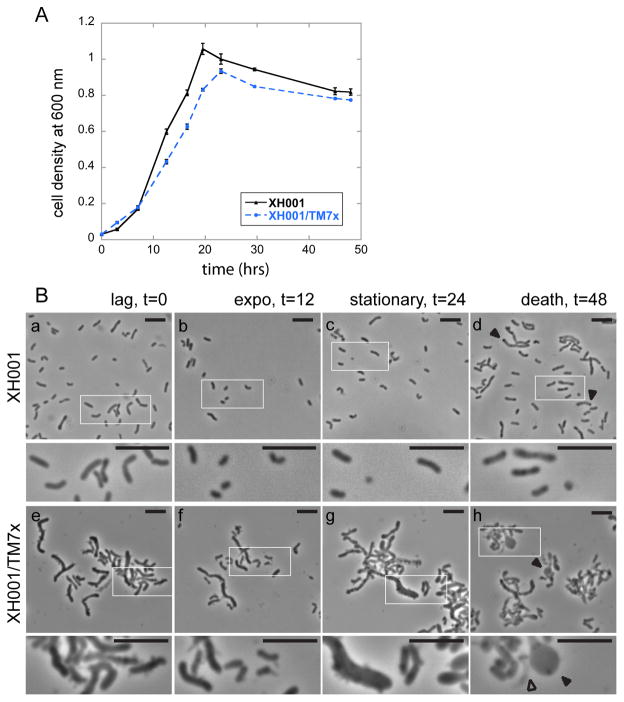
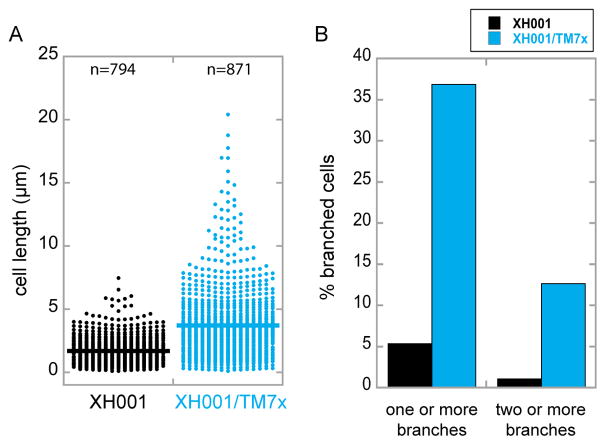
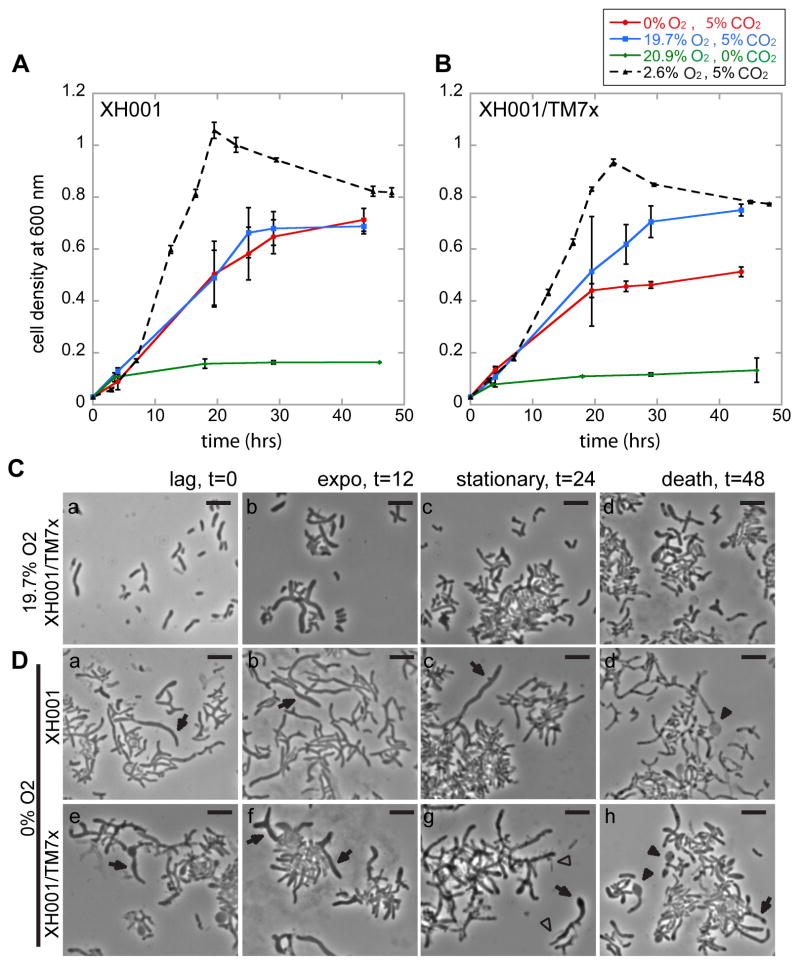
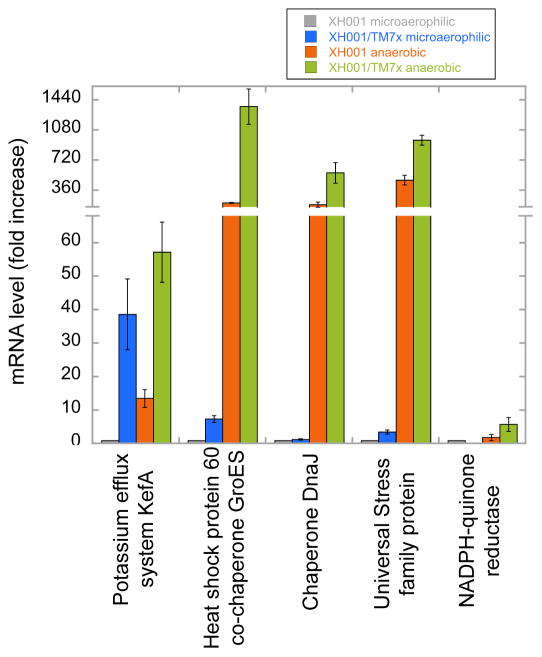
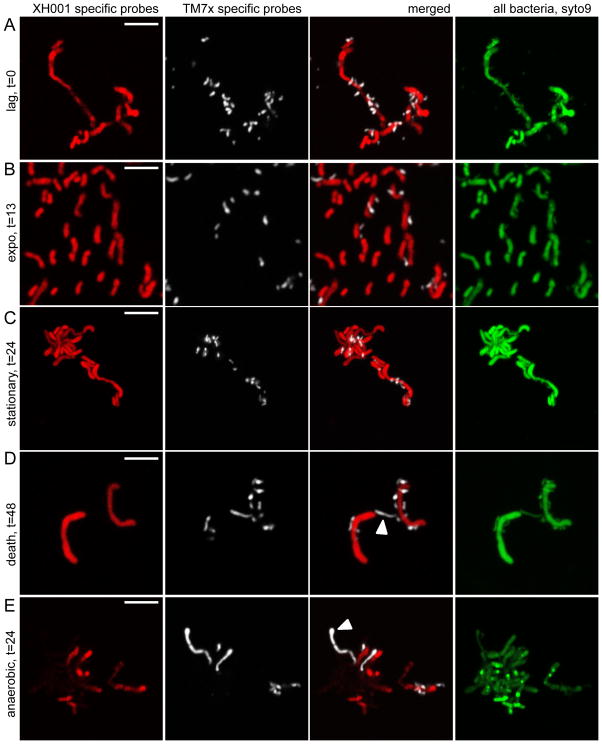
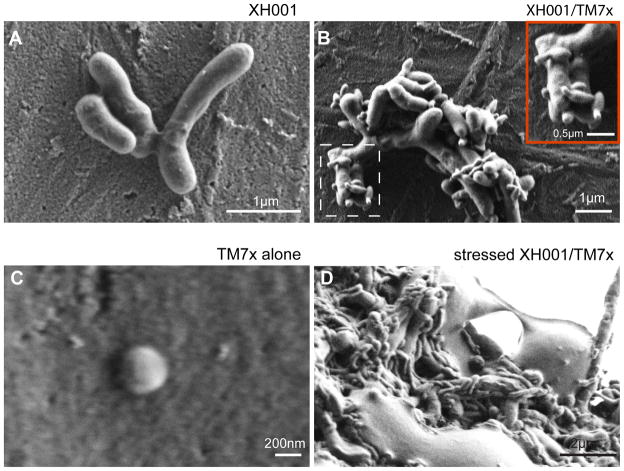
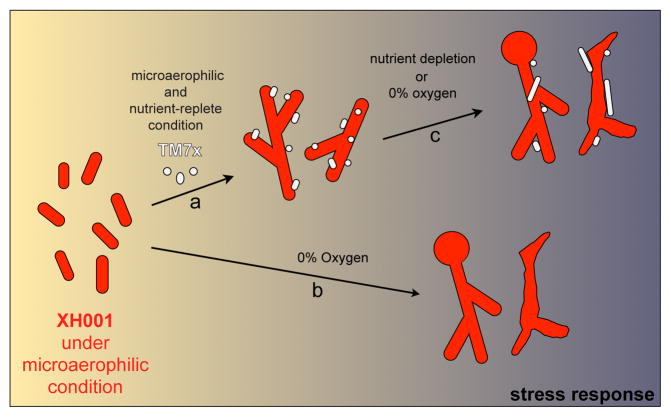
Despite many examples of obligate epibiotic symbiosis (one organism living on the surface of another) in nature, such an interaction has rarely been observed between two bacteria. Here, we further characterize a newly reported interaction between a human oral obligate parasitic bacterium TM7x (cultivated member of Candidatus Saccharimonas formerly Candidate Phylum TM7), and its basibiont Actinomyces odontolyticus species (XH001), providing a model system to study epiparasitic symbiosis in the domain Bacteria. Detailed microscopic studies indicate that both partners display extensive morphological changes during symbiotic growth. XH001 cells manifested as short rods in monoculture, but displayed elongated and hyphal morphology when physically associated with TM7x. Interestingly, these dramatic morphological changes in XH001 were also induced in oxygen-depleted conditions, even in the absence of TM7x. Targeted quantitative real-time PCR (qRT-PCR) analyses revealed that both the physical association with TM7x as well as oxygen depletion triggered up-regulation of key stress response genes in XH001, and in combination, these conditions act in an additive manner. TM7x and XH001 co-exist with relatively uniform cell morphologies under nutrient-replete conditions. However, upon nutrient depletion, TM7x-associated XH001 displayed a variety of cell morphologies, including swollen cell body, clubbed-ends, and even cell lysis, and a large portion of TM7x cells transformed from ultrasmall cocci into elongated cells. Our study demonstrates a highly dynamic interaction between epibiont TM7x and its basibiont XH001 in response to physical association or environmental cues such as oxygen level and nutritional status, as reflected by their morphological and physiological changes during symbiotic growth.

Keywords: Actinomyces; Bacterial interaction; Epibiont; Obligate; Symbiosis; TM7.


Conflict of interest statement

Conflict of Interest

The authors declare no competing financial interests.

Figures

Figure 1
Figure 1
Growth and morphology of XH001 monoculture and XH001/TM7x co-culture. (A) Mono (triangle, black solid line) and co-culture (circle, blue broken line) cell densities were determined by measuring the optical density at 600 nm (OD600). Each point represents the average of three independent cultures (error bars, SD). The time points were connected by straight line to guide the eye. (B, a–d) XH001 monoculture grown in microaerophilic conditions has short rod morphology from early to late growth phases. The lower images are a higher magnification of the boxed region in the upper image. During death phase (B, d), many of the cells had condensed dot structures within the cell body (arrow heads). (B, e–h) TM7x-associated XH001 have elongated and hyphal morphology from early to late growth phases. During exponential phase (B, f), many of the XH001 cells are short rods similar to XH001 alone. At death phase (B, h), many of the XH001 cells display large clubbed-ends (arrow heads), swollen cells, and cell lyses (open arrow head). During all growth phases, XH001 was heavily decorated with TM7x. All scale bars indicate 5 μm.
Figure 2
Figure 2
Quantification of cell length and branch points in TM7x associated XH001. Mild sonication-dispersed co-culture cells were quantified by python-based image analysis software (see Materials and Methods) that automatically quantifies the longest length of the XH001 cells, and number of branch points. (A) n is the total number of cells measured from multiple microscope slides prepared from three independent mono or co-cultures incubated under microaerophilic conditions. Error bars are not shown as we combined the data to show the cell length distribution. Student’s t-test was used to determine significance (p<0.001) (B) Each bar shows the percent of cells in A (from n cells) that had one or more, or two or more branch points. TM7x-associated XH001 is ~7 times more likely to have one or more branch points or ~13 times more likely to have two or more branch points compare to XH001 alone.
Figure 3
Figure 3
Oxygen depletion-induced morphological changes in XH001 mono and co-cultures. (A–B) Cell density measurements of XH001 mono (A) or co-culture (B) under microaerophilic (2.6% O2, 5% CO2, triangles, black broken line), high oxygen (19.7% O2, 5% CO2, squires, blue solid line), atmospheric (20.9% O2, 0.04% CO2, diamonds, green solid line) or anaerobic (0% O2, 5% CO2, circles, red solid lines) conditions. The dashed lines are the same data points from Figure 1. Each point represents the average of three independent cultures (error bars, SD). (C, D) Phase contrast images of cells grown under indicated conditions (see also Figure S2). (C, a–d) Co-culture grown under high oxygen condition for indicated amount of time. XH001 alone (D, ad) or with TM7x (D, e–h) grown under anaerobic condition for indicated amount of time. In these images, we can clearly see clubbed-ended (filled arrow heads) and swollen (arrows) XH001 cells as well as elongated TM7x cells (open arrow heads). All scale bars indicate 5 μm.
Figure 4
Figure 4
Stress response of XH001 under TM7x-associated and/or anaerobic conditions. We tested mRNA levels of 5 stress genes using qRT-PCR in XH001 grown with TM7x under microaerophilic (blue) or anaerobic conditions (green), or XH001 alone grown under anaerobic conditions (orange), and compared that to XH001 monoculture grown under microaerophilic conditions (gray). Each bar represents the average of three independent experiments (error bars, SD).
Figure 5
Figure 5
Morphology of TM7x during growth. Co-culture grown under microaerophilic conditions was FISH stained using TM7x-specific (white, TM7567) and XH001-specific (red, M33910) DNA-probes that target the 16S rRNA gene (see Materials and Methods). Green is a universal DNA dye, syto9, which stains both XH001 and TM7x DNA and RNA. XH001 monoculture staining is shown in Figure S3. At time points 0 (A), 24 (C) and 48 (D) hours, XH001 had long and hyphal morphology. At 13 hours (B), many of the XH001 cells were short rods. TM7x also assumed different morphologies. At time points 0–24 (A–C) hours, TM7x appeared as small cocci or short rods. At 48 hours (D), the elongated form of TM7x was observed more frequently (white arrow head). (E) Interestingly, TM7x also assumed an elongated morphology when the co-culture was incubated under anaerobic conditions (white arrowhead). Long TM7x can be observed throughout all time points of the growth but only t = 24 hours is shown in E. All scale bars indicate 5 μm.
Figure 6
Figure 6
Bud-like morphology of TM7x. (A–F) Magnified images of TM7x from the co-culture stained with a TM7x-specific FISH probe. Representative images were selected from FISH staining of co-culture grown under microaerophilic conditions. These images are not a time series, but rather a collection of different cells from the FISH imaging. XH001 staining is not shown. Different stages of bud growth can be seen throughout all time points of the co-culture growth. These images were further analyzed by graphing the length (x-axes) versus fluorescent intensity of Cy-5-TM7567 (y-axes) along the red line drawn across the budding cells (see red line in A). (A) Representative image of cocci TM7x is shown. (B) Very beginning of bud formation is shown by one large coccus with a small tail-like formation. (C) Further bud development is evidenced by a clearer tail-like formation. (D) Two connected cells are represented. One cell is smaller than the other, possibly formed from the tail-like structure. (E) Two cells that have clear separation but still connected by weak fluorescent signal. (F) Finally, two cells that are separated and have clear boundaries. The scale bar in the images are not displayed since the graph is accurately showing the cell length.
Figure 7
Figure 7
Morphology of XH001 and TM7x under SEM. (A) XH001 monoculture grown under microaerophilic conditions shows short rod morphology with smooth surfaces. (B) Co-culture grown under microaerophilic conditions reveals elongated and branched XH001 cells decorated with smaller cells, presumably TM7x. Inset shows a zoomed-in image of the smaller TM7x (box with dashed line) that seems to be budding. (C) Isolated TM7x using 0.22-micron filter shows cocci TM7x with diameter of ~200 nm. (D) Co-culture grown under anaerobic conditions shows elongated XH001 decorated with many elongated TM7x.
Figure 8
Figure 8
Diagram depicting morphological changes of XH001 and TM7x under different conditions. XH001 and TM7x bacteria are shown in red and gray respectively. Arrows represent the changes in condition of the culture environment: (a) attachment of TM7x to XH001 under microaerophilic nutrient-replete environment, (b) incubation of XH001 alone under oxygen deplete environment, and (c) co-culture under nutrient or oxygen deplete condition. Increasing dark color in the background represents increase in stress response genes.

References

    1. Joseph S. Symbiosis: Mechanisms and Model Systems. Kluwer Academic Publisher; New York, Boston, Dordrecht, London, Moscow: 2002.
    1. Guerrero R, Pedros-Alio C, Esteve I, et al. Predatory prokaryotes: predation and primary consumption evolved in bacteria. Proc Natl Acad Sci. 1986;83:2138–2142. doi: 10.1073/pnas.83.7.2138. - DOI - PMC - PubMed
    1. Huber H, Hohn MJ, Rachel R, et al. A new phylum of Archaea represented by a nanosized hyperthermophilic symbiont. Nature. 2002;417:63–67. doi: 10.1038/417063a. - DOI - PubMed
    1. Lambina VA, Afinogenova AV, Romaĭ Penabad S, et al. Micavibrio admirandus gen. et sp. nov. Mikrobiologiia. 1982;51:114–117. - PubMed
    1. Grice EA, Segre JA. The human microbiome: our second genome. Annu Rev Genomics Hum Genet. 2012;13:151–170. doi: 10.1146/annurev-genom-090711-163814. - DOI - PMC - PubMed