. 2015 Nov 23;84(2):480-90.
doi: 10.1128/IAI.01254-15. Print 2016 Feb.

Enhanced Direct Major Histocompatibility Complex Class I Self-Antigen Presentation Induced by Chlamydia Infection

Affiliations

Enhanced Direct Major Histocompatibility Complex Class I Self-Antigen Presentation Induced by Chlamydia Infection

Erik D Cram et al. Infect Immun. .

Abstract

The direct major histocompatibility complex (MHC) class I antigen presentation pathway ensures intracellular peptides are displayed at the cellular surface for recognition of infected or transformed cells by CD8(+) cytotoxic T lymphocytes. Chlamydia spp. are obligate intracellular bacteria and, as such, should be targeted by CD8(+) T cells. It is likely that Chlamydia spp. have evolved mechanisms to avoid the CD8(+) killer T cell responses by interfering with MHC class I antigen presentation. Using a model system of self-peptide presentation which allows for posttranslational control of the model protein's stability, we tested the ability of various Chlamydia species to alter direct MHC class I antigen presentation. Infection of the JY lymphoblastoid cell line limited the accumulation of a model host protein and increased presentation of the model-protein-derived peptides. Enhanced self-peptide presentation was detected only when presentation was restricted to defective ribosomal products, or DRiPs, and total MHC class I levels remained unaltered. Skewed antigen presentation was dependent on a bacterial synthesized component, as evidenced by reversal of the observed phenotype upon preventing bacterial transcription, translation, and the inhibition of bacterial lipooligosaccharide synthesis. These data suggest that Chlamydia spp. have evolved to alter the host antigen presentation machinery to favor presentation of defective and rapidly degraded forms of self-antigen, possibly as a mechanism to diminish the presentation of peptides derived from bacterial proteins.


Figures

FIG 1
FIG 1
Stabilization and presentation of SCRAP-SVG in JY cells. (A) Depiction of SCRAP-SVG, including the destabilization domain (DD), the SVG peptide, and VFP. In the absence of Shield-1, SCRAP-SVG is degraded by the proteasome. The addition of Shield-1 allows SCRAP-SVG to fold and gain fluorescence. (B) Flow cytometry histograms depicting VFP fluorescence of parental JY cells (shaded), JY/SCRAP-SVG cells treated with Shield-1 (black histogram), and JY/SCRAP-SVG cells treated with ethanol alone (blue trace). RL15A-stained JY/SCRAP-SVG cells (bottom histogram, black trace) and parental JY cells (shaded histogram) are used to measure HLA-A2-SVG complexes at the cell surface. (C) Dose response of JY/SCRAP-SVG cells with various concentrations of Shield-1 or epoxomicin, measuring the mean fluorescence intensity (MFI) of VFP fluorescence. (D) JY/SCRAP-SVG cells were washed in citric acid and cultured with ethanol (EtOH), 1 μM Shield-1, BFA, or emetine and harvested at the indicated times for RL15A staining. (E) The same as in panel D except the cells were harvested at 8 h and stained in triplicate. Results for Shield-1-treated cells are statistically significantly different from results for ethanol-treated and either BFA- or emetine-treated cells (*, P < 0.05).
FIG 2
FIG 2
Chlamydia species can successfully infect JY cells. (A) Electron micrograph of JY cells 24 h after infection with C. trachomatis. Blue asterisks show locations of C. trachomatis inclusions. (B) Fluorescence microscopy image of JY cells infected (left) or not infected (right) with RFP-expressing C. trachomatis. Cells were stained with DAPI to delineate nucleic acid. (C) RFP expression of C. trachomatis-infected JY cells (black trace) and uninfected cells (shaded histogram) analyzed by flow cytometry. (D) CAM was added to either infected or mock-infected cells, and the MFI of RFP fluorescence was recorded at 24 hpi. (E) JY cells were infected with C. caviae (black trace) or mock infected (shaded histogram) and identified by staining cells with C6-NBD-ceramide. (F) C. trachomatis-infected JY cells were harvested at the indicated times postinfection and disrupted, and the supernatants were used to infect McCoy cells. The infectious dose at each time point is plotted.
FIG 3
FIG 3
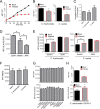
Chlamydia infection prevents accumulation of SCRAP-SVG while enhancing presentation of the SVG peptide. (A) JY/SCRAP-SVG cells were infected with RFP-expressing C. trachomatis and cultured for 12 h prior to the addition of Shield-1. VFP fluorescence was monitored over the next 12 h, and the MFI was plotted. (B) JY/SCRAP-SVG cells were infected with either C. trachomatis or C. caviae and cultured for 12 h before the addition of 1.0 μM Shield-1. The cells were cultured for an additional 12 h and analyzed in triplicate by flow cytometry for VFP expression. VFP fluorescence was significantly decreased (P < 0.05) for infected cells. (C) JY/SCRAP-SVG cells were mock infected or infected with either C. trachomatis or C. caviae, and 24 hpi, mRNA was extracted from cells and used to synthesize cDNA. SCRAP-SVG transcripts were quantified by qPCR. (D) JY/SCRAP-SVG cells were treated with EtOH, Shield-1, or BFA for 12 h, and the HLA-A2-SVG complexes were quantified. Results seen with Shield-1 treatment were significantly different from results for both EtOH- and BFA-treated cells (*, P < 0.05). (E) JY/SCRAP-SVG cells were infected and treated with Shield-1 or ethanol as described for panel B, and HLA-A2-SVG complexes were detected by staining with the RL15A MAb. Shield-1-treated infected cells had significantly more peptide-MHC complexes (*, P < 0.05) than uninfected cells. (F) Total MHC class I was quantified by flow cytometry in both mock-infected and infected cells. (G) JY/SCRAP-SVG cells were treated with the indicated TLR ligands (x axis) for 12 h and Shield-1 for an additional 12 h. The cells were analyzed for VFP expression (top) and HLA-A2-SVG (bottom). No statistically significant changes were noted when TLR-stimulated cells were compared to untreated cells. (H) MCF7 cells were transiently transfected with SCRAP-SVG, infected with C. trachomatis serovar D/UW-3, and treated with Shield-1 12 hpi. The cells were analyzed 15 h later by gating on VFP+ cells, and the average MFI of both the Venus fluorescence and HLA-A2 staining on VFP+ cells is depicted (*, P < 0.05).
FIG 4
FIG 4
C. trachomatis protein synthesis and LOS are necessary for skewing peptide presentation. Infected and mock-infected JY/SCRAP-SVG cells were treated with RIF (A) or CAM (B) immediately after infection, Shield-1 was added 12 hpi, and HLA-A2-SVG levels were measured 24 hpi. (C) JY/SCRAP-SVG cells were infected with C. trachomatis and treated with LPC. After 24 h, the cells were visualized using fluorescence microscopy with antibodies to LOS and bacterial Hsp60. Images of a representative cell from treated and nontreated cells are shown. (D) Cells were treated as described for panel C, and DNA was extracted from cells 24 hpi to determine the C. trachomatis genome copy number by qPCR. (E) JY/SCRAP-SVG cells were infected and treated with LPC or left untreated and then exposed to Shield-1, and HLA-A2-SVG complexes were quantified by RL15A staining at 24 hpi. Results for LPC-treated cells are significantly different from results for untreated, infected cells (*, P < 0.05).
FIG 5
FIG 5
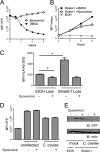
Chlamydia-induced loss of SCRAP-SVG is not mediated by proteasomal degradation. (A) JY/SCRAP-SVG cells were cultured overnight in the presence of Shield-1, and the following day, the cells were washed and cultured in the absence of Shield-1 but in the presence of epoxomicin or DMSO. VFP fluorescence was monitored at the indicated times. (B) JY/SCRAP-SVG cells were cultured with Shield-1 plus epoxomicin or with Shield-1 alone, and VFP accumulation was monitored at the indicated times. (C) JY/SCRAP-SVG cells were treated with Shield-1 or EtOH overnight. Existing peptide-MHC complexes were removed by a brief acid wash, and cells were cultured for 2 h in the presence or absence of the proteasome inhibitor epoxomicin. SVG-peptide presentation after Shield-1 “loss” was significantly different than that after the loss of ethanol or in cells treated with epoxomicin (*, P < 0.05). (D and E) C. caviae-infected cells were treated with Shield-1 and epoxomicin for 2 h starting at 20 hpi and analyzed for VFP fluorescence (D) or for SCRAP-SVG accumulation by Western blotting (E).
FIG 6
FIG 6
Quantitative Western blot analysis can be used to calculate loss of SCRAP-SVG induced by Chlamydia infection. (A) Representative quantitative Western blot of JY/SCRAP-SVG total cell lysates from cells treated with Shield-1 or ethanol that were either infected or uninfected. Recombinant GFP (rGFP) standards, prepared in lysates of JY cells that do not express SCRAP-SVG, are included on the blot. (B) Standard curves for quantification of GFP (left) and antibody staining (right) are shown. Signal detected by Western blotting is plotted as a function of GFP concentration. For antibody staining, latex beads with known molar equivalents of fluorescent dye (MEF) were analyzed by flow cytometry, and their corresponding MFI is plotted. The shaded region in each plot represents the range of signals detected in each experiment.
FIG 7
FIG 7
Model of altered DRiP antigen presentation induced by Chlamydia infection. (A) Synthesis of self-proteins on host ribosomes results in the formation of a functional protein or the creation of a DRiP, and this balance exists in some proportion. (B) Upon infection with Chlamydia, a bacterium-derived product shifts the balance of host protein synthesis to favor the generation of DRiPs at the expense of stable protein generation, resulting in an increased level of host-derived peptides from the rapidly degraded DRiP fraction.

Similar articles

Cited by

References

    1. Wizel B, Nyström-Asklin J, Cortes C, Tvinnereim A. 2008. Role of CD8+ T cells in the host response to Chlamydia. Microbes Infect 10:1420–1430. doi:10.1016/j.micinf.2008.08.006. - DOI - PMC - PubMed
    1. Holland MJ, Faal N, Sarr I, Joof H, Laye M, Cameron E, Pemberton-Pigott F, Dockrell HM, Bailey RL, Mabey DCW. 2006. The frequency of Chlamydia trachomatis major outer membrane protein-specific CD8+ T lymphocytes in active trachoma is associated with current ocular infection. Infect Immun 74:1565–1572. doi:10.1128/IAI.74.3.1565-1572.2006. - DOI - PMC - PubMed
    1. Kim S-K, Devine L, Angevine M, DeMars R, Kavathas PB. 2000. Direct detection and magnetic isolation of Chlamydia trachomatis major outer membrane protein-specific CD8+ CTLs with HLA class I tetramers. J Immunol 165:7285–7292. doi:10.4049/jimmunol.165.12.7285. - DOI - PubMed
    1. Darville T, Hiltke TJ. 2010. Pathogenesis of genital tract disease due to Chlamydia trachomatis. J Infect Dis 201:S114–S125. - PMC - PubMed
    1. Hansen TH, Bouvier M. 2009. MHC class I antigen presentation: learning from viral evasion strategies. Nat Rev Immunol 9:503–513. doi:10.1038/nri2575. - DOI - PubMed

Publication types