. 2015 Nov 23;36(3):438-51.
doi: 10.1128/MCB.00747-15. Print 2016 Feb 1.

p53 Restoration in Induction and Maintenance of Senescence: Differential Effects in Premalignant and Malignant Tumor Cells

Affiliations

p53 Restoration in Induction and Maintenance of Senescence: Differential Effects in Premalignant and Malignant Tumor Cells

Mohamad Harajly et al. Mol Cell Biol. .

Abstract

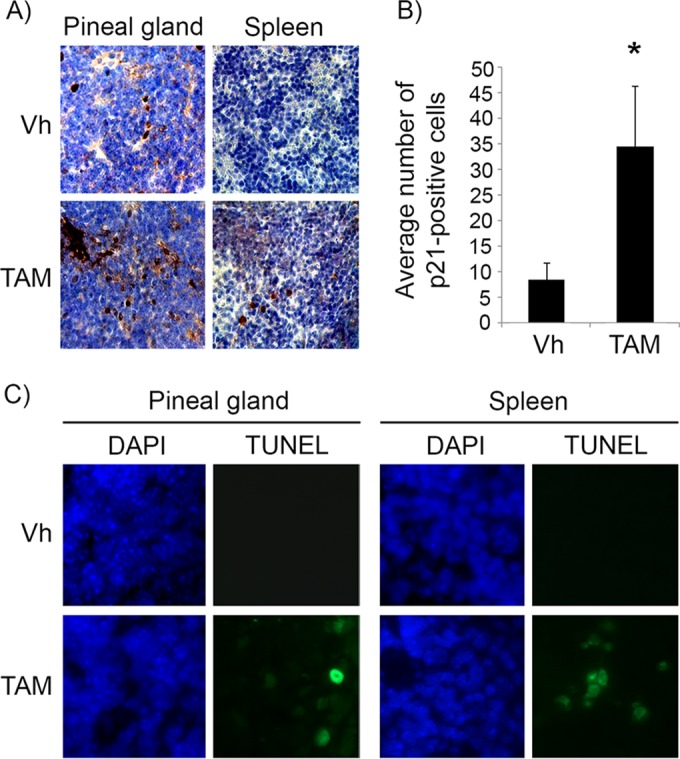
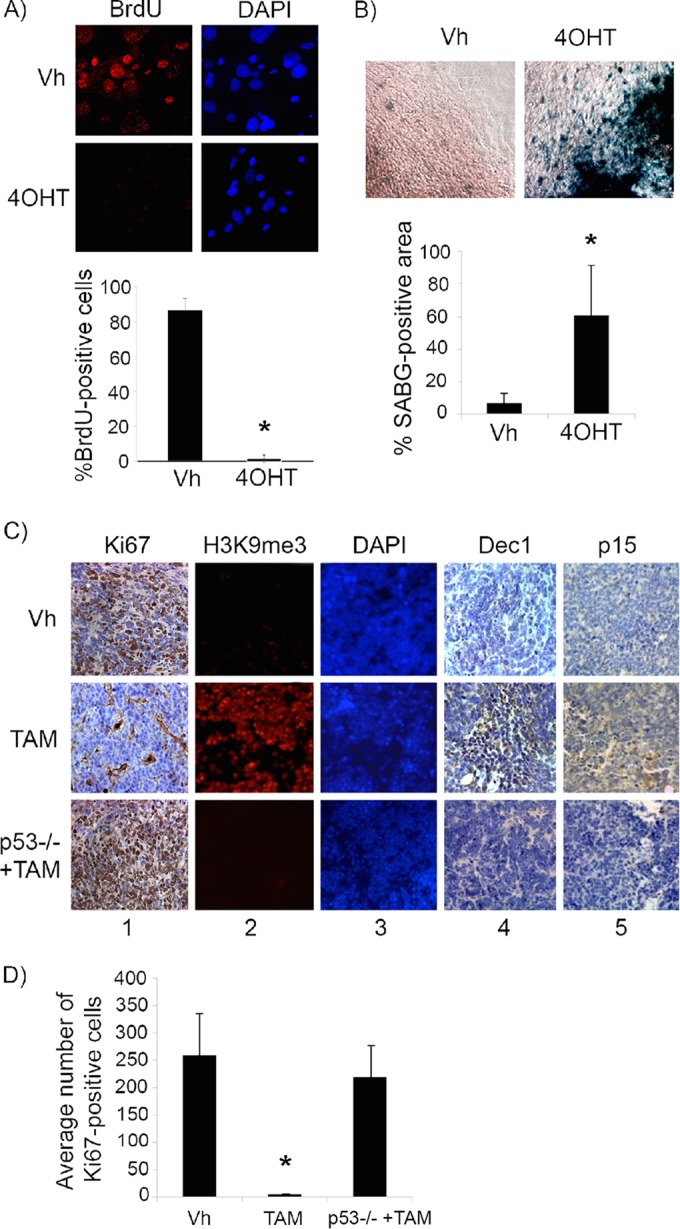
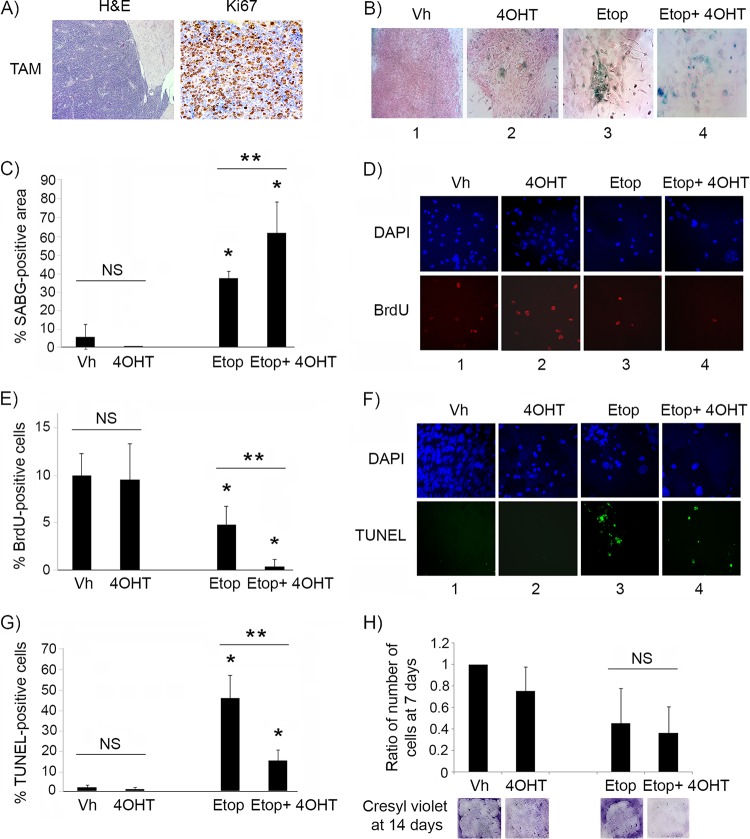
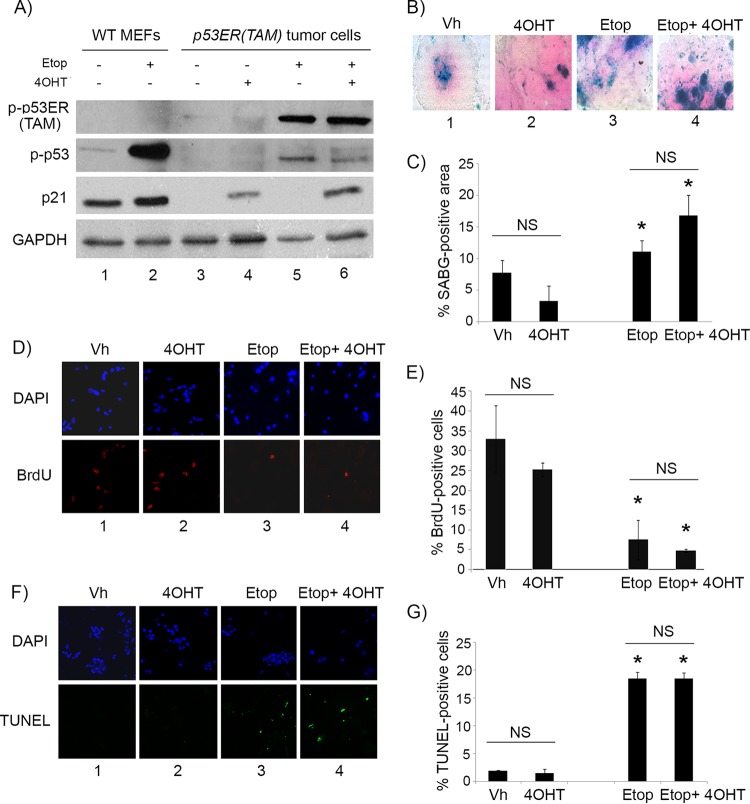
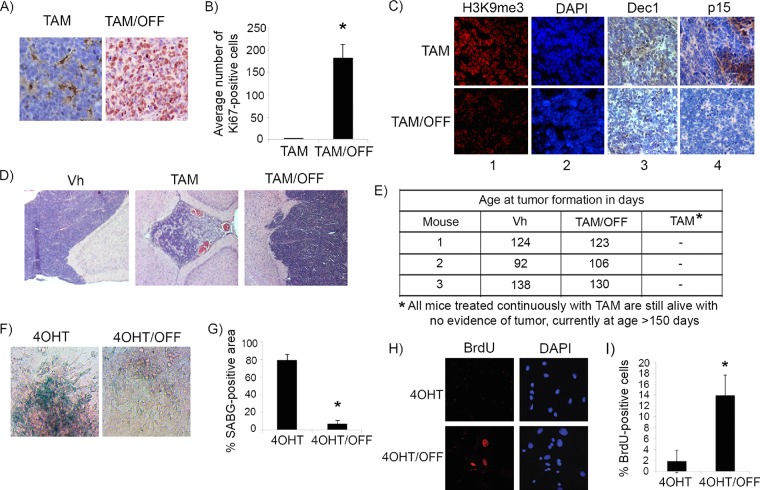
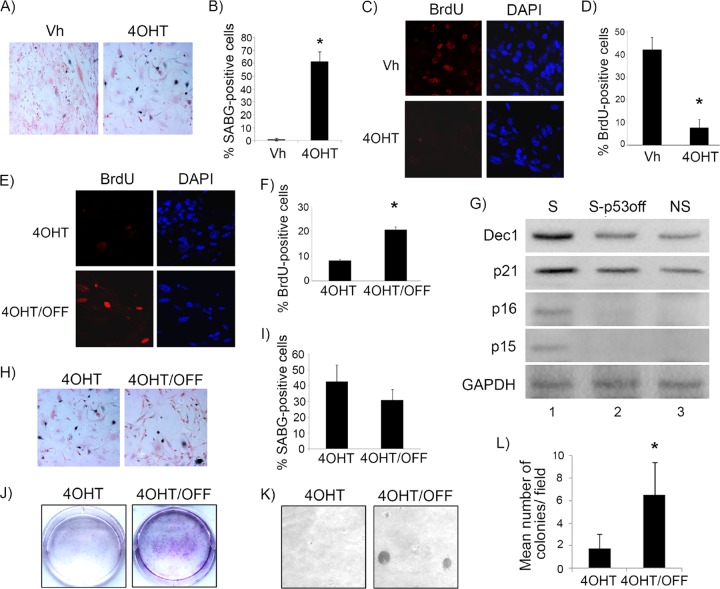
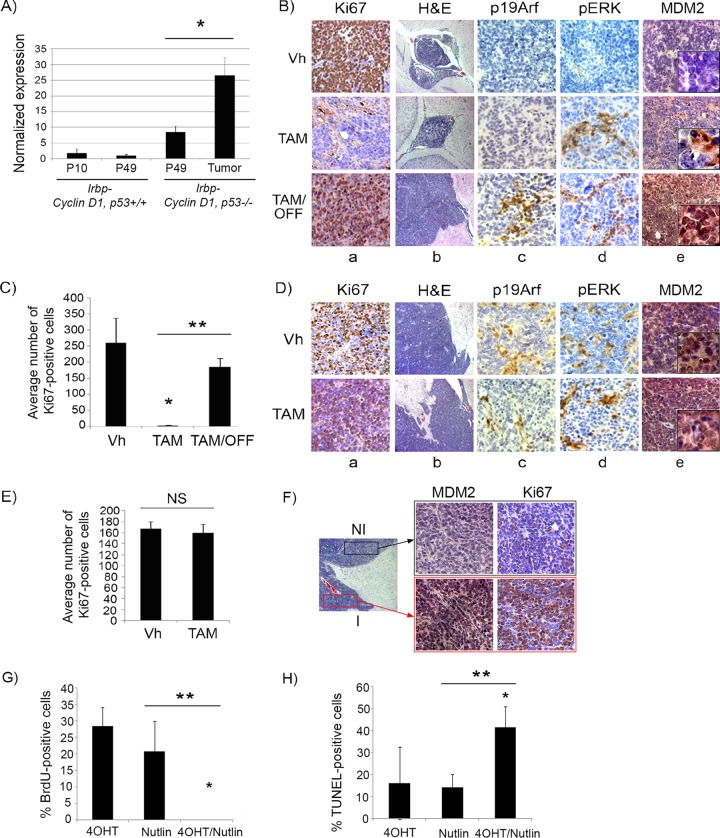
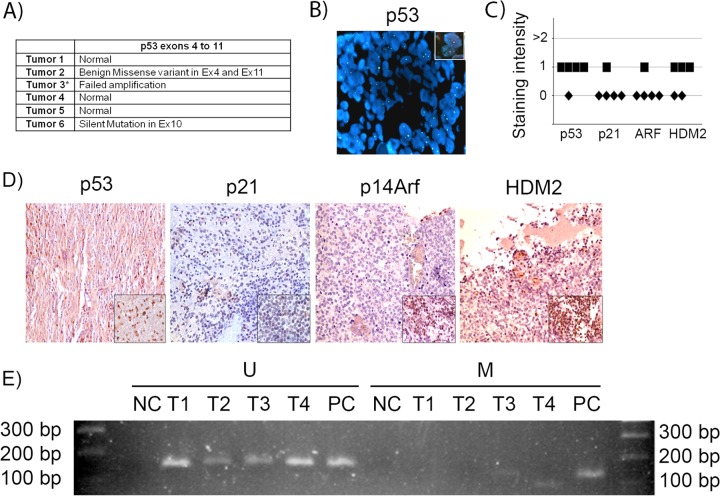
The restoration of p53 has been suggested as a therapeutic approach in tumors. However, the timing of p53 restoration in relation to its efficacy during tumor progression still is unclear. We now show that the restoration of p53 in murine premalignant proliferating pineal lesions resulted in cellular senescence, while p53 restoration in invasive pineal tumors did not. The effectiveness of p53 restoration was not dependent on p19(Arf) expression but showed an inverse correlation with Mdm2 expression. In tumor cells, p53 restoration became effective when paired with either DNA-damaging therapy or with nutlin, an inhibitor of p53-Mdm2 interaction. Interestingly, the inactivation of p53 after senescence resulted in reentry into the cell cycle and rapid tumor progression. The evaluation of a panel of human supratentorial primitive neuroectodermal tumors (sPNET) showed low activity of the p53 pathway. Together, these data suggest that the restoration of the p53 pathway has different effects in premalignant versus invasive pineal tumors, and that p53 activation needs to be continually sustained, as reversion from senescence occurs rapidly with aggressive tumor growth when p53 is lost again. Finally, p53 restoration approaches may be worth exploring in sPNET, where the p53 gene is intact but the pathway is inactive in the majority of examined tumors.


Figures

FIG 1
FIG 1
Tamoxifen treatment restores p53 activity in pineal glands in vivo. (A) Representative immunostaining for p21Cip1 in pineal gland sections and spleen of Irbp-Cyclin D1, p53ER(TAM)Ki/− mice that underwent irradiation after treatment for 6 days (P10 to P16) with vehicle (Vh) or tamoxifen (TAM) as indicated. (B) Number of p21-positive cells per field under the conditions shown in panel A. Each point represents the means from 2 independent experiments. Bars represent standard deviations, and an asterisk denotes a statistically significant difference (P < 0.05). (C) Representative TUNEL staining (green) and corresponding DAPI nuclear stain (blue) under the same conditions as those for panel A.
FIG 2
FIG 2
p53 restoration induces senescence in premalignant cyclin D1-expressing pineal cells. (A and B) Shown are representative staining for BrdU along with the corresponding DAPI nuclear stain (A) and senescence-associated beta-galactosidase (SABG) staining (B) in Irbp-CyclinD1, p53ERTAMKi/− pineal cells explanted at P10 and treated for 7 days with either vehicle (Vh) or 4OHT to restore p53, as indicated. The bottom panels show percent BrdU-positive cells (A) and SABG-positive area (measured in pixel density, as explained in Materials and Methods) (B) under each condition, as indicated. Each point represents the means from 3 independent experiments. (C) Representative immunostaining for the indicated proteins in pineal gland sections from Irbp-Cyclin D1, p53ER(TAM)Ki/− mice treated for 10 days (P60 to P70) with Vh or tamoxifen (TAM) and, as controls, Irbp-Cyclin D1, p53−/− mice treated with TAM (p53−/− + TAM). (D) Number of Ki67-positive cells per field under each condition shown in panel C as indicated. Each point represents the means using at least 4 pineal glands. Bars represent standard deviations, and asterisks denote a statistically significant difference (P < 0.05).
FIG 3
FIG 3
p53 restoration is not effective in suppressing proliferation of malignant pineal tumor cells unless combined with genotoxic stress. (A) Representative hematoxylin and eosin staining (H&E) and Ki67 immunostaining in Irbp-Cyclin D1, p53ER(TAM)Ki/− pineal tumors after 6 days of treatment with tamoxifen (TAM) to restore p53. (B) Representative staining for SABG in explanted Irbp-Cyclin D1, p53ERTAMKi/− pineal tumor cells treated for 7 days with vehicle (Vh), 4OHT to restore p53, etoposide to induce genotoxic stress (Etop), or etoposide and 4OHT (Etop + 4OHT), as indicated. (C) Percent SABG-positive area under the conditions described for panel B, where area was measured in pixel density as explained in Materials and Methods. (D) Representative BrdU level and corresponding DAPI nuclear staining under the same conditions as those for panel B. (E) Percent BrdU-positive cells for the conditions depicted in panel D. (F) Representative TUNEL staining to detect apoptosis, under the same conditions as those for panel B, at 48 h after treatment. (G) Percent TUNEL-positive cells under the same conditions as those for panel F. (H, upper) Quantitation of the total number of cells under the conditions described for panel B at 7 days after treatment and normalized to the vehicle-treated control. (Lower) Cresyl violet stain for colony formation assay under the same conditions at 14 days after treatment. Each point in panels C, E, G, and H represents the means from at least 5 fields and is representative of at least 2 independent experiments. Bars represent standard deviations, asterisks denote a statistically significant difference (P < 0.05), and NS denotes nonsignificant difference. A single asterisk denotes significance relative to corresponding control conditions (Vh and 4OHT, respectively), while double asterisks denote significance relative to Etop-treated cells, as shown by the horizontal bar.
FIG 4
FIG 4
4OHT restores p53 activity in p53ER(TAM) cells and has no effect on explanted Irbp-Cyclin D1, p53−/− tumor cells. (A) Western blotting for the indicated proteins in wild-type MEFs (WT MEF) as controls and in p53ERTAM pineal tumor cells treated for 48 h with 10 μM etoposide (Etop) or vehicle and with 4-hydroxytamoxifen (4OHT) or vehicle. GAPDH was used as a loading control. (B, D, and F) Representative staining for SABG (B) and BrdU (D, lower), and the corresponding DAPI nuclear stain (D, upper), at 7 days after treatment and TUNEL staining (F, lower) and the corresponding DAPI nuclear stain (upper) at 48 h after treatment in explanted Irbp-Cyclin D1, p53−/− pineal tumor cells treated with vehicle (Vh), 4OHT, etoposide, or both (Etop + 4OHT), as indicated. (C, E, and G) Percentages of SABG-positive area (C), BrdU-positive cells (E), and TUNEL-positive cells (G) under the conditions shown in panels B, D, and F, respectively. Each point represents the means from at least 5 fields and is representative of 2 independent experiments. Bars represent standard deviations, and asterisks denote a statistically significant difference (P < 0.05) relative to the respective control conditions (Vh and 4OHT, respectively). NS denotes nonsignificance relative to the condition shown by the horizontal bar.
FIG 5
FIG 5
p53 is needed for the maintenance of the senescence-like response in cyclin D1-expressing pineal cells. (A) Representative immunostaining for Ki67 in pineal gland sections of Irbp-Cyclin D1, p53ER(TAM)Ki/− mice treated for 10 days (P60 to P70) with TAM to restore p53 and then either treated further with tamoxifen (TAM) or withdrawn from treatment (TAM/OFF) to inactivate p53 for another 10 days, as indicated. (B) Mean number of Ki67-positive cells per field under the conditions shown in panel A. Each point represents the means from at least 5 fields and is representative of 2 independent experiments. (C) Representative immunostaining for the indicated markers of senescence under the same conditions as those for panel A. (D) Representative hematoxylin and eosin staining of Irbp-Cyclin D1, p53ER(TAM)Ki/− pineal glands from mice treated for 10 days (P60 to P70) with vehicle (Vh) and from mice that were treated for 10 days with tamoxifen to restore p53 and then either treated further with tamoxifen or that had tamoxifen withdrawn to inactivate p53 (TAM/OFF) for another 10 days, as indicated. (E) Age at clinical tumor formation in a cohort of mice treated with vehicle, tamoxifen for 1 month from P60 to P90 (TAM/OFF), or continuous tamoxifen treatment, as indicated. (F and H) Representative staining for SABG (F) and BrdU (H, left) and corresponding DAPI nuclear stain (H, right) in Irbp-CyclinD1, p53ERTAMKi/− pineal cells explanted at P10. The cells were treated for 7 days with 4OHT to restore p53 and then either treated further with 4OHT (4OHT) or withdrawn from tamoxifen treatment to inactivate p53 (4OHT/OFF) for another 7 days as indicated. (G and I) Percentages of SABG-positive area (G) and BrdU-positive cells (I), under the conditions shown in panel F and H, respectively, are shown. Each point represents the means from at least 5 fields and is representative of 2 independent experiments. Bars represent standard deviations, and asterisks denote a statistically significant difference (P < 0.05).
FIG 6
FIG 6
p53 is necessary for maintenance of RasV12-induced senescence in fibroblasts. (A) Representative staining for SABG in p53ERTAMKi/− MEFs transduced with RasV12 and treated with either vehicle (Vh) or 4-OH tamoxifen (4OHT) to restore p53, as indicated. (B) Percent SABG-positive cells under the conditions represented in panel A. (C) BrdU and corresponding DAPI nuclear stain in p53ERTAMKi/− MEFs treated as described for panel A. (D) Percent BrdU-positive cells under the conditions represented in panel C. (E) Representative staining for BrdU and corresponding DAPI nuclear stain in p53ERTAMKi/− MEFs after RasV12 transduction and treatment with 4OHT to restore p53 for 1 week. After this, 4OHT treatment continued (4OHT) or was withdrawn to inactivate p53 (4OHT/OFF) for another week. (F) Percent BrdU-positive cells under the conditions represented in panel E. (G) Western blotting for the indicated proteins in p53ERTAMKi/− MEFs after RasV12 transduction and treatment with 4OHT to restore p53 for 2 weeks (senescent cells [S]) or treatment with 4OHT for 1 week and then withdrawal to inactivate p53 for another week (S-p53OFF) or in control, RasV12-transduced, vehicle-treated MEFs as never-senescent controls (NS). (H) Representative staining for SABG in p53ERTAMKi/− MEFs treated as described for panel E. (I) Percent SABG-positive cells under the conditions represented in panel H. (J and K) Cell density assay by Cresyl violet staining (J) and soft-agar colony formation assay (K) in RasV12-transduced p53ERTAMKi/− MEFs after treatment with 4OHT to restore p53 for 1 week. Treatment was continued (4OHT) or was withdrawn to inactivate p53 (4OHT/OFF) for another 2 weeks, as indicated. (L) Mean number of colonies per field under each condition shown in panel K. Each point in panels B, D, F, I, and L represents the means from at least 5 fields and is representative of at least 2 independent experiments. Bars represent standard deviations, and asterisks denote a statistically significant difference (P < 0.05).
FIG 7
FIG 7
Mdm2 but not p19Arf expression levels correlate with p53 restoration efficacy in pineal tumors. (A) qRT-PCR analysis of mRNA expression levels of p19Arf relative to those of GAPDH in Irbp-Cyclin D1, p53+/+ pineal glands at P10 (proliferating, presenescent) or P49 (senescent) and Irbp-Cyclin D1, p53−/− pineal glands at the pretumorigenic (P49) or tumor (Tumor) stage, as indicated. Each point represents the means from 3 independent experiments. Bars represent standard deviations, and asterisks denote a statistically significant difference (P < 0.05). (B) Representative immunostaining for the indicated proteins and hematoxylin and eosin staining (H&E) in Irbp-Cyclin D1, p53ER(TAM)Ki/− premalignant lesions treated with vehicle (Vh), tamoxifen from P60 to P80 (TAM), and tamoxifen for 10 days from P60 to P70 followed by its withdrawal from P70 to P80 (TAM/OFF). The inset in column e shows a magnified image. (C) Average number of Ki67-positive cells per field under the conditions described for panel B. (D) Representative immunostaining for the indicated proteins and H&E staining in Irbp-Cyclin D1, p53ER(TAM)Ki/− pineal invasive tumors treated with vehicle (Vh) or tamoxifen for 10 days (TAM). The inset in column e shows a magnified image. (E) Average number of Ki67-positive cells per field under the conditions described for panel D. Each point in panels C and E represents the means from at least 4 different mouse pineal sections. Bars represent standard deviations. A single asterisk denotes significance (P < 0.05) relative to corresponding control conditions (Vh), while double asterisks denote significance relative to results for TAM-treated mice, as shown by the horizontal bar. NS denotes nonsignificance. (F) Immunostaining for MDM2 (left) and Ki67 (right) in an Irbp-Cyclin D1, p53ER(TAM)Ki/− pineal lesion in transformation that has both premalignant noninvasive (NI) and invasive (I) tumor components. (G) Percent BrdU-positive cells in explanted Irbp-Cyclin D1, p53ERTAMKi/− pineal tumor cells 7 days after treatment with 4OHT, nutlin, or both, as indicated. (H) Percent TUNEL-positive cells after 24 h of treatment under the same conditions as those for panel G. Each point in panels G and H represents the means from at least 5 different fields. Bars represent standard deviations. A single asterisk denotes significance (P < 0.05) relative to the 4OHT control condition, while double asterisks denote significance relative to the nutlin condition, as shown by the horizontal bar.
FIG 8
FIG 8
p53 gene and pathway likely are not active in human sPNET. (A) Results of sequencing of p53 exons 4 to 11 in 6 human sPNET samples. (B) FISH staining for p53 gene deletion in tumor 3. The inset shows a positive control. (C) Quantitation of the intensity of expression of p53, p21CIP1, p14ARF, and HDM2, detected by immunohistochemistry, in sPNET samples. (D) Representative images of immunostaining for the indicated proteins in human sPNET samples. The insets represent the respective positive controls. (E) Analysis of p14Arf promoter methylation status in sPNET samples (T1, T2, T3, and T4), showing unmethylated (U) and methylated (M) sequences. NC, negative control; PC, positive control.

References

    1. Muñoz-Espín D, Serrano M. 2014. Cellular senescence: from physiology to pathology. Nat Rev Mol Cell Biol 15:482–496. doi:10.1038/nrm3823. - DOI - PubMed
    1. Collado M, Gil J, Efeyan A, Guerra C, Schuhmacher AJ, Barradas M, Benguría A, Zaballos A, Flores JM, Barbacid M, Beach D, Serrano M. 2005. Tumour biology: senescence in premalignant tumours. Nature 436:642. doi:10.1038/436642a. - DOI - PubMed
    1. Pérez-Mancera PA, Young AR, Narita M. 2014. Inside and out: the activities of senescence in cancer. Nat Rev Cancer 14:547–558. doi:10.1038/nrc3773. - DOI - PubMed
    1. Saab R. 2011. Senescence and pre-malignancy: how do tumors progress? Semin Cancer Biol 21:385–391. doi:10.1016/j.semcancer.2011.09.013. - DOI - PubMed
    1. Rufini A, Tucci P, Celardo I, Melino G. 2013. Senescence and aging: the critical roles of p53. Oncogene 32:5129–5143. doi:10.1038/onc.2012.640. - DOI - PubMed

Publication types

MeSH terms

Substances