. 2015 Nov 23;211(4):913-31.
doi: 10.1083/jcb.201502074.

A bacterial type III secretion-based protein delivery tool for broad applications in cell biology

Affiliations

A bacterial type III secretion-based protein delivery tool for broad applications in cell biology

Simon J Ittig et al. J Cell Biol. .

Abstract

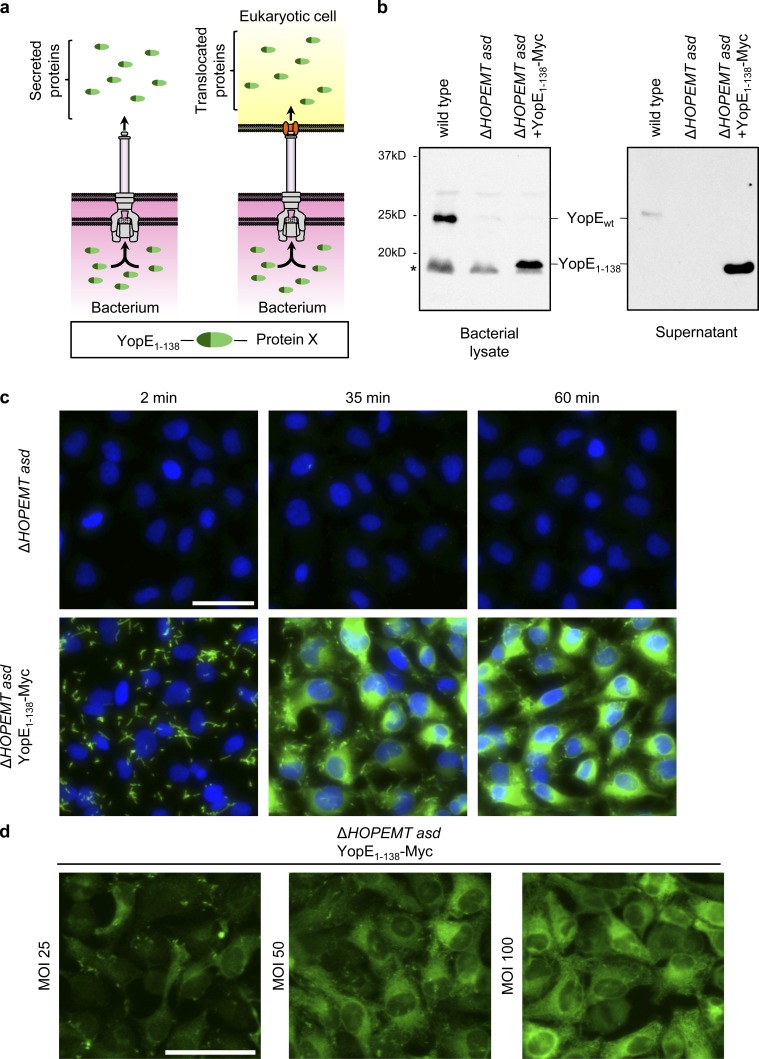
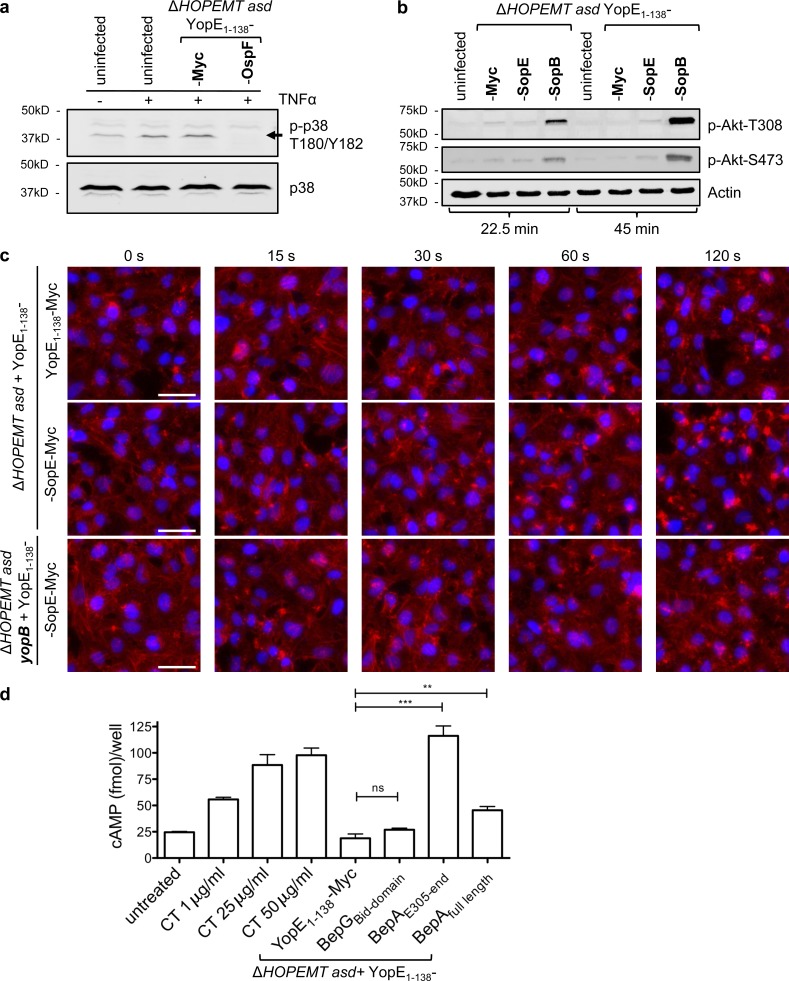
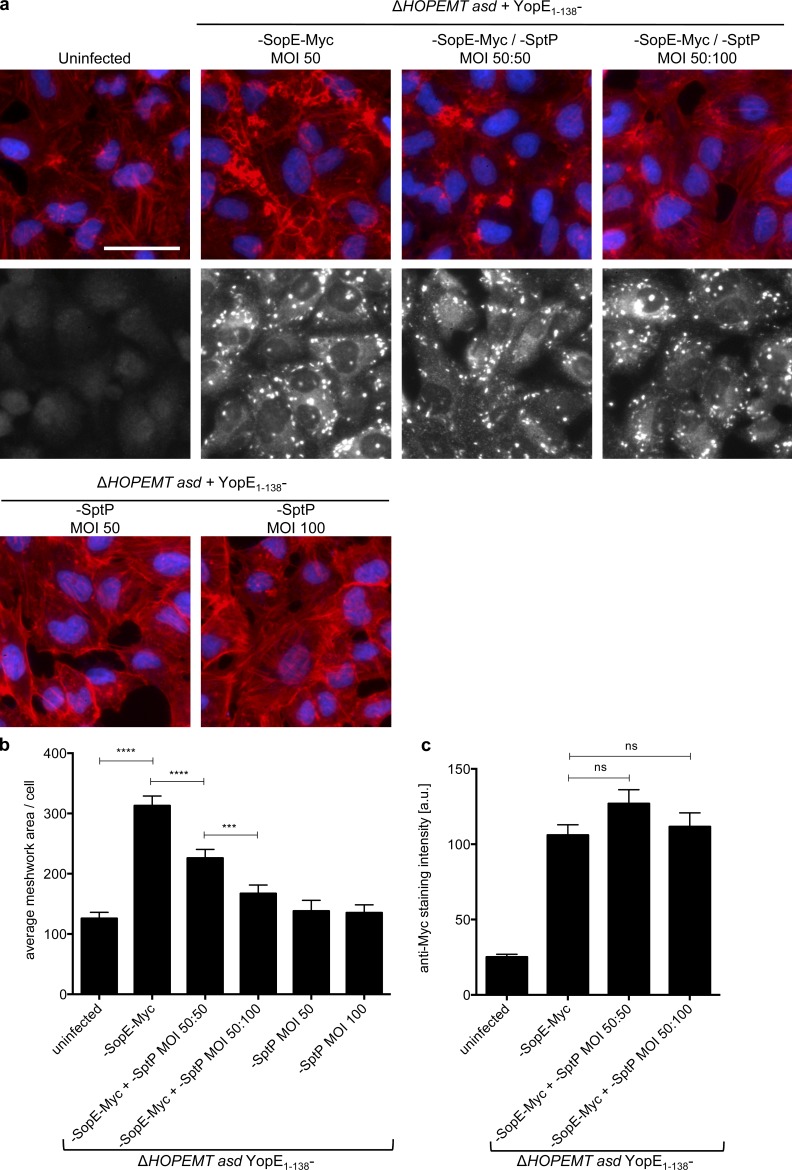
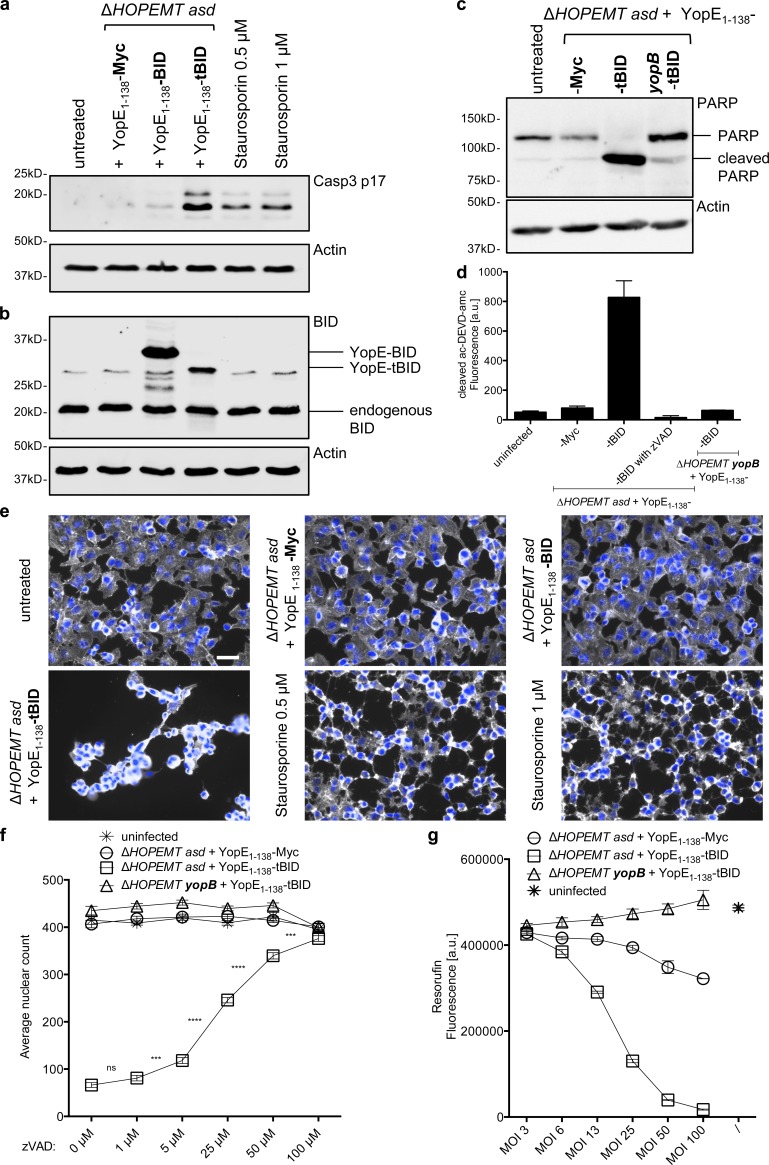
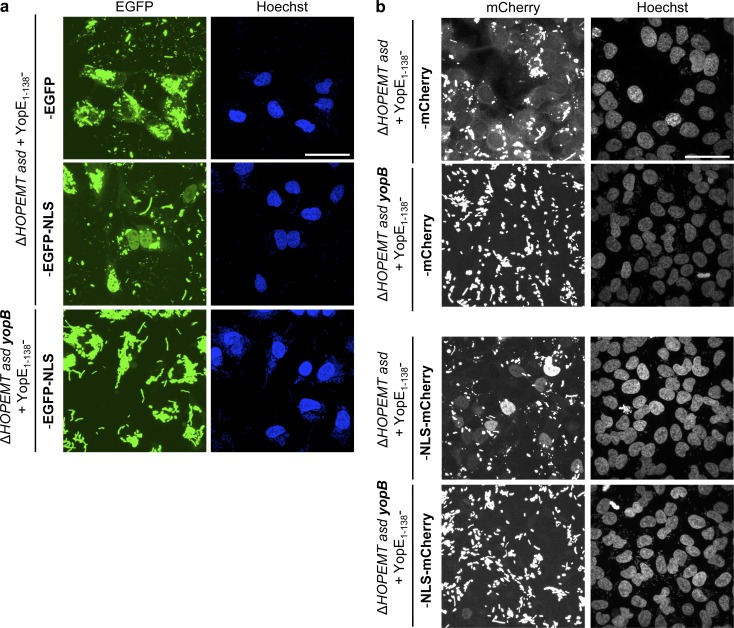
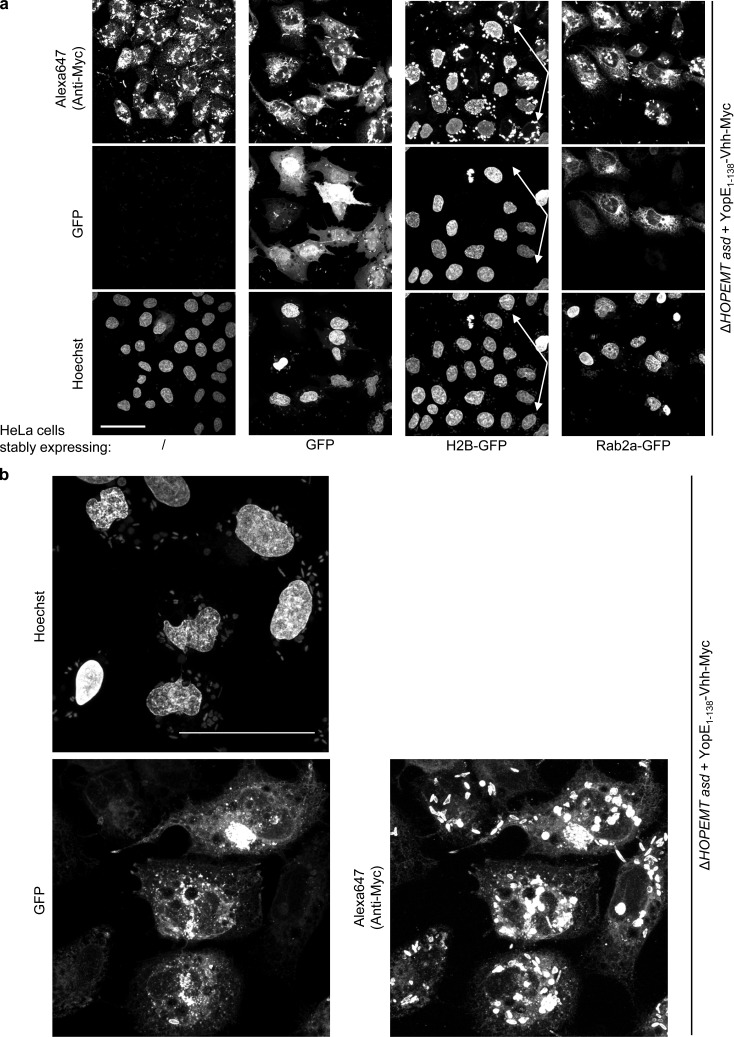
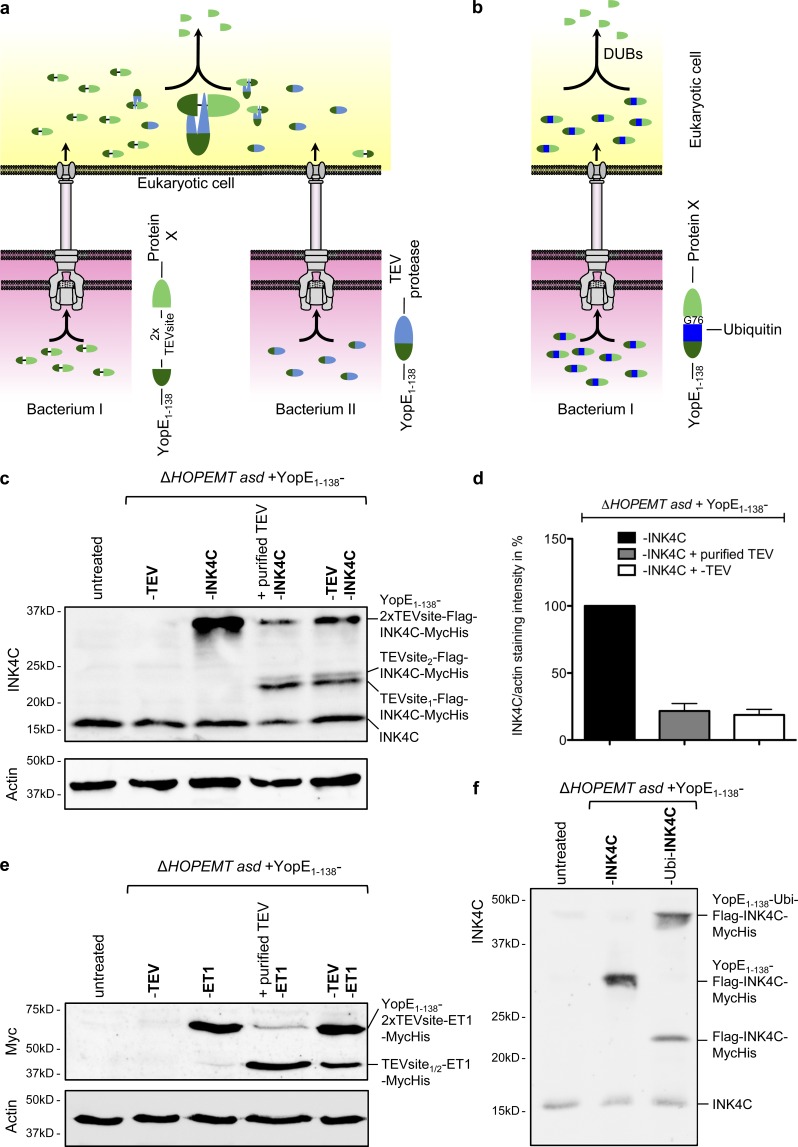
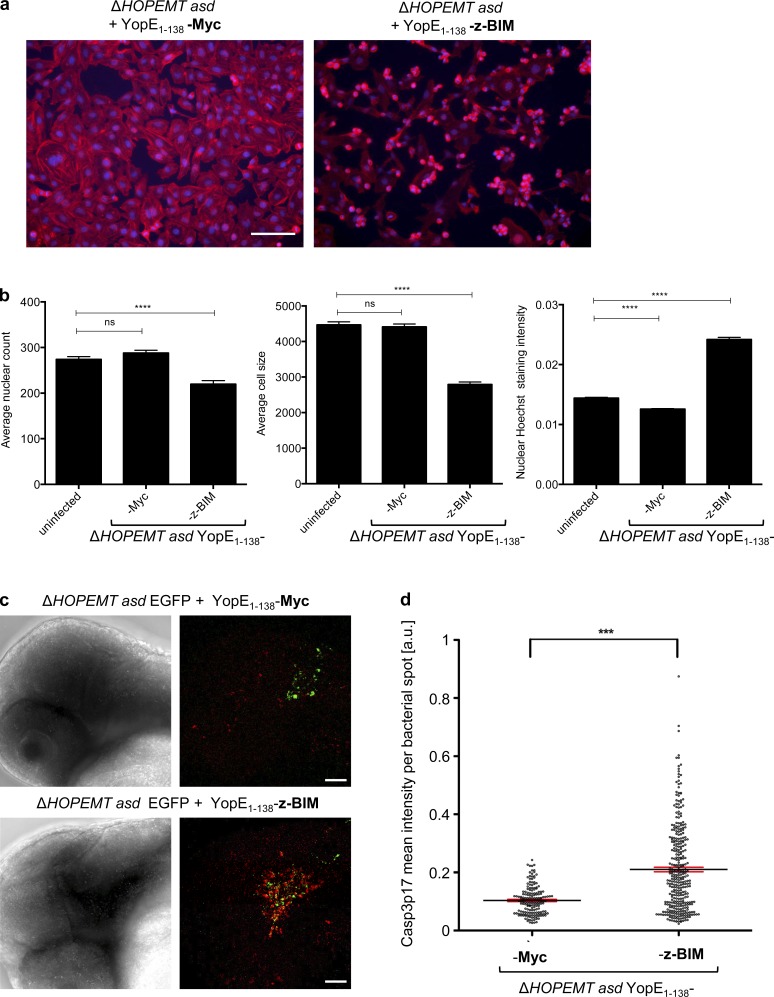
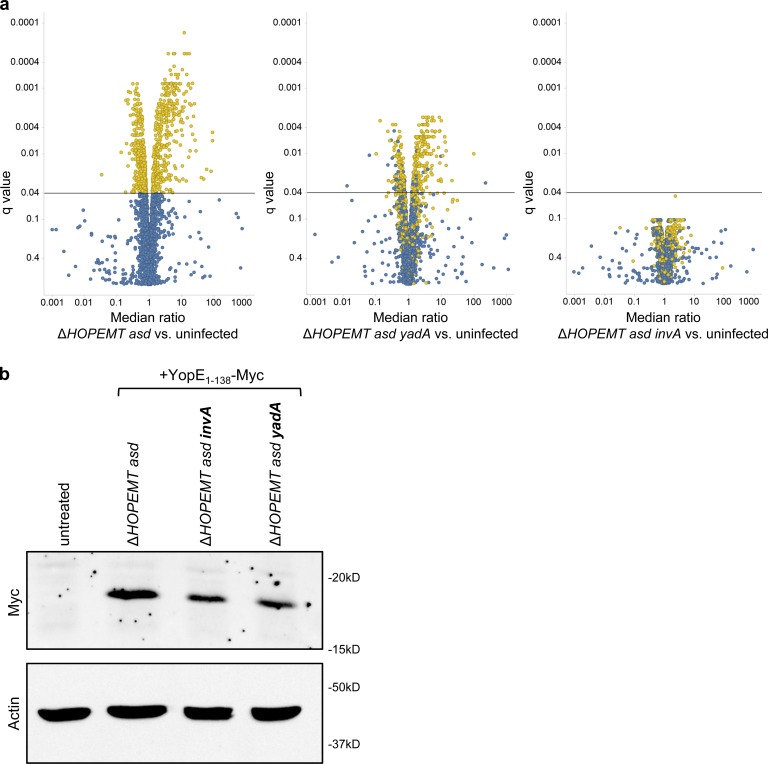
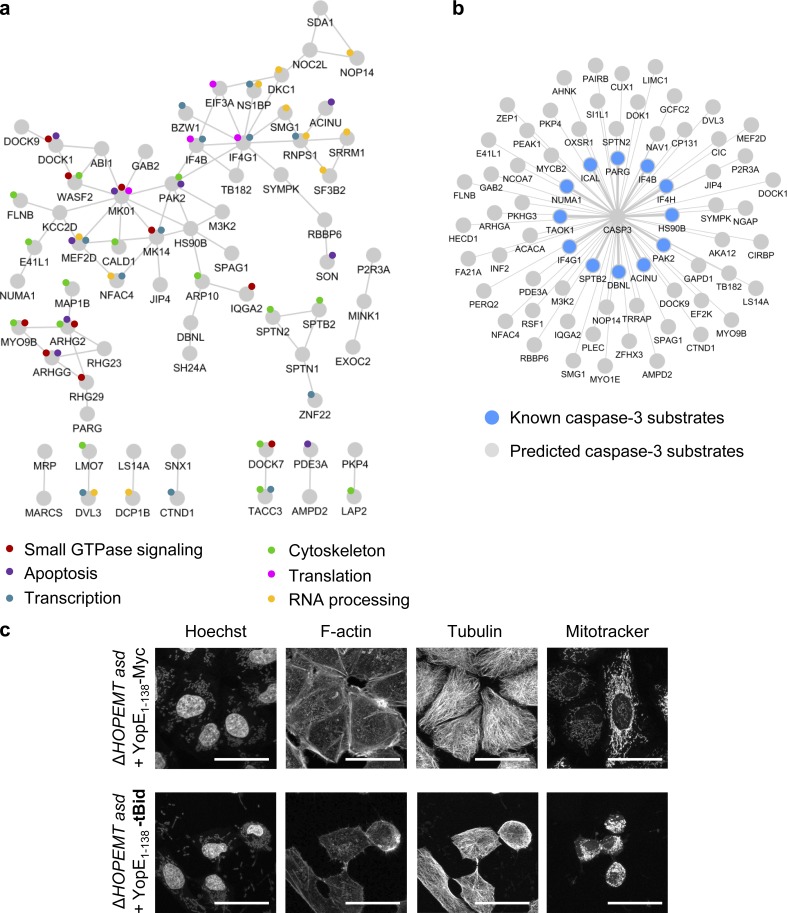
Methods enabling the delivery of proteins into eukaryotic cells are essential to address protein functions. Here we propose broad applications to cell biology for a protein delivery tool based on bacterial type III secretion (T3S). We show that bacterial, viral, and human proteins, fused to the N-terminal fragment of the Yersinia enterocolitica T3S substrate YopE, are effectively delivered into target cells in a fast and controllable manner via the injectisome of extracellular bacteria. This method enables functional interaction studies by the simultaneous injection of multiple proteins and allows the targeting of proteins to different subcellular locations by use of nanobody-fusion proteins. After delivery, proteins can be freed from the YopE fragment by a T3S-translocated viral protease or fusion to ubiquitin and cleavage by endogenous ubiquitin proteases. Finally, we show that this delivery tool is suitable to inject proteins in living animals and combine it with phosphoproteomics to characterize the systems-level impact of proapoptotic human truncated BID on the cellular network.


Figures

Figure 1.
Figure 1.
Characterization of T3S-based protein delivery. (a) Schematic representation of T3S-dependent protein secretion into the supernatant (in vitro secretion) or eukaryotic cells (protein translocation). (b) Bacterial lysate or in vitro secretion (supernatant) of indicated strains revealed by Western blot using an anti-YopE antibody. Asterisk indicates a nonspecific band. (c) Anti-Myc immunofluorescence staining of HeLa cells infected with the indicated strains at an MOI of 100. Anti-Myc staining is shown in green and nuclei in blue. (d) Anti-Myc staining of HeLa cells infected for 45 min with the indicated strain at different MOIs. Anti-Myc staining is shown in green. Bars, 50 µm.
Figure 2.
Figure 2.
Delivery of type III and type IV effectors into eukaryotic cells. (a) TNF-induced phosphorylation of p38 is abolished by translocated OspF. Phospho-p38 (indicated by the arrow) and total p38 revealed by Western blot analysis of HeLa cells infected for 75 min with the indicated strains at an MOI of 100. Cells were stimulated with TNF for the last 30 min of infection. (b) Translocated SopB induces Akt phosphorylation at T308 and S473. Phospho-Akt and actin Western blot analysis of HeLa cells infected for 22.5 or 45 min with the indicated strains at an MOI of 100. (c) Translocated SopE induces a dramatic remodelling of F-actin. HeLa cells were infected with the indicated strains at an MOI of 100 for the indicated time periods. After fixation, cells were stained for nuclei (blue) and F-actin (red). Bars, 50 µm. (d) T3S-based protein delivery of BepA type IV effector. Measurements of cAMP levels in HeLa cells infected for 2.5 h with the indicated strains at an MOI of 100. As positive control, cholera toxin (CT) was added for 1 h at indicated concentrations. Data correspond to the mean of n = 3 independent experiments, and error bars are standard errors of the mean. Statistical analysis was performed using a Mann-Whitney test (**, P < 0.01; ***, P < 0.001; ns, not significant).
Figure 3.
Figure 3.
Use of T3S-based protein delivery for functional interaction studies. (a) When coinjected, SptP abolishes the activity of SopE. HeLa cells were infected with indicated combinations of strains at indicated MOI for 1 h. After fixation, cells were stained for nuclei (blue) and F-actin (red). Translocation of YopE1–138-SopE-Myc was monitored by an anti-Myc staining (gray images), which also stains bacteria (bright dots). Bar, 50 µm. (b) Quantification of the F-actin meshwork area per cell of images shown in panel a. (c) Quantification of the Myc staining intensity of images shown in panel a (gray images). Image analysis was performed on n = 60 cells per condition. Error bars indicate standard errors of the mean, and statistical analysis was performed using a Mann-Whitney test (***, P < 0.001; ****, P < 0.0001; ns, not significant).
Figure 4.
Figure 4.
Delivery of human tBID into cells induces massive apoptosis. (a) Translocated tBID induces CASP3 cleavage. Cleavage of CASP3 into the p17 subunit was monitored by Western blot analysis of HeLa cells infected for 60 min with the indicated strains at an MOI of 100 or treated with staurosporine. (b) Translocated YopE1–138-BID fusion proteins reach endogenous levels. Digitonin-lysed HeLa cells, infected for 1 h with the indicated strains as shown in panel a at an MOI of 100, were analyzed by Western blot analysis with an anti-BID antibody to compare endogenous BID, translocated YopE1–138-BID and YopE1-138-tBID levels. (c) Translocated tBID induces PARP cleavage. Cleavage of PARP was monitored by Western blot analysis of HeLa cells infected for 60 min with the indicated strains at an MOI of 100. (d) Delivery of t-BID activates CASP3 as monitored by measuring the fluorogenic substrate ac-DEVD-amc after incubation for 1 h with cell lysates of HeLa cells infected for 60 min with the indicated strains at an MOI of 100. Pan-caspase inhibitor z-VAD was added at 50 µM when indicated. Error bars indicate standard errors of the mean. (e) Translocated tBID induces massive cell loss. HeLa cells were infected with the indicated strains at an MOI of 100 for 1 h or treated with staurosporine. After fixation, cells were stained for nuclei (blue) and F-actin (gray). Bar, 50 µm. (f) Delivery of t-BID leads to a strong reduction in cell number, assessed by counting nuclei. HeLa cells were infected for 60 min with the indicated strains at an MOI of 100. Cells were preincubated 1 h before infection with the indicated concentrations of z-VAD. z-VAD blocks the effect of translocated t-BID in a dose-dependent manner. Automated image analysis was performed on n = 18 images per condition. Error bars indicate standard errors of the mean. Statistical analysis was performed using a Mann-Whitney test (***, P < 0.001; ****, P < 0.0001; ns, not significant). (g) Metabolic activity of HeLa cells 24 h after infection with the indicated strains at indicated MOIs assessed by resazurin assay. 1 h p.i. penicillin and streptomycin were added. Error bars indicate standard errors of the mean.
Figure 5.
Figure 5.
Delivery of EGFP and mCherry fusion proteins and nuclear relocalization. (a) T3S-based delivery of EGFP fusion proteins into cells. EGFP localization was monitored by confocal microscopy of HeLa cells infected with the indicated strains at an MOI of 100 for 4 h. Nuclei were stained with Hoechst. The YopE1–138 fragment does not prevent the nuclear localization of translocated EGFP-NLS. Bar, 50 µm. (b) T3S-based delivery of mCherry fusion proteins into cells. mCherry localization was monitored by confocal microscopy of HeLa cells infected with the indicated strains at an MOI of 50 for 4 h. Nuclei were stained with Hoechst. The YopE1–138 fragment does not prevent the nuclear localization of translocated NLS-mCherry. Bar, 50 µm. Fluorescent images correspond to maximum intensity z projections.
Figure 6.
Figure 6.
Nanobody-dependent targeting of fusion proteins. (a) Nanobody-dependent sub-cellular localization of a translocated Myc-tagged fusion protein. Control HeLa and stable HeLa cell lines expressing EGFP, H2B-GFP, or EGFP-Rab2a were infected at MOI 50 with YopE1–138-VHHGFP4-Myc-encoding bacteria for 4 h (2 h p.i., gentamicin was added) and analyzed by confocal microscopy for EGFP, Myc (stained by Alexa Fluor 647), and Hoechst for the nuclei. Arrows mark HeLa cells lacking H2B-GFP expression. Bar, 50 µm. Fluorescent images correspond to maximum intensity z projections. (b) Stable HeLa cell line expressing EGFP-Rab2a were infected as in panel a and observed at 60× by confocal microscopy for EGFP, Myc (stained by Alexa Fluor 647), and Hoechst for the nuclei. Bar, 50 µm.
Figure 7.
Figure 7.
Cleavage of the YopE1138 fragment from the translocated fusion protein. (a) Schematic representation of the strategy developed to cleave off the YopE1–138-fragment after T3S-dependent protein delivery into HeLa cells. HeLa cells are coinfected with two different Y. enterocolitica strains. One strain delivers the TEV protease fused to YopE1–138, whereas the other strain delivers a protein of interest fused to YopE1–138 via a linker containing a double TEV protease cleavage site. After protein delivery into the eukaryotic cell, TEV cleaves off the YopE1–138 fragment from the protein of interest X. (b) Schematic representation of the strategy developed to cleave off the YopE1–138 fragment after T3S-dependent protein delivery into HeLa cells by fusion to ubiquitin. Ubiquitin is processed at its C terminus (after G76) by a group of endogenous ubiquitin-specific C-terminal proteases (DUBs), leading to the liberation of the protein C-terminally fused to ubiquitin. (c) TEV-mediated cleavage of the YopE1–138 fragment from the INK4C fusion protein. Digitonin-lysed HeLa cells infected for 2 h with the indicated strains each at an MOI of 100 were analyzed by Western blot with an anti-INK4C antibody for the presence of YopE1–138-2xTEVsite–Flag–INK4C–MycHis or its cleaved form Flag–INK4C–MycHis. In lane 4, cell lysate was incubated overnight with purified TEV protease. (d) Quantification of TEV-mediated cleavage. Cleavage was measured by quantifying the band corresponding to YopE1–138–2x TEV site–Flag–INK4C from panel c normalized to the actin staining intensity. Intensity of the lane 3 band was set to 100%. Data correspond to the mean of n = 2 independent experiments, and error bars indicate the standard error of the mean. (e) TEV-mediated cleavage of the YopE1–138 fragment from the ET1-Myc fusion protein. Digitonin-lysed HeLa cells infected for 1 h with the indicated strains at an MOI of 100 were analyzed by Western blotting with an anti-Myc antibody for the presence of YopE1–138–2x TEV site–ET1–Myc or its cleaved form ET1-Myc. In lane 4, cell lysate was incubated overnight with purified TEV protease. (f) Cleavage of YopE1–138–ubiquitin–Flag–INK4C–MycHis after translocation into HeLa cells. Digitonin-lysed HeLa cells infected for 1 h with the indicated strains each at an MOI of 100 were analyzed by Western blot with an anti-INK4C antibody for the presence of YopE1–138–ubiquitin–Flag–INK4C–MycHis or its cleaved form Flag–INK4C–MycHis.
Figure 8.
Figure 8.
T3S-dependent delivery of zebrafish BIM induces apoptosis. (a) Translocated z-BIM induces apoptosis in HeLa cells. HeLa cells were infected with the indicated strains at an MOI of 100 for 1 h. After fixation, cells were stained for nuclei (blue) and F-actin (red). Bar, 50 µm. (b) Automated quantification of mean nuclear count, cell size and nuclear staining intensity as marker for nuclear condensation of n = 84 images as in panel a. Error bars indicate standard errors of the mean. Statistical analysis was performed using a Mann-Whitney test (***, P < 0.001; ****, P < 0.0001; ns, not significant). (c) Translocated z-BIM induces apoptosis in zebrafish embryos. Zebrafish embryos were infected with the EGFP-expressing Y. enterocolitica control strain or YopE1–138-z-BIM delivering strain by injecting 400 bacteria into the hindbrain region. After 5.5 h, embryos were fixed, stained for CASP3 p17 subunit (red), and analyzed by fluorescent microscopy for the presence of bacteria (green). Fluorescent images correspond to maximum intensity z projections. Bars, 50 µm. (d) Automated image analysis of maximum intensity z projections of recorded z-stack images as shown in panel c. In brief, bacteria were detected via the GFP channel. Around each bacterial spot, a circle with a radius of 10 pixels was created and CASP3 p17 staining intensity was measured. Statistical analysis was performed using a Mann-Whitney test (***, P < 0.001). Data represent the mean of n = 14 infected embryos for YopE1–138-Myc and n = 19 for YopE1–138-z-BIM, and error bars (red) indicate standard errors of the mean.
Figure 9.
Figure 9.
Characterization of the cellular impact of T3S-based delivery by phosphoproteomics. (a) Volcano plot representation of the impact of T3S-based delivery on phosphorylation in the presence or in absence of YadA or InvA compared with uninfected cells. HeLa cells were infected for 30 min with the indicated strains at a MOI of 100. Yellow dots represent in all three panels the phosphopeptides associated with a q-value < 0.04 in control infection compared with uninfected cells. Phosphoproteomic analysis was performed in independent triplicates. (b) Digitonin-lysed HeLa cells, infected for 30 min with the indicated strains at an MOI of 100, were analyzed by Western blot analysis with an anti-Myc antibody to detect delivery of YopE1–138-Myc by corresponding strains.
Figure 10.
Figure 10.
Analysis of t-BID-dependent phosphoproteome. (a) Representation of the functional protein interaction network of the tBID phosphoproteome. Proteins, containing at least one phosphopeptide undergoing a change in phosphorylation after tBID delivery (light gray; q-value < 0.04) are represented in a STRING network (high-confidence, score 0.7). Only proteins with at least one connection in STRING are shown. Colored circles depict the biological annotation of proteins as obtained from DAVID (Table S5). (b) Graphical representation of CASP3 known (color) and predicted substrates (gray) as shown in Table S1. (c) Confocal images of HeLa cells infected with either ΔHOPEMT asd + YopE1–138 or ΔHOPEMT asd + YopE1–138-tBID reveal the induction of an apoptotic phenotype after tBID delivery. Cells were stained for the nuclei with Hoechst, for F-actin with phalloidin, for tubulin with an anti-tubulin antibody, and for mitochondria with Mitotracker. Bars, 40 µm.

References

    1. Ayyash M., Tamimi H., and Ashhab Y.. 2012. Developing a powerful in silico tool for the discovery of novel caspase-3 substrates: a preliminary screening of the human proteome. BMC Bioinformatics. 13:14 10.1186/1471-2105-13-14 - DOI - PMC - PubMed
    1. Benard E.L., van der Sar A.M., Ellett F., Lieschke G.J., Spaink H.P., and Meijer A.H.. 2012. Infection of zebrafish embryos with intracellular bacterial pathogens. J. Vis. Exp. 61:3781. - PMC - PubMed
    1. Bensimon A., Schmidt A., Ziv Y., Elkon R., Wang S.Y., Chen D.J., Aebersold R., and Shiloh Y.. 2010. ATM-dependent and -independent dynamics of the nuclear phosphoproteome after DNA damage. Sci. Signal. 3:rs3 10.1126/scisignal.2001034 - DOI - PubMed
    1. Bichsel C., Neeld D.K., Hamazaki T., Wu D., Chang L.J., Yang L., Terada N., and Jin S.. 2011. Bacterial delivery of nuclear proteins into pluripotent and differentiated cells. PLoS ONE. 6:e16465 10.1371/journal.pone.0016465 - DOI - PMC - PubMed
    1. Bichsel C., Neeld D., Hamazaki T., Chang L.J., Yang L.J., Terada N., and Jin S.. 2013. Direct reprogramming of fibroblasts to myocytes via bacterial injection of MyoD protein. Cell Reprogram. 15:117–125. - PMC - PubMed

Publication types

Associated data