. 2016 Jan 5;113(1):200-5.
doi: 10.1073/pnas.1513619112. Epub 2015 Nov 23.

Subsecond dopamine fluctuations in human striatum encode superposed error signals about actual and counterfactual reward

Affiliations

Subsecond dopamine fluctuations in human striatum encode superposed error signals about actual and counterfactual reward

Kenneth T Kishida et al. Proc Natl Acad Sci U S A. .

Abstract

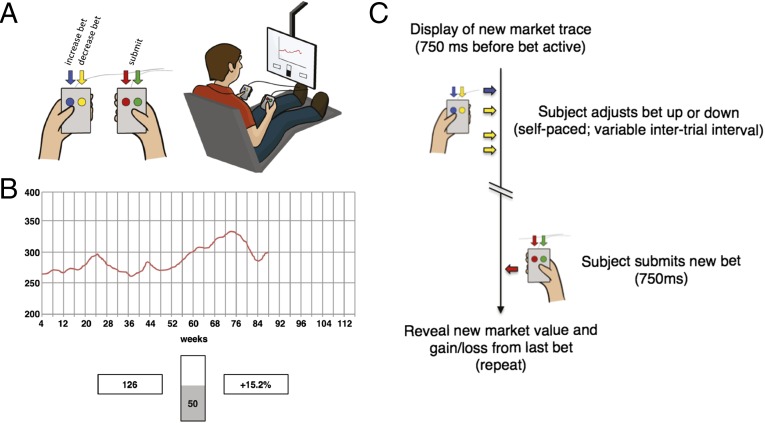
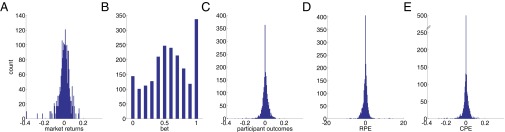
In the mammalian brain, dopamine is a critical neuromodulator whose actions underlie learning, decision-making, and behavioral control. Degeneration of dopamine neurons causes Parkinson's disease, whereas dysregulation of dopamine signaling is believed to contribute to psychiatric conditions such as schizophrenia, addiction, and depression. Experiments in animal models suggest the hypothesis that dopamine release in human striatum encodes reward prediction errors (RPEs) (the difference between actual and expected outcomes) during ongoing decision-making. Blood oxygen level-dependent (BOLD) imaging experiments in humans support the idea that RPEs are tracked in the striatum; however, BOLD measurements cannot be used to infer the action of any one specific neurotransmitter. We monitored dopamine levels with subsecond temporal resolution in humans (n = 17) with Parkinson's disease while they executed a sequential decision-making task. Participants placed bets and experienced monetary gains or losses. Dopamine fluctuations in the striatum fail to encode RPEs, as anticipated by a large body of work in model organisms. Instead, subsecond dopamine fluctuations encode an integration of RPEs with counterfactual prediction errors, the latter defined by how much better or worse the experienced outcome could have been. How dopamine fluctuations combine the actual and counterfactual is unknown. One possibility is that this process is the normal behavior of reward processing dopamine neurons, which previously had not been tested by experiments in animal models. Alternatively, this superposition of error terms may result from an additional yet-to-be-identified subclass of dopamine neurons.

Keywords: counterfactual prediction error; decision-making; dopamine; human fast-scan cyclic voltammetry; reward prediction error.


Conflict of interest statement

The authors declare no conflict of interest.

Figures

Fig. 1.
Fig. 1.
Investment game. (A) Participants played a sequential-choice game during surgery using button boxes (Left) and a visual display (Right). For each patient, bet size adjustments (e.g., increase bet or decrease bet) and the decision to submit one’s answer were performed with button boxes. (B) Investment game (19, 21): participants view a graphical depiction of the market price history (red trace), their current portfolio value (bottom left box), and their most recent outcome (bottom right box) to decide and submit investment decisions (bets) using a slider bar in 10% increments (bottom center). Bet sizes were limited to 0–100% (in 10% increments) of the participant’s portfolio—no shorting of the market was allowed. During an experiment, a participant played 6 markets with 20 decisions made per market. (C) Timeline of events during a single round of the investment game.
Fig. 2.
Fig. 2.
Performance of EN-based dopamine estimation algorithm. (A and B) Performance of PC regression-based approach on out-of-sample test cases. (C–E) Performance of EN-based approach on out-of-sample test cases. For A and B, light blue lines indicate dopamine concentration of prepared out-of-sample calibration solutions, green points indicate PC regression-based predictions accepted by Q-value analysis, and red points indicate PC regression-based predictions rejected by Q-value analysis. The inset scale bar indicates measurement period of 50 s. (A) PC regression-based prediction of changes in dopamine concentration under stable pH (pH 7.4). The prepared dopamine concentration (light blue; 200, 400, 800, and 1,600 nM) compared with the PC regression-based predictions for dopamine concentration (red and green). (B) PC regression-based predictions of dopamine concentration when pH is changed, but dopamine concentration is held constant (0 dopamine in solution). The dotted light blue line indicates actual concentration of dopamine is equal to 0. Insets indicate pH levels (pH range: 7.19, 7.4, 7.6). (C) EN-based predictions of changes in dopamine concentration under stable pH (pH = 7.4). The prepared dopamine concentration (light blue, 200, 400, 800, and 1,600 nM) compared with the EN-based predictions for dopamine concentration (dark blue). The inset scale bar indicates measurement period of 50 s. (D) EN-based predictions of changes in dopamine concentration when pH is changed, but dopamine concentration is held constant (0 dopamine in solution). The dotted light blue line indicates that actual concentration of dopamine is equal to 0. Insets indicate pH levels (pH range: 6.79, 7.02, 7.8). (E) Dopamine concentration predictions from the EN-based procedure gives accurate predictions of dopamine concentration (blue squares). Horizontal axis: concentration of prepared dopamine; vertical axis: predicted dopamine concentration. Plotted are mean predicted values for five measurements at each concentration ± SEM (note: SEM bars are plotted but are consumed by the marker).
Fig. S1.
Fig. S1.
Principal components analysis of in vitro training data. (A) Background-subtracted voltammograms for six measurements of dopamine (Left) and six changes in pH (Right) are entered into a principal components analysis. (B) Resulting 11 principal components. Red traces (principal components 1 through 7) are retained for further analysis by the criteria set forth in refs. and . (C) Representation of the training data in the reduced principal component space.
Fig. S2.
Fig. S2.
Cook’s distance analysis of training dataset. (A) Loadings of the 12 training data background-subtracted voltammograms on to the seven principal components are used to fit a linear regression by ordinary least squares. (B) Cook’s distances are calculated for each training data measurement to test for outliers in the training dataset.
Fig. S3.
Fig. S3.
Performance of PC regression-based approach on out-of-sample test cases. (AC) Changes in dopamine concentration under stable pH (pH 7.4). (DF) Changes in pH under stable dopamine concentration (dopamine concentration for DF is 0). (A) Prepared dopamine concentration (light blue: 200, 400, 800, and 1,600 nM) compared with the PC regression-based predictions for dopamine concentration (red and green). Green points: accepted by Q-value analysis; red points: rejected by Q-value analysis. The inset scale bar indicates measurement period of 50 s. (B) Prediction error of PC regression-based predictions of dopamine concentration over the range of dopamine concentrations shown in A. (C) Q-value analysis determined a Q-value threshold of Qα = 209.6 (dotted line) for significant variance explained by the retained principal components for the test dataset. (D) Predictions of dopamine concentration when pH is changed, but dopamine concentration is held constant (0). Dotted light blue line indicates actual concentration of dopamine is equal to 0. Insets indicate pH levels (pH range: 7.19, 7.4, 7.6). (E) Prediction error of PC regression-based predictions of dopamine concentration over the range of pH fluctuations shown in D. (F) Q-value analysis determined a threshold of Qα = 209.6 (dotted line) for significant variance explained by the retained principal components for the test dataset.
Fig. S4.
Fig. S4.
Performance of EN-based approach on out-of-sample test cases. (A and B) Changes in dopamine concentration under stable pH (pH 7.4). (C and D) Changes in pH under stable dopamine concentration (dopamine concentration for C and D is 0). (A) Prepared dopamine concentration (light blue: 200, 400, 800, and 1,600 nM) compared with the EN-based predictions for dopamine concentration (dark blue). The inset scale bar indicates measurement period of 50 s. (B) Prediction error of EN-based predictions of dopamine concentration over the range of dopamine concentrations shown in A. (C) Predictions of dopamine concentration when pH is changed but dopamine concentration is held constant (0). Dotted light blue line indicates actual concentration of dopamine is equal to 0. Insets indicate pH levels (pH range: 6.79, 7.02, 7.8). (D) Prediction error of EN-based predictions of dopamine concentration over the range of pH fluctuations shown in C.
Fig. S5.
Fig. S5.
SNR of EN-based dopamine estimation as a function of dopamine concentration. Horizontal axis: concentration of prepared dopamine; vertical axis: SNR. Colored points indicate the value of the characteristic parameter (mean concentration of the training data) for each model generated (see inset legend for values).
Fig. 3.
Fig. 3.
Dopamine fails to simply track RPEs in the investment game. (A) Histogram showing the distribution of events for RPEs (n = 17 participants; n = 2,013 outcome revelations). (B) Mean normalized dopamine responses (±SEM) to positive (green; n = 1,022) and negative (red; n = 991) RPEs. Two-way ANOVA (RPE-sign and time: 700 ms following and including outcome reveal) reveals no significant difference comparing dopamine responses for positive and negative RPEs [FRPE-sign(1,7) = 1.67, P = 0.1965]. Note, this null result holds even at lower sample sizes (n 200 per category, randomly sampled) comparable to those in Fig. 4. Horizontal axis: time (ms) from outcome reveal (blue arrow head); vertical axis: mean change in the dopamine response. Before averaging, dopamine traces are normalized to the SD (σ) of the fluctuations measured within patient. Error bars: SEM. Inset shows dopamine response to a subset of positive (green) and negative (red) RPE events (i.e., when the participants’ bet all in).
Fig. 4.
Fig. 4.
RPE encoding by dopamine transients invert as a function of bet size. Dopamine responses to equal absolute magnitude positive and negative RPEs (−0.75 > RPE > +0.75) when bets are high (higher bets, 100–90%) (Left), medium (medium bets, 80–60%) (Center), or low (lower bets, 50–10%) (Right). For all three plots, mean normalized dopamine responses (±SEM) to positive RPEs (green traces) and negative RPEs (red traces). Inset legends show sample sizes for event types. Two-way ANOVA (RPE-sign and time: 700 ms following and including outcome reveal) reveals a significant difference comparing dopamine responses for positive and negative RPEs following higher bets [FRPE-sign(1,7) = 21.17, P = 0.00] and lower bets [FRPE-sign(1,7) = 32.64, P = 0.00] but not medium bet sizes [FRPE-sign(1,7) = 0.15, P = 0.6957]. Asterisks indicate significant difference between red and green traces: P < 0.05, post hoc, two-sample t test following ANOVA with time and RPE-sign as the two main factors. Asterisks with parentheses indicate Bonferroni correction for multiple comparisons. For low bets (i.e., large CPEs), only those events where the market price change and the RPE-sign are the same are considered. Horizontal axis: time (ms) from outcome reveal (blue arrowhead); vertical axis: mean change in normalized dopamine response.
Fig. S8.
Fig. S8.
FSCV protocols. (A) Triangular voltammetry protocol used for conditioning the carbon-fiber microsensor. (B) Triangular voltammetry protocol used for FSCV measurements of dopamine in vitro and in vivo. (C) In vitro-collected voltammogram for dopamine at increasing concentrations: triangular voltage waveform applied during FSCV measurements (Top), non–background-subtracted (Middle) and background-subtracted (Bottom) FSCV data collected in vitro for increasing concentrations of dopamine. Horizontal axis: time (ms). Vertical axis: current (nA). Orange and green shading indicates expected range of dopamine oxidation and dopamine-o-quinone reduction peaks, respectively.
Fig. S7.
Fig. S7.
Diagram of extended carbon-fiber microsensor. From top to bottom, drawings of component parts and assembly steps for constructing the extended carbon-fiber microsensor. (A) 7-μm-diameter carbon fiber is threaded through a 1-cm-long (20-μm ID, 90-μm OD) fused-silica capillary with biocompatible polyimide coating and then held in place and sealed on one end with two-part epoxy. (B) Platinum-iridium wire (0.003 in diameter) is threaded through a 28-cm-long (100-μm ID, 238-μm OD) fused-silica capillary with biocompatible polyimide coating. (C) The recoding tip assembled in A is inserted 5 mm into the larger fused-silica capillary assembled in B. An electrical contact is made between the carbon fiber and the platinum-iridium wire using silver paint. A gold-plated connecting pin is soldered to the other end of the platinum-iridium wire. (D, Upper) The assembly in C is threaded into a guide tube purchased from FHC, which contains the reference electrode and connecting pin. (D, Lower) Colored drawing showing guide tube in gray and carbon-fiber biocompatible capillary assembly in orange. (E) The extended carbon-fiber microsensor is retracted (Lower) when not in use and during implantation, but when extended (Upper), the carbon-fiber working end extends 1 cm beyond the reference electrode tip contained on the end of the FHC guide tube. Two-part epoxy is used as a “stopper” to ensure that the probe extends the desired depth when deployed.
Fig. S9.
Fig. S9.
Examples of non–background-subtracted cyclic voltammograms from each participant and overlay of EN-determined linear regression weights used for prediction. (AQ) FSCV sweep from each patient showing EN-determined linear regression coefficients overlaid in red and blue. As in Figs. S8 and S10, orange shading and arrowhead show expected range and peak of dopamine oxidation potential; green shading and arrowhead show expected range and peak of dopamine-o-quinone reduction potential. Horizontal axis: time (ms); vertical axis: current (nA).
Fig. S10.
Fig. S10.
Examples showing derivative of cyclic voltammograms from each participant and overlay of EN determined linear regression weights used for prediction. (AQ) Derivative of FSCV sweep from each patient showing EN-determined linear regression coefficients overlaid in red and blue. As in Figs. S8 and S9, orange shading and arrowhead show expected range and peak of dopamine oxidation potential; green shading and arrowhead show expected range and peak of dopamine-o-quinone reduction potential. Horizontal axis: time (ms); vertical axis: current (nA).
Fig. S6.
Fig. S6.
Distribution of decision-making variables in the investment game. (AE) Histograms showing the distribution of events for each variable: market returns (rt=Δptpt) (A), bet size (bt) (B), participant outcomes (gains and losses, btrt) (C), RPEs ({btrtE(btrt)}/σbtrt) (D), and CPEs (rtbtrt) (E).

Comment in

  • Dopamine: Context and counterfactuals.
    Platt ML, Pearson JM. Platt ML, et al. Proc Natl Acad Sci U S A. 2016 Jan 5;113(1):22-3. doi: 10.1073/pnas.1522315113. Epub 2015 Dec 23. Proc Natl Acad Sci U S A. 2016. PMID: 26699497 Free PMC article. No abstract available.

References

    1. Montague PR, Hyman SE, Cohen JD. Computational roles for dopamine in behavioural control. Nature. 2004;431(7010):760–767. - PubMed
    1. Wise RA. Dopamine, learning and motivation. Nat Rev Neurosci. 2004;5(6):483–494. - PubMed
    1. Lotharius J, Brundin P. Pathogenesis of Parkinson’s disease: Dopamine, vesicles and α-synuclein. Nat Rev Neurosci. 2002;3(12):932–942. - PubMed
    1. Moore DJ, West AB, Dawson VL, Dawson TM. Molecular pathophysiology of Parkinson’s disease. Annu Rev Neurosci. 2005;28:57–87. - PubMed
    1. Cohen JD, Servan-Schreiber D. Context, cortex, and dopamine: A connectionist approach to behavior and biology in schizophrenia. Psychol Rev. 1992;99(1):45–77. - PubMed

Publication types