. 2015 Nov 23;11(11):e1004626.
doi: 10.1371/journal.pcbi.1004626. eCollection 2015 Nov.

Computational Modelling of Metastasis Development in Renal Cell Carcinoma

Affiliations

Computational Modelling of Metastasis Development in Renal Cell Carcinoma

Etienne Baratchart et al. PLoS Comput Biol. .

Abstract

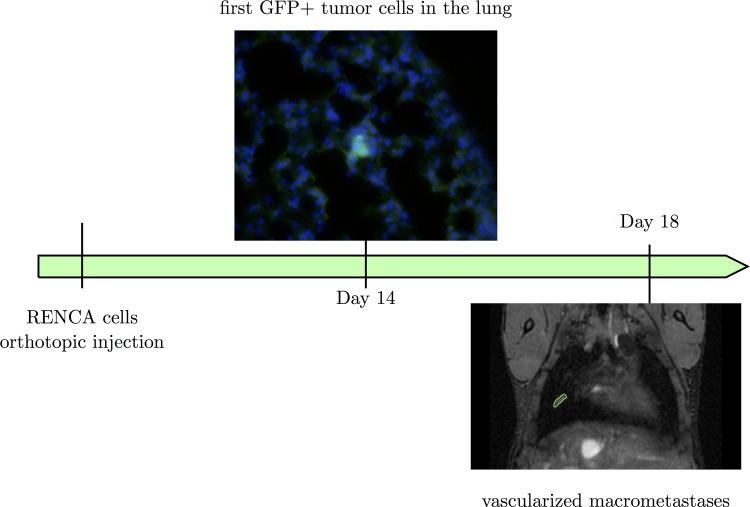
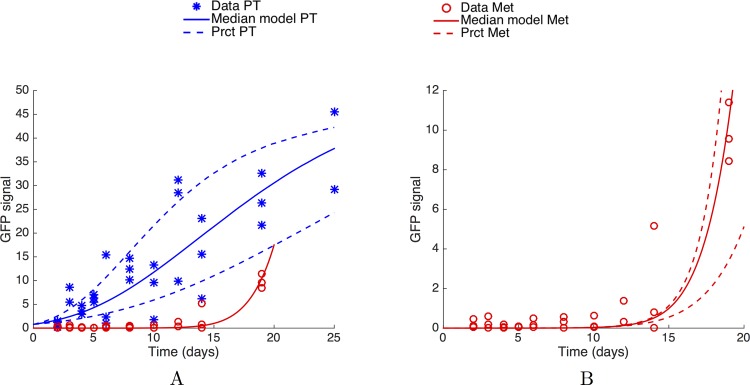
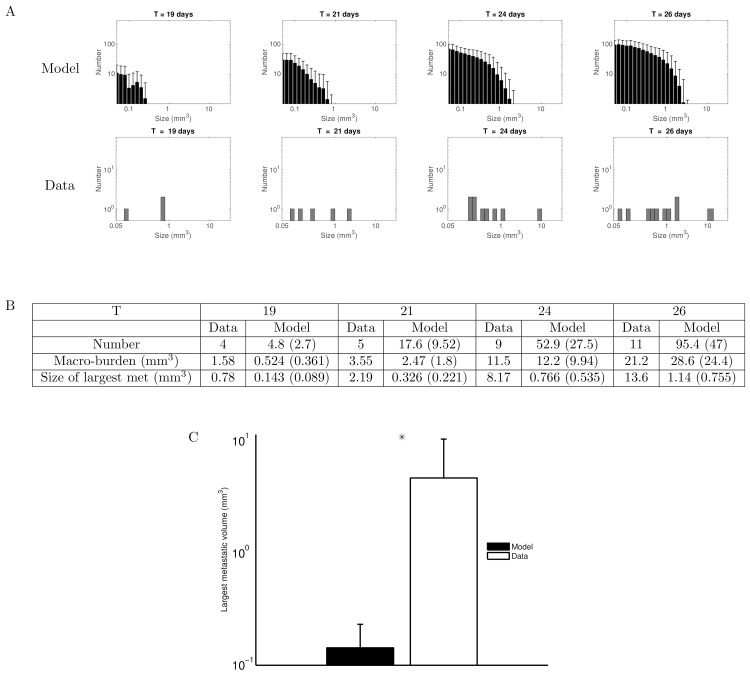
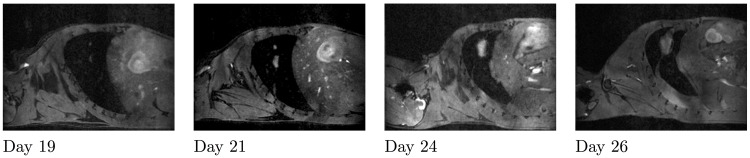
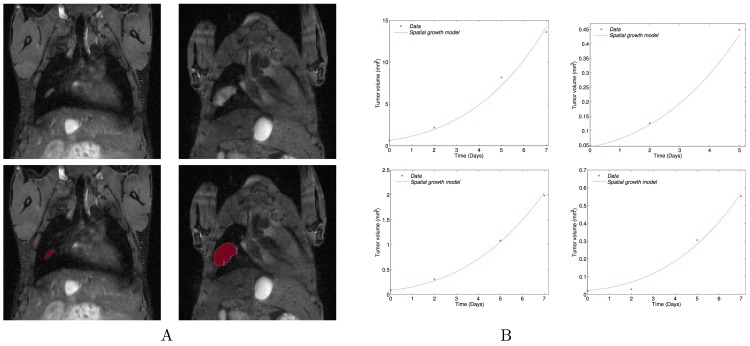
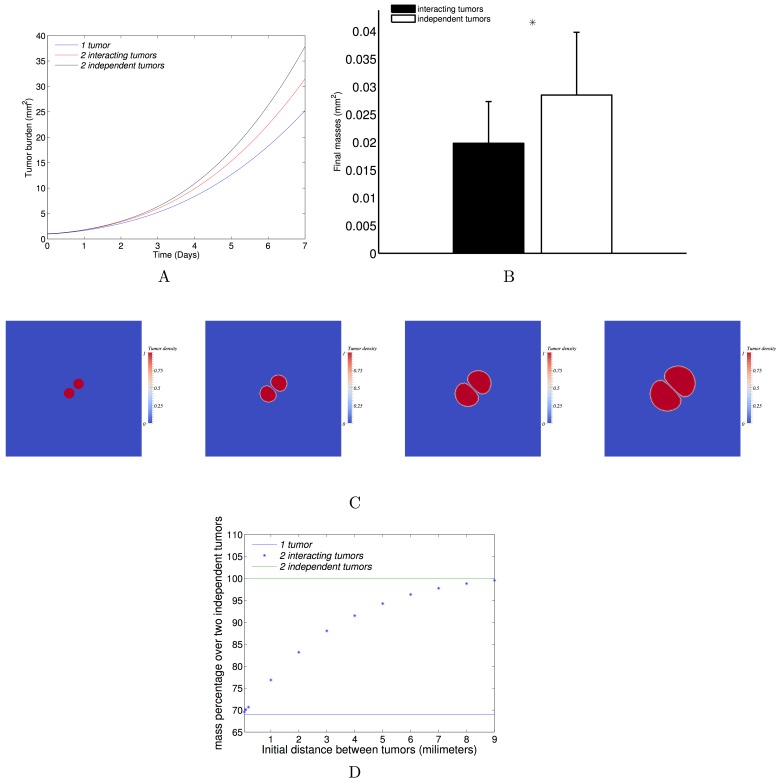
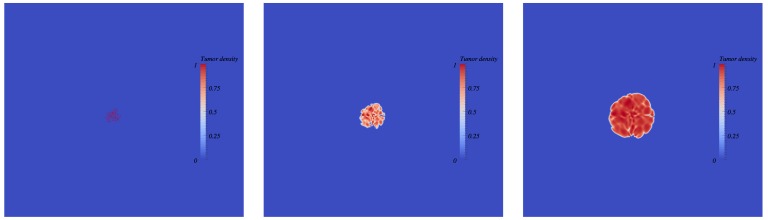
The biology of the metastatic colonization process remains a poorly understood phenomenon. To improve our knowledge of its dynamics, we conducted a modelling study based on multi-modal data from an orthotopic murine experimental system of metastatic renal cell carcinoma. The standard theory of metastatic colonization usually assumes that secondary tumours, once established at a distant site, grow independently from each other and from the primary tumour. Using a mathematical model that translates this assumption into equations, we challenged this theory against our data that included: 1) dynamics of primary tumour cells in the kidney and metastatic cells in the lungs, retrieved by green fluorescent protein tracking, and 2) magnetic resonance images (MRI) informing on the number and size of macroscopic lesions. Critically, when calibrated on the growth of the primary tumour and total metastatic burden, the predicted theoretical size distributions were not in agreement with the MRI observations. Moreover, tumour expansion only based on proliferation was not able to explain the volume increase of the metastatic lesions. These findings strongly suggested rejection of the standard theory, demonstrating that the time development of the size distribution of metastases could not be explained by independent growth of metastatic foci. This led us to investigate the effect of spatial interactions between merging metastatic tumours on the dynamics of the global metastatic burden. We derived a mathematical model of spatial tumour growth, confronted it with experimental data of single metastatic tumour growth, and used it to provide insights on the dynamics of multiple tumours growing in close vicinity. Together, our results have implications for theories of the metastatic process and suggest that global dynamics of metastasis development is dependent on spatial interactions between metastatic lesions.


Conflict of interest statement

The authors have declared that no competing interests exist.

Figures

Fig 1
Fig 1. The animal model.
At day 14 after GFP+ RENCA cells injection, the first tumour cells were observed in the lungs (in green). At days 18–19, the first macro-metastases were observed by MRI.
Fig 2
Fig 2. The standard theory: Primary tumour and metastatic burden dynamics fitting.
(A) Fits of the primary tumour and metastatic burden dynamics, under a mathematical model assuming independent growth of each secondary tumour and using mixed-effects modelling for statistical representation of the population distribution of the parameters and measurement error. (B) Fit on the metastatic burden. In panels (A) and (B), each data point corresponds to one distinct mouse (n = 31 animals in total). Simulations were obtained using Eq 1 for the primary tumour growth and Eq 3 for the metastatic burden, endowed with a lognormal distribution of the parameters with the following values (median ± standard deviation): λ = 0.679 α = 0.417 ± 0.171 day-1, β = 0.106 ± 0.0478 day-1 and μ = 9.72 × 10⁻⁶ ± 0.428 × 10⁻⁶ cell∙day-1. PT = Primary Tumour. Met = Metastatic burden. Prct = 10% and 90% percentiles
Fig 3
Fig 3. Time course of the macro-metastases size distribution: standard model versus observations.
(A) Top row: Simulation of the mathematical formalism of the standard theory (i.e. dissemination and independent growth of the resulting tumour foci), using the parameter values inferred from the data of the total metastatic burden (total GFP signal in the lungs). Only tumours larger than the visible threshold at MRI (0.05 mm3) are plotted. Simulations were obtained using Eqs 1 and 2 for the time evolution of the density of secondary tumours, endowed with a lognormal distribution of the parameters for inter-animal variability, with the following values (retrieved from the population mixed-effects fit, median ± standard deviation): λ = 0.679 α = 0.417 ± 0.171 day-1, β = 0.106 ± 0.0478 day-1 and μ = 9.72 × 10⁻⁶ ± 0.428 × 10⁻⁶ cell∙day-1. Shown are the results of 1000 simulations, mean + standard deviation. Bottom row: Observations of macro-metastases numbers and sizes in one mouse on MRI data. (B) Comparison of several metrics derived from the metastatic size distributions. For the model, numbers are represented as mean value and standard deviation in parenthesis. The data corresponds to the mouse presented in the upper histogram. (C) Comparison of the largest metastatic size at day 19 between model (n = 1000 simulated animals) and observations (n = 6 animals), log scale. The observed largest metastases are significantly larger than simulated ones (p < 10-5 by the z-test).
Fig 4
Fig 4. Metastases merging.
From left to right: Sagittal slices of the lungs from day 19 until day 26 for the same mouse. Two tumours are growing close to each other and merge between days 21 and 24.
Fig 5
Fig 5. Spatial model fitting.
(A) Top: Coronal MRI data of the lungs at days 19 and 26. Bottom: the simulated growth by the model using the fitted parameters and starting from the real shape of the observed metastasis at day 19 on the coronal MRI slice. Simulations were obtained using Eqs 4–7 with the following parameter values: γ 0 = 0.78 day-1; Π 0 = 0.0026 Pa; Time of simulation: T = 7 days (B) Volumes compared to simulations by the fitted model for the growth of four individual metastasis. The fits were performed on the volume only, considering the metastases as spherical.
Fig 6
Fig 6. Tumour-tumour spatial interactions.
(A) Three different configurations with a same initial burden: only one tumour, two close tumours, two far tumours. The dynamics in the three configurations are compared with the parameter set inferred from the fit on one metastatic growth (0.78, 0.0026) day-1×Pa. (B) The final burdens are compared in two configurations: two close tumours and two independent tumours. The mean burdens over a set of 64 parameters (resulting from an 8 × 8 uniform discretization of the relevant parameter space given by the individual tumour fits, (0.67,1.01) × (5.2 ∙ 10−4,2.6 ∙ 10−3)) are plotted with the standard deviations (difference of 31% ± 1.5% between the two distributions). (C) From left to right: time course of two interacting tumours growing and pushing each other. The parameters were fixed from one of the fitted MRI metastases: γ 0 = 0.78 day-1; Π 0 = 0.0026 Pa; simulation time: T = 7 days; initial distance between the two metastases: D = 0.2mm; initial surface for each metastasis: S = 0.46 mm2. (D) The curve represents the evolution of the final burden with respect to the initial distance between the two interacting tumours. The initial total burden and the parameters were taken to be the same as one of the four fitted metastases (same as C).
Fig 7
Fig 7. Simulation of multiple metastatic foci merging (with spatial interactions).
From left to right: time course of merging metastatic germs. Each germ starts from one cell. The germs are randomly located at a distance of 0.03 mm from each other. Simulations were obtained using Eqs 4–7 and the following parameter values: γ 0 = 0.78 day-1; Π 0 = 0.0026 Pa; time of simulation: T = 7 days; number of germs = 200 in 2D. The corresponding number of cells in 3D is computed under a spherical symmetry assumption and is 2127. Movie of the simulation is available as S3 File.

References

    1. Chaffer CL, Weinberg RA. A perspective on cancer cell metastasis. Science. 2011;331: 1559–1564. 10.1126/science.1203543 - DOI - PubMed
    1. Gupta GP, Massagué J. Cancer metastasis: Building a framework. Cell. 2006;127: 679–695. - PubMed
    1. Talmadge JE, Fidler IJ. AACR centennial series: the biology of cancer metastasis: historical perspective. Cancer Res. 2010;70: 5649–5669. 10.1158/0008-5472.CAN-10-1040 - DOI - PMC - PubMed
    1. Hanahan D, Weinberg RA. Hallmarks of cancer: the next generation. Cell. 2011;144: 646–674. 10.1016/j.cell.2011.02.013 - DOI - PubMed
    1. O’Reilly MS, Holmgren L, Shing Y, Chen C, Rosenthal RA, Moses M, et al. Angiostatin: a novel angiogenesis inhibitor that mediates the suppression of metastases by a Lewis lung carcinoma. Cell. 1994;79: 315–328. - PubMed

Publication types