. 2015 Nov 24;10(11):e0143205.
doi: 10.1371/journal.pone.0143205. eCollection 2015.

A Risk Assessment of the Jaffe vs Enzymatic Method for Creatinine Measurement in an Outpatient Population

Affiliations

A Risk Assessment of the Jaffe vs Enzymatic Method for Creatinine Measurement in an Outpatient Population

Robert L Schmidt et al. PLoS One. .

Abstract

Background: The Jaffe and enzymatic methods are the two most common methods for measuring serum creatinine. The Jaffe method is less expensive than the enzymatic method but is also more susceptible to interferences. Interferences can lead to misdiagnosis but interferences may vary by patient population. The overall risk associated with the Jaffe method depends on the probability of misclassification and the consequences of misclassification. This study assessed the risk associated with the Jaffe method in an outpatient population. We analyzed the discordance rate in the estimated glomerular filtration rate based on serum creatinine measurements obtained by the Jaffe and enzymatic method.

Methods: Method comparison and risk analysis. Five hundred twenty-nine eGFRs obtained by the Jaffe and enzymatic method were compared at four clinical decision limits. We determined the probability of discordance and the consequence of misclassification at each decision limit to evaluate the overall risk.

Results: We obtained 529 paired observations. Of these, 29 (5.5%) were discordant with respect to one of the decision limits (i.e. 15, 30, 45 or 60 ml/min/1.73m2). The magnitude of the differences (Jaffe result minus enzymatic result) were significant relative to analytical variation in 21 of the 29 (72%) of the discordant results. The magnitude of the differences were not significant relative to biological variation. The risk associated with misclassification was greatest at the 60 ml/min/1.73m2 decision limit because the probability of misclassification and the potential for adverse outcomes were greatest at that decision limit.

Conclusion: The Jaffe method is subject to bias due to interfering substances (loss of analytical specificity). The risk of misclassification is greatest at the 60 ml/min/1.73m2 decision limit; however, the risk of misclassification due to bias is much less than the risk of misclassification due to biological variation. The Jaffe method may pose low risk in selected populations if eGFR results near the 60 ml/min/1.73m2 decision limit are interpreted with caution.


Conflict of interest statement

Competing Interests: The authors have declared that no competing interests exist.

Figures

Fig 1
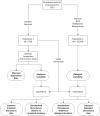
Fig 1. Overview of experimental design.
We randomly selected 529 patient samples from outpatient samples that were submitted to the laboratory for SCr measurements (Population 1). This group of samples was used for the method comparison study and to evaluate the analytical precision of the Jaffe and enzymatic methods. We estimated biological variability in the outpatient population by identifying all outpatients who had at least two SCr measurements in 2013 (Population 2). This group contained 13,243 patients with a total of 42,195 SCr measurements. We evaluated the magnitude of discordances (standardized discordances) and the frequency of discordances (expected discordance vs observed discordance).
Fig 2
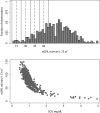
Fig 2. Upper: Distribution of eGFR.
The solid lines indicate zones centered at 15, 30, 45, and 60 ml/min/1.73 m2. Lower: Relationship between serum creatinine and eGFR. eGFR was estimated using the Chronic Kidney Disease Epidemiology (CKD-EPI) equation.
Fig 3
Fig 3. Precision Profile for eGFR Measurements.
These Figs show the standard deviation of the eGFR as a function of eGFR for the CKD-EPI method for the enzymatic (left panel) and Jaffe method (right panel). All data (age, sex, and race) are combined.
Fig 4
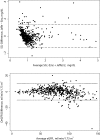
Fig 4. Bland-Altman plots for creatinine and eGFR.
Upper panel: Creatinine. Lower panel: eGFR.
Fig 5
Fig 5. Biological Variability of eGFR.
Each point represents the difference between consecutive eGFR measurements in one patient. The dashed line represents the estimated limit of biological deviation (95% confidence limits).
Fig 6
Fig 6. Comparison of analytical variation, biological variation and unconditional discordance.
The inner lines (maroon) are the limits of analytical variation and the outer (black) lines are the limits of biological variation. Forty-two percent of the discordances exceed the limits of analytical variation. None of the discordances exceed the limits of biological variation.
Fig 7
Fig 7. Comparison of observed discordances to analytical variation.
Each line represents the difference between the Jaffe result and enzymatic result. The vertical lines indicate the decision limit and two standard deviations of the difference (Jaffe-enzymatic) due to measurement imprecision at the decision limit. The arrows are directed from the enzymatic result toward the Jaffe result (the Jaffe result is greater than enzymatic when arrows point from left to right). Heavy lines indicate statistically significant discordances (i.e., greater than two standard deviations of the analytical variation) and light lines indicate nonsignificant discordances.

References

    1. Myers GL. Standardization of serum creatinine measurement: Theory and practice. Scandinavian Journal of Clinical and Laboratory Investigation. 2008;68(SUPPL. 241):57–63. 10.1080/00365510802149887 - DOI - PubMed
    1. Peake M, Whiting M. Measurement of serum creatinine—current status and future goals. The Clinical biochemist Reviews / Australian Association of Clinical Biochemists. 2006;27(4):173–84. Epub 2007/06/22. ; PubMed Central PMCID: PMCPmc1784008. - PMC - PubMed
    1. Myers GL, Miller WG, Coresh J, Fleming J, Greenberg N, Greene T, et al. Recommendations for improving serum creatinine measurement: a report from the Laboratory Working Group of the National Kidney Disease Education Program. Clin Chem. 2006;52(1):5–18. Epub 2005/12/08. 10.1373/clinchem.2005.0525144 . - DOI - PubMed
    1. Killeen AA, Ashwood ER, Ventura CB, Styer P. Recent trends in performance and current state of creatinine assays. Archives of Pathology and Laboratory Medicine. 2013;137(4):496–502. 10.5858/arpa.2012-0134-CP - DOI - PubMed
    1. Greenberg N, Roberts WL, Bachmann LM, Wright EC, Dalton RN, Zakowski JJ, et al. Specificity characteristics of 7 commercial creatinine measurement procedures by enzymatic and jaffe method principles. Clinical Chemistry. 2012;58(2):391–401. 10.1373/clinchem.2011.172288 - DOI - PubMed