. 2015 Nov 23;10(11):e0143129.
doi: 10.1371/journal.pone.0143129. eCollection 2015.

Rhinovirus Load Is High despite Preserved Interferon-β Response in Cystic Fibrosis Bronchial Epithelial Cells

Affiliations

Rhinovirus Load Is High despite Preserved Interferon-β Response in Cystic Fibrosis Bronchial Epithelial Cells

Nurlan Dauletbaev et al. PLoS One. .

Abstract

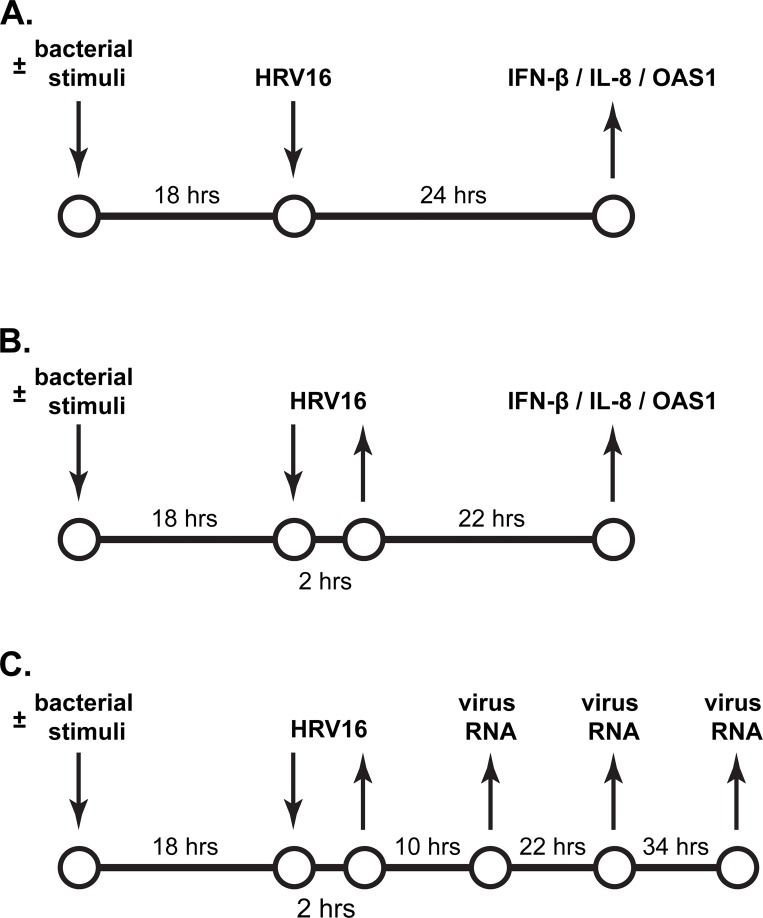
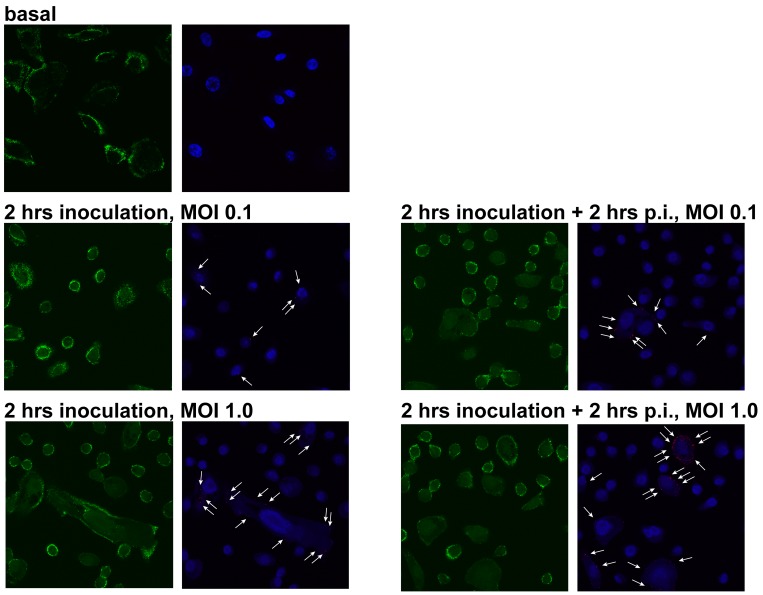
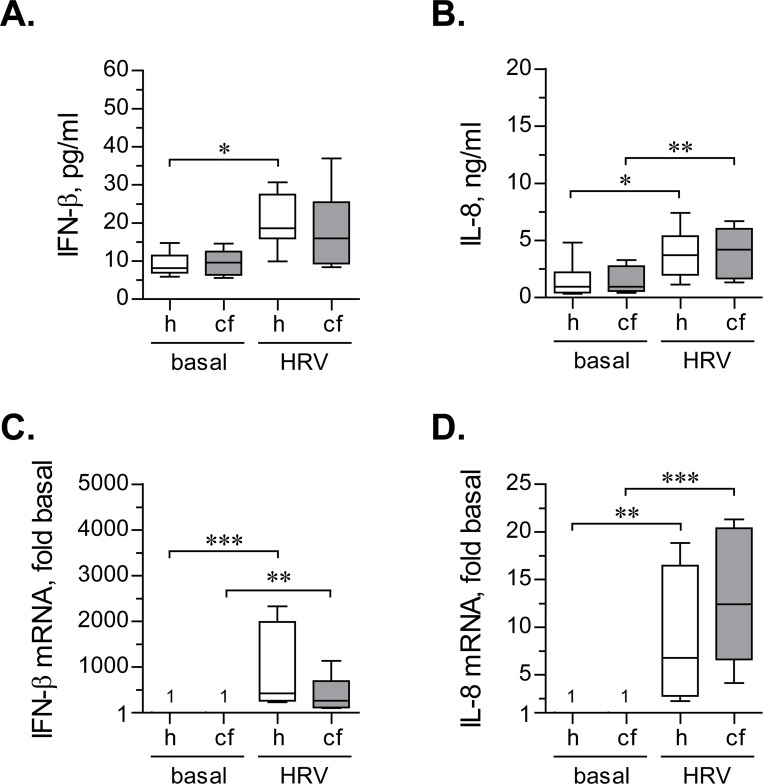
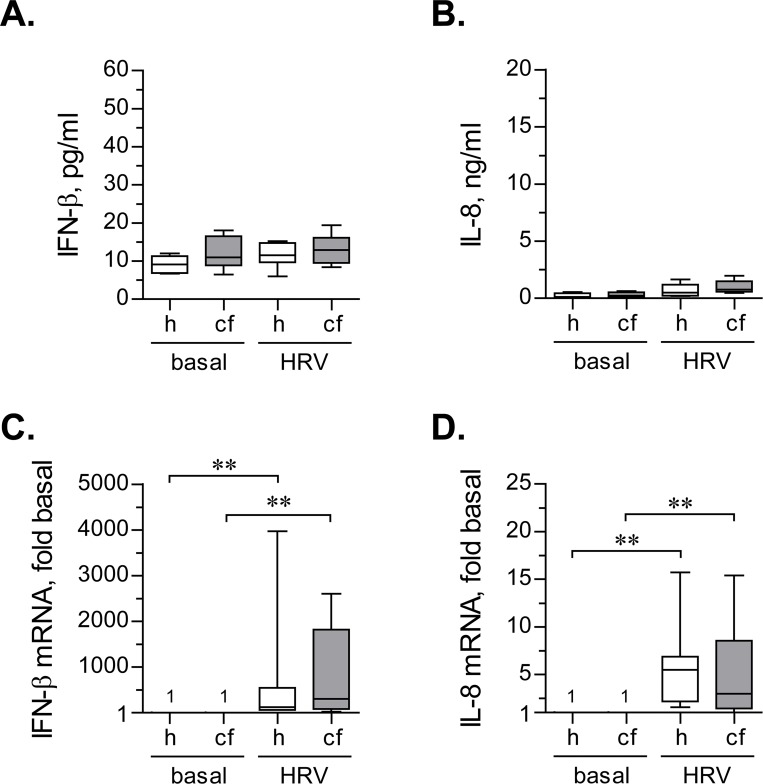
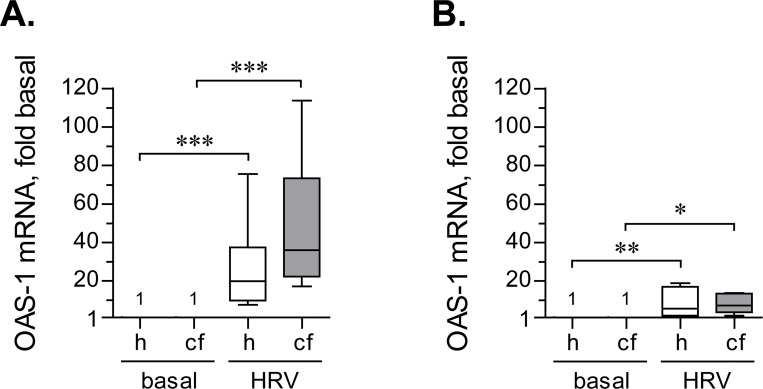
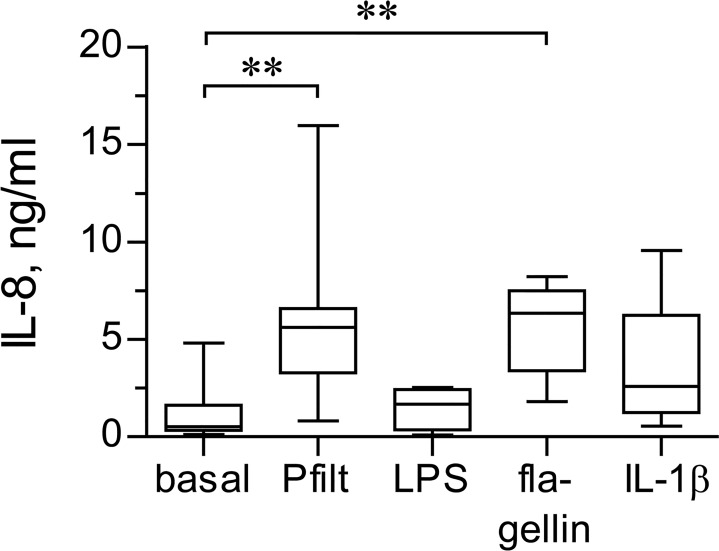
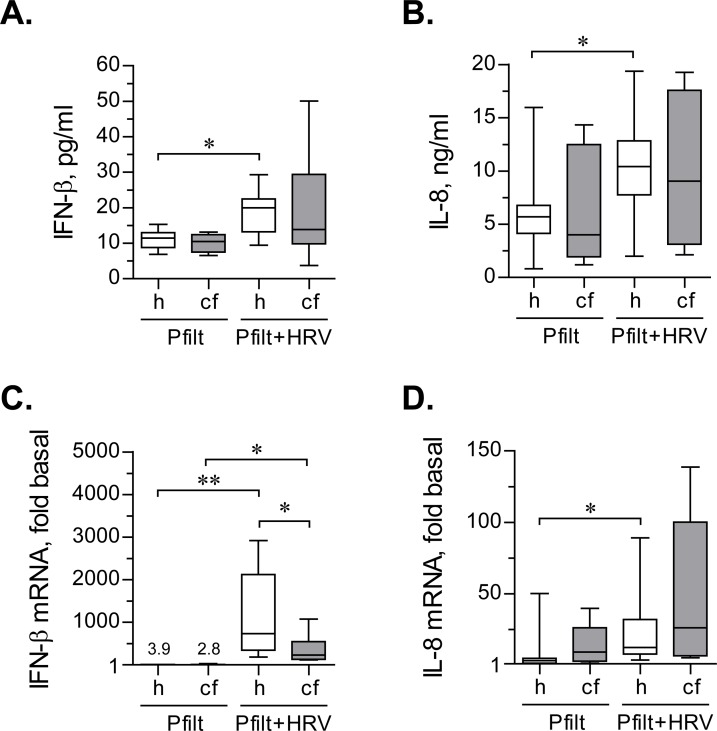
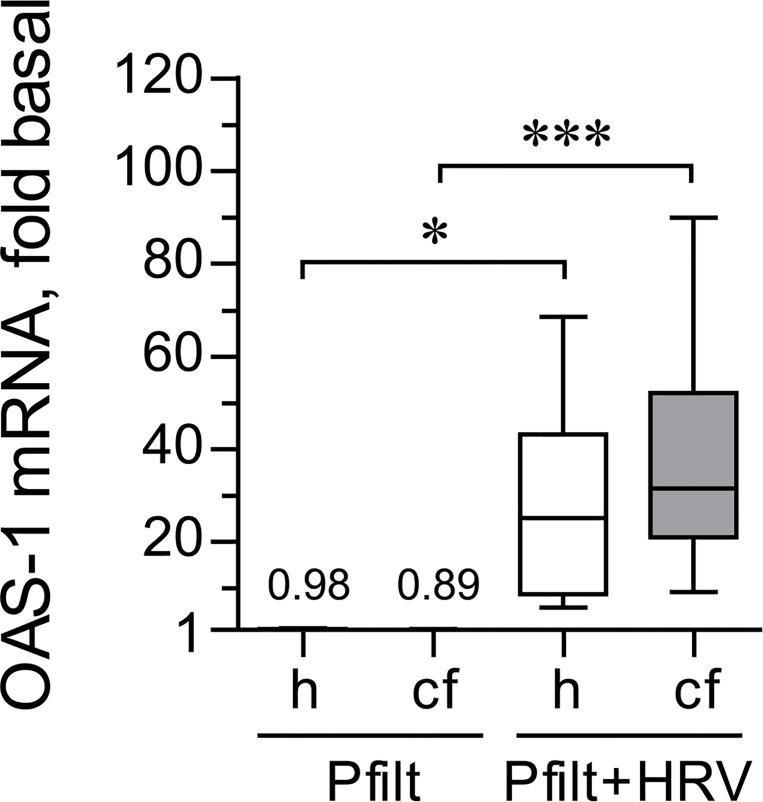
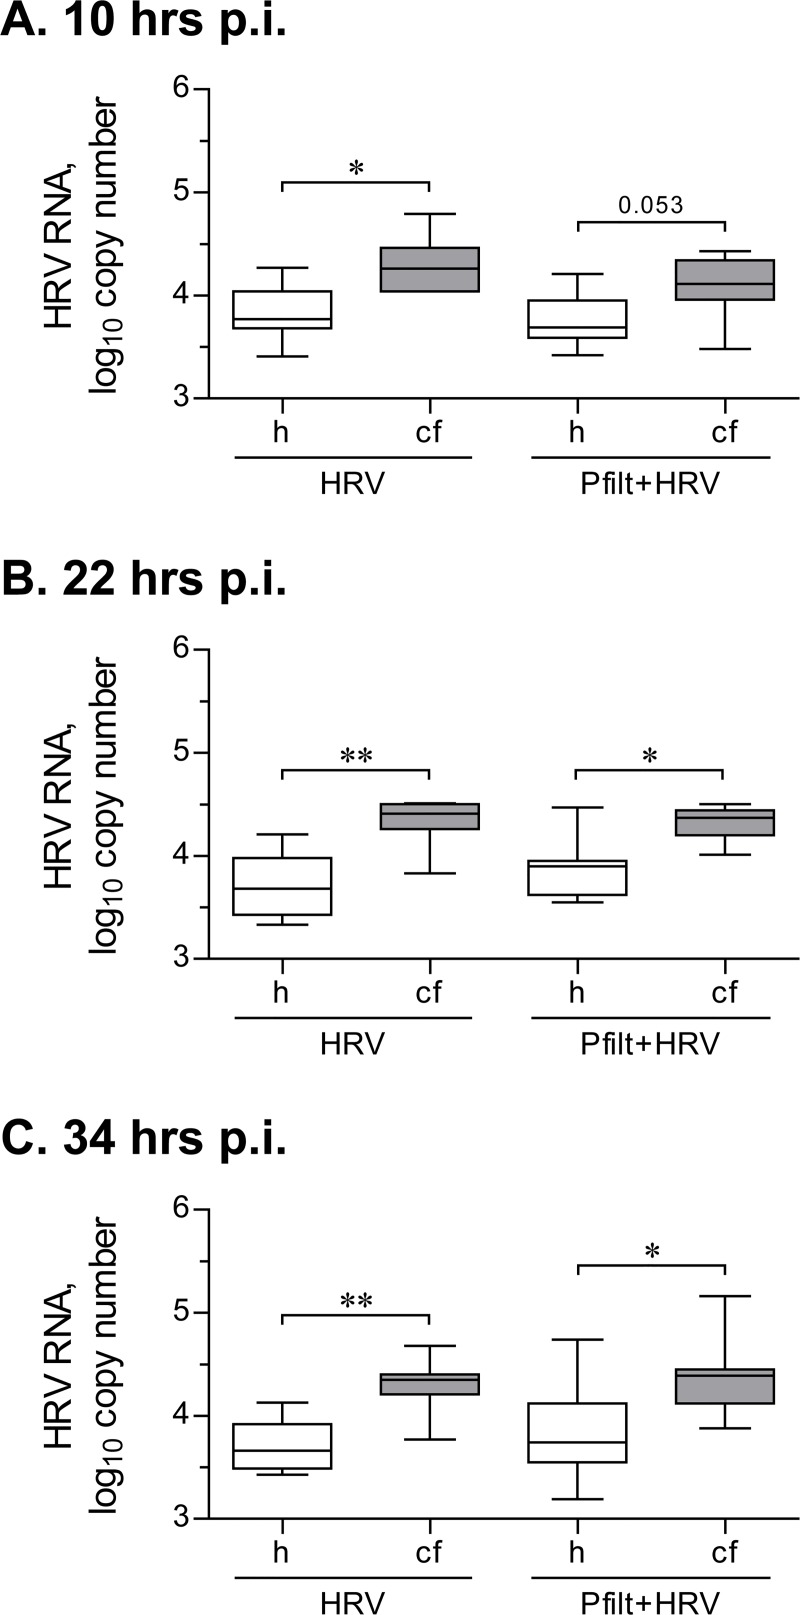
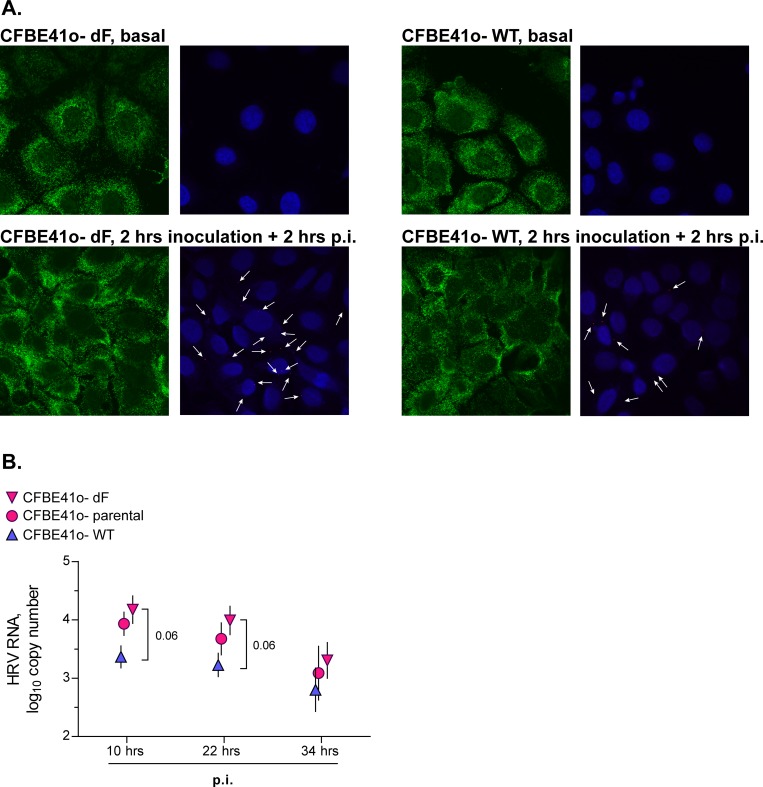
Lung disease in cystic fibrosis (CF) is often exacerbated following acute upper respiratory tract infections caused by the human rhinovirus (HRV). Pathophysiology of these exacerbations is presently unclear and may involve deficient innate antiviral or exaggerated inflammatory responses in CF airway epithelial cells. Furthermore, responses of CF cells to HRV may be adversely affected by pre-exposure to virulence factors of Pseudomonas (P.) aeruginosa, the microorganism that frequently colonizes CF airways. Here we examined production of antiviral cytokine interferon-β and inflammatory chemokine interleukin-8, expression of the interferon-responsive antiviral gene 2'-5'-oligoadenylate synthetase 1 (OAS1), and intracellular virus RNA load in primary CF (delF508 CFTR) and healthy airway epithelial cells following inoculation with HRV16. Parallel cells were exposed to virulence factors of P. aeruginosa prior to and during HRV16 inoculation. CF cells exhibited production of interferon-β and interleukin-8, and expression of OAS1 at levels comparable to those in healthy cells, yet significantly higher HRV16 RNA load during early hours post-inoculation with HRV16. In line with this, HRV16 RNA load was higher in the CFBE41o- dF cell line overexpessing delF508 CFTR, compared with the isogenic control CFBE41o- WT (wild-type CFTR). Pre-exposure to virulence factors of P. aeruginosa did not affect OAS1 expression or HRV16 RNA load, but potentiated interleukin-8 production. In conclusion, CF cells demonstrate elevated HRV RNA load despite preserved interferon-β and OAS1 responses. High HRV load in CF airway epithelial cells appears to be due to deficiencies manifesting early during HRV infection, and may not be related to interferon-β.


Conflict of interest statement

Competing Interests: One of the co-authors of the authors' manuscript (Richard Leigh) has received funding from AstraZeneca Canada and fees from Almirall Canada, AstraZeneca Canada, GlaxoSmithKline Canada, Johnston & Johnston, Novartis Pharmaceuticals, Forest Labs Canada, and conference travel sponsorships from Novartis Pharmaceuticals Canada and Forest Labs Canada during the conduct of this study. The authors hereby declare that none of this support from commercial organizations has been used to fund their study. The authors further declare that the funding from commercial sources does not alter their adherence to PLOS ONE policies on sharing data and materials.

Figures

Fig 1
Fig 1. Schematic representation of continuous and short-term inoculation with HRV, and the tested outcomes.
(A) Continuous inoculation with HRV16. Cells were incubated with culture medium for 18 hours and subsequently inoculated for 24 hours with the human rhinovirus (HRV) 16 at a Multiplicity Of Infection (MOI) of 0.1. Afterwards, IFN-β and IL-8 production was quantified in cell supernatants by ELISA, whereas expression of IFN-β and IL-8 mRNAs, and the interferon-responsive antiviral gene OAS1 was assessed in cell lysates by qPCR. Parallel cells were incubated with diffusible virulence factors of P. aeruginosa (“bacterial stimuli”) prior to and during inoculation with HRV16. (B) Short-term inoculation with HRV16. Cells were treated as in (A) prior to inoculation for 2 hours with HRV16 at an MOI of 0.1. Then, cell supernatants were removed, and cells were rinsed twice with culture medium to deplete extracellular virus. Subsequently, the cells were incubated for 22 hours without HRV16, and with or without virulence factors of P. aeruginosa. Afterwards, IFN-β and IL-8 (protein and mRNA) response, and expression of the interferon-responsive antiviral gene OAS1 were quantified as in (A). (C) Quantification of intracellular HRV RNA load after a short-term inoculation with HRV16. Primary healthy and CF HBE cells were treated and inoculated as in (B). Then, cells were incubated without HRV16, and with or without diffusible virulence factors of P. aeruginosa. Cell lysates were collected at 10, 22, and 34 hours post-inoculation with the virus. HRV16 RNA copy numbers were quantified by qPCR.
Fig 2
Fig 2. Intracellular HRV RNA load in CF HBE cells after a short-term inoculation with HRV16.
Primary CF HBE cells were pre-incubated for 18 hours with experimental culture medium (BEGM without hydrocorticortisone or antibiotics) and subsequently inoculated for 2 hours with HRV16 (HRV) at an MOI of 0.1 or 1.0. Then, virus-containing cell supernatants were removed and cells were rinsed five times with experimental culture medium to deplete extracellular virus. Subsequently, cells presented in left panels were fixed with paraformaldehyde and processed as described in the Materials and Methods to detect the HRV16 positive strand RNA by in situ hybridization. Parallel cells (right panels) were incubated for 2 hours post-inoculation (p.i.) and processed similarly to above cells. Green indicates expression of ACTB (β-actin gene; used to visualize cell cytoplasm), red dots and white arrows indicate the HRV16 positive strand RNA, and blue is DAPI (nuclear counterstain). The red and blue signals have been slightly overexposed to better visualize HRV16 RNA.
Fig 3
Fig 3. IFN-β and IL-8 response during continuous inoculation with HRV16.
(A) and (B) Primary healthy (h) and CF (cf) HBE cells were pre-incubated for 18 hours with experimental culture medium (BEGM without hydrocorticortisone or antibiotics) and subsequently inoculated for 24 hours with HRV16 (HRV) at an MOI of 0.1. Afterwards, production of IFN-β (A) and IL-8 (B) was quantified in cell supernatants by respective ELISAs. Data are presented as box-and-whisker plots (medians, interquartile ranges, and min-max values) of absolute values of IFN-β and IL-8 production. n = 8 cultures per group. * p < 0.05 and ** p < 0.01. (C) and (D) The above cells were lysed, and expressions of mRNA of IFN-β (C) and IL-8 (D) were quantified by qPCR. Numbers on the plot represent IFN-β mRNA expression in basal cells, assumed as 1. Other data are presented as box-and-whisker plots of fold up-regulation over basal. n = 8 cultures per group. ** p < 0.01 and *** p < 0.001.
Fig 4
Fig 4. IFN-β and IL-8 response after short-term inoculation with HRV16.
(A) and (B) Primary healthy (h) and CF (cf) HBE cells were pre-incubated for 18 hours with experimental culture medium (BEGM without hydrocorticortisone or antibiotics) and subsequently inoculated for 2 hours with HRV16 (HRV) at an MOI of 0.1. Then, virus-containing cell supernatants were removed, cells were rinsed twice with experimental culture medium to deplete extracellular virus, and incubated for 22 hours without HRV16. Afterwards, production of IFN-β (A) and IL-8 (B) was quantified in cell supernatants by respective ELISAs. Data are presented as box-and-whisker plots (medians, interquartile ranges, and min-max values) of absolute values of IFN-β and IL-8 production. n = 8 cultures per group. None of the tested differences reached statistical significance. (C) and (D) The above cells were lysed, and expressions of mRNA of IFN-β (C) and IL-8 (D) were quantified by qPCR. Numbers on the plot represent IFN-β mRNA expression in basal cells, assumed as 1. Other data are presented as box-and-whisker plots of fold up-regulation over basal. n = 6–7 cultures per group. ** p < 0.01.
Fig 5
Fig 5. Up-regulation of OAS1 expression by HRV16.
(A) Primary healthy (h) and CF (cf) HBE cells were pre-incubated for 18 hours with experimental culture medium (BEGM without hydrocorticortisone or antibiotics) and subsequently inoculated for 24 hours with HRV16 (HRV) at an MOI of 0.1. Afterwards, expression of OAS1 mRNA was quantified by qPCR. Numbers on the plot represent OAS1 expression in basal cells, assumed as 1. Other data are presented as box-and-whisker plots (medians, interquartile ranges, and min-max values) of fold up-regulation over basal. n = 8 cultures per group. ** p < 0.01 and *** p < 0.001. (B) Primary healthy (h) and CF (cf) HBE cells were pre-incubated as above and subsequently inoculated for 2 hours with HRV16 (HRV) at the MOI of 0.1. Then, virus-containing cell supernatants were removed, cells were rinsed twice with experimental culture medium to deplete extracellular virus, and incubated for 22 hours without HRV16. Afterwards, expression of OAS1 mRNA was quantified by qPCR. Numbers on the plot represent OAS1 expression in basal cells, assumed as 1. Other data are presented as box-and-whisker plots of fold up-regulation over basal. n = 6–7 cultures per group. * p < 0.05 and ** p < 0.01.
Fig 6
Fig 6. Magnitudes of IL-8 up-regulation by bacterial virulence factors.
Primary healthy HBE cells were pre-incubated for 18 hours with experimental culture medium (BEGM without hydrocorticortisone or antibiotics) and subsequently stimulated for 24 hours with sterile filtrates of P. aeriginosa culture (Pfilt; 1: 100 dilution), E. coli LPS (2.5 μg/ml), P. aeruginosa flagellin (0.5 μg/ml), or IL-1β (10 ng/ml). Production of IL-8 was quantified in cell supernatants by ELISA. Data are presented as box-and-whisker plots (medians, interquartile ranges, and min-max values) of absolute values of IL-8 production. n = 5–9 cultures per group. ** p < 0.01.
Fig 7
Fig 7. IFN-β and IL-8 response to sterile filtrates of P. aerigunosa and HRV16.
(A) and (B) Primary healthy (h) and CF (cf) HBE cells were pre-incubated for 18 hours with sterile filtrates of P. aeruginosa (Pfilt; 1: 100 dilution) in experimental culture medium (BEGM without hydrocorticortisone or antibiotics). Then, cells were inoculated for 24 hours with HRV16 (HRV) at an MOI of 0.1 in the presence of Pfilt. Afterwards, production of IFN-β (A) and IL-8 (B) was quantified in cell supernatants by respective ELISAs. Data are presented as box-and-whisker plots (medians, interquartile ranges, and min-max values) of absolute values of IFN-β and IL-8 production. n = 8 cultures per group. * p < 0.05. (C) and (D) The above cells were lysed, and expressions of mRNA of IFN-β (C) and IL-8 (D) were quantified by qPCR. Expression in basal cells (i.e., without exposure to Pfilt or HRV16; not shown) was assumed as 1. Numbers on the plot represent the medians of IFN-β mRNA up-regulation over basal in Pfilt-stimulated cells; other data are presented as box-and-whisker plots of fold up-regulation over basal. n = 8 cultures per group. * p < 0.05 and ** p < 0.01.
Fig 8
Fig 8. OAS1 response to sterile filtrates of P. aerigunosa and HRV16.
Primary healthy (h) and CF (cf) HBE cells were pre-incubated for 18 hours with sterile filtrates of P. aeruginosa (Pfilt; 1: 100 dilution) in experimental culture medium (BEGM without hydrocorticortisone or antibiotics). Then, cells were inoculated for 24 hours with HRV16 (HRV) at an MOI of 0.1 in the presence of Pfilt. Afterwards, expression of OAS1 mRNA was quantified by qPCR. Expression in basal cells (i.e., without exposure to Pfilt or HRV16; not shown) was assumed as 1. Numbers on the plot represent the medians of IFN-β mRNA up-regulation over basal in Pfilt-stimulated cells; other data are presented as box-and-whisker plots of fold up-regulation over basal. n = 8 cultures per group. * p < 0.05 and *** p < 0.001.
Fig 9
Fig 9. Intracellular HRV RNA load after a short-term inoculation with HRV16.
Primary healthy (h) and CF (cf) HBE were pre-incubated for 18 hours with experimental culture medium (BEGM without hydrocorticortisone or antibiotics), with or without sterile filtrates of P. aeruginosa culture (Pfilt; 1: 100 dilution), and were subsequently inoculated for 2 hours with HRV16 (HRV) at an MOI of 0.1. Then, virus-containing cell supernatants were removed, and cells were rinsed twice with experimental culture medium to deplete extracellular virus. Afterwards, cells were incubated without HRV, with or without Pfilt, and collected at 10 hours (A), 22 hours (B), and 34 hours (C) post-inoculation (p.i.). HRV RNA copy numbers were quantified by qPCR against a serially diluted HRV16 standard with known copy numbers. Data are presented as box-and-whisker plots (medians, interquartile ranges, and min-max values) of log10 HRV copy numbers. n = 8 cultures per group. * p < 0.05 and ** p < 0.01.
Fig 10
Fig 10. Intracellular HRV RNA load in cell lines expressing delF508 or wild-type CFTR after a short-term inoculation with HRV16.
(A) Isogenic bronchial epithelial cell lines CFBE41o- dF and WT that, respectively, overexpress delF508 or wild-type CFTR were inoculated for 2 hours with HRV16 (HRV) at an MOI of 0.1. Then, virus-containing cell supernatants were removed, cells were rinsed twice with culture medium to deplete extracellular virus, and were incubated for 2 hours post-inoculation (p.i.) HRV. Then, cells were fixed with paraformaldehyde and processed as described in the Materials and Methods to detect the HRV16 positive strand RNA by in situ hybridization. Green indicates expression of ACTB (β-actin gene; used to visualize cell cytoplasm), red dots and white arrows indicate the HRV16 positive strand RNA, and blue is DAPI (nuclear counterstain). The red and blue signals have been slightly overexposed to better visualize HRV16 RNA. (B) The above isogenic cell lines and parental cell line CFBE41o- were inoculated for 2 hours with HRV16 (HRV) at an MOI of 0.1. Then, virus-containing cell supernatants were removed, cells were rinsed twice with culture medium to deplete extracellular virus, and incubated for 10, 22, and 34 hours post-inoculation (p.i.). HRV RNA copy numbers were quantified by qPCR against a serially diluted HRV16 standard with known copy numbers. Data are presented as mean ± SEM of log10 HRV copy numbers of n = 4–5 independent experiments.

References

    1. Goffard A, Lambert V, Salleron J, Herwegh S, Engelmann I, Pinel C, et al. Virus and cystic fibrosis: rhinoviruses are associated with exacerbations in adult patients. J Clin Virol. 2014;60(2):147–53. Epub 2014/03/19. 10.1016/j.jcv.2014.02.005 . - DOI - PMC - PubMed
    1. Flight WG, Bright-Thomas RJ, Tilston P, Mutton KJ, Guiver M, Morris J, et al. Incidence and clinical impact of respiratory viruses in adults with cystic fibrosis. Thorax. 2014;69(3):247–53. Epub 2013/10/16. 10.1136/thoraxjnl-2013-204000 . - DOI - PubMed
    1. Burns JL, Emerson J, Kuypers J, Campbell AP, Gibson RL, McNamara S, et al. Respiratory viruses in children with cystic fibrosis: viral detection and clinical findings. Influenza Other Respir Viruses. 2012;6(3):218–23. Epub 2011/10/01. 10.1111/j.1750-2659.2011.00292.x . - DOI - PMC - PubMed
    1. Esposito S, Dacco V, Daleno C, Gambazza S, Montinaro V, Bisogno A, et al. Human rhinovirus infection in children with cystic fibrosis. Jpn J Infect Dis. 2014;67(5):399–401. Epub 2014/09/23. . - PubMed
    1. Kieninger E, Singer F, Tapparel C, Alves MP, Latzin P, Tan HL, et al. High rhinovirus burden in lower airways of children with cystic fibrosis. Chest. 2013;143(3):782–90. Epub 2012/11/29. 10.1378/chest.12-0954 . - DOI - PubMed

Publication types

MeSH terms