. 2015 Nov 23;10(11):e0143407.
doi: 10.1371/journal.pone.0143407. eCollection 2015.

Functional Characterization of Germline Mutations in PDGFB and PDGFRB in Primary Familial Brain Calcification

Affiliations

Functional Characterization of Germline Mutations in PDGFB and PDGFRB in Primary Familial Brain Calcification

Michael Vanlandewijck et al. PLoS One. .

Abstract

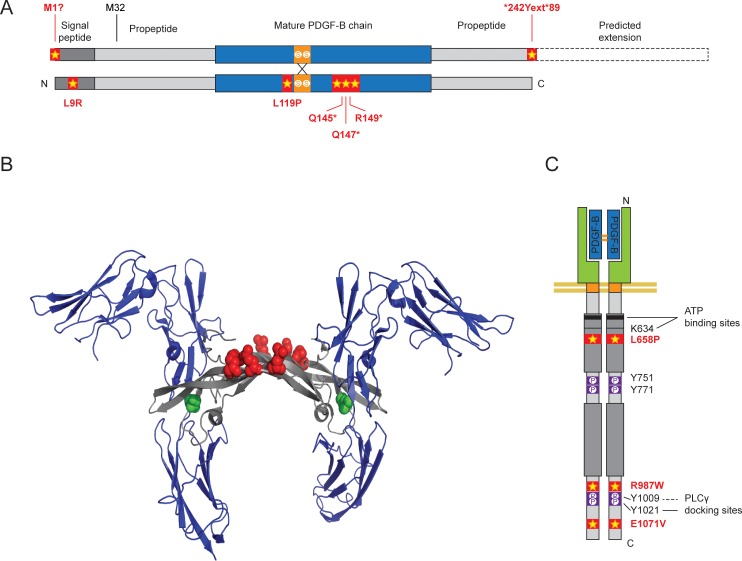
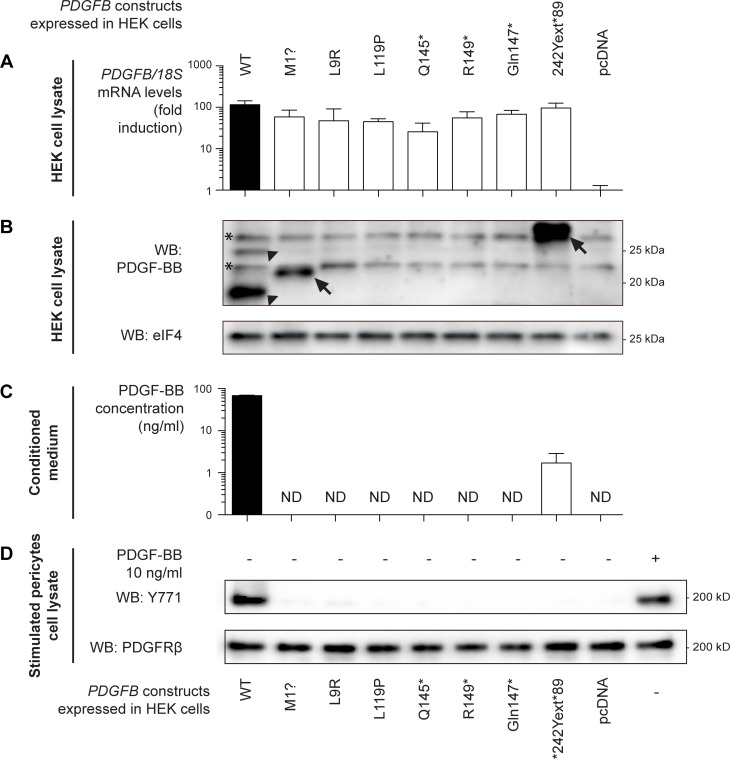
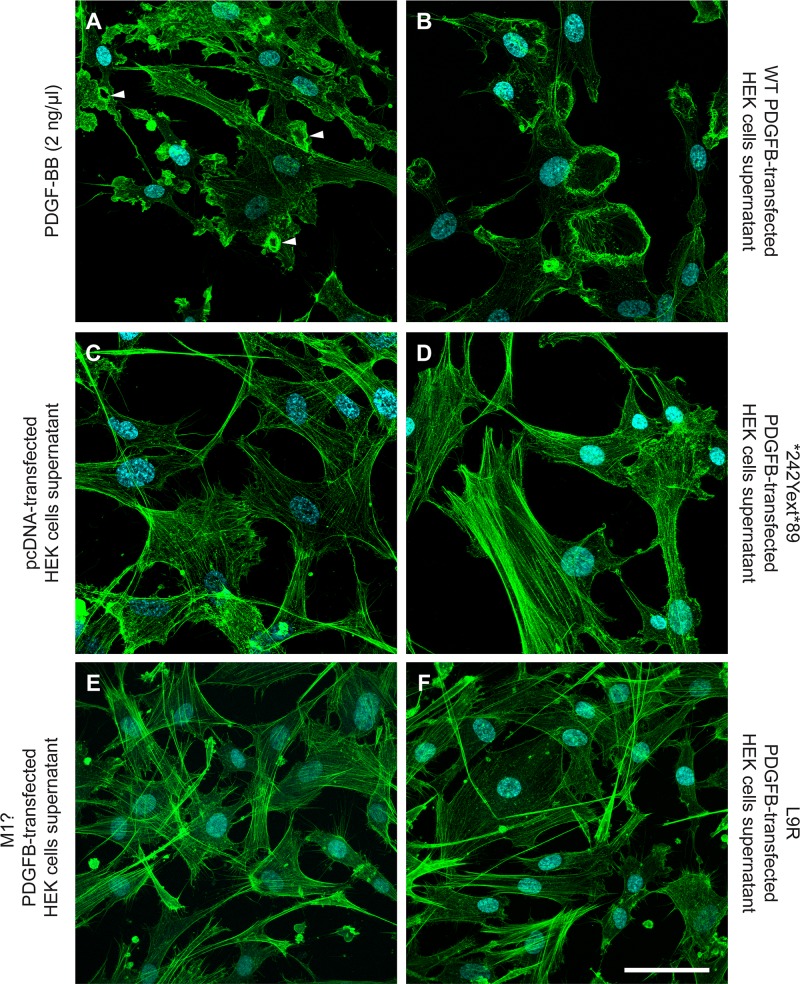
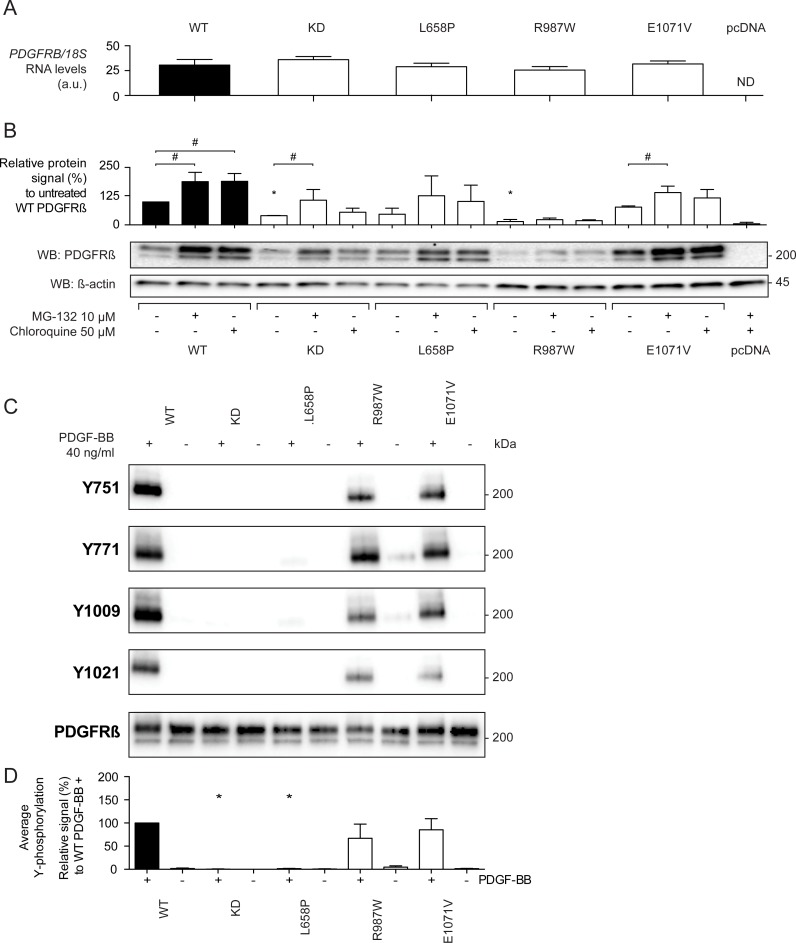
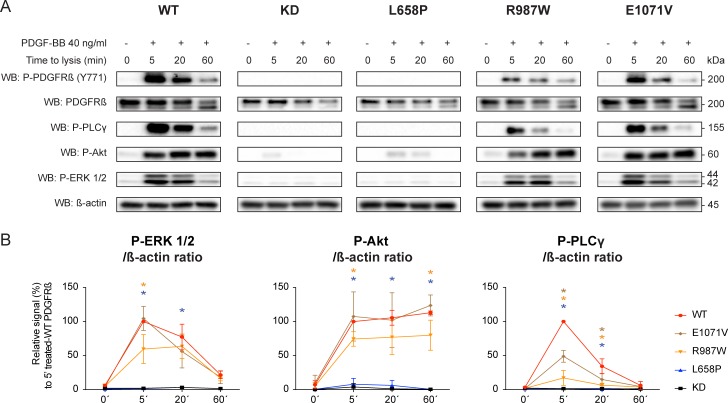
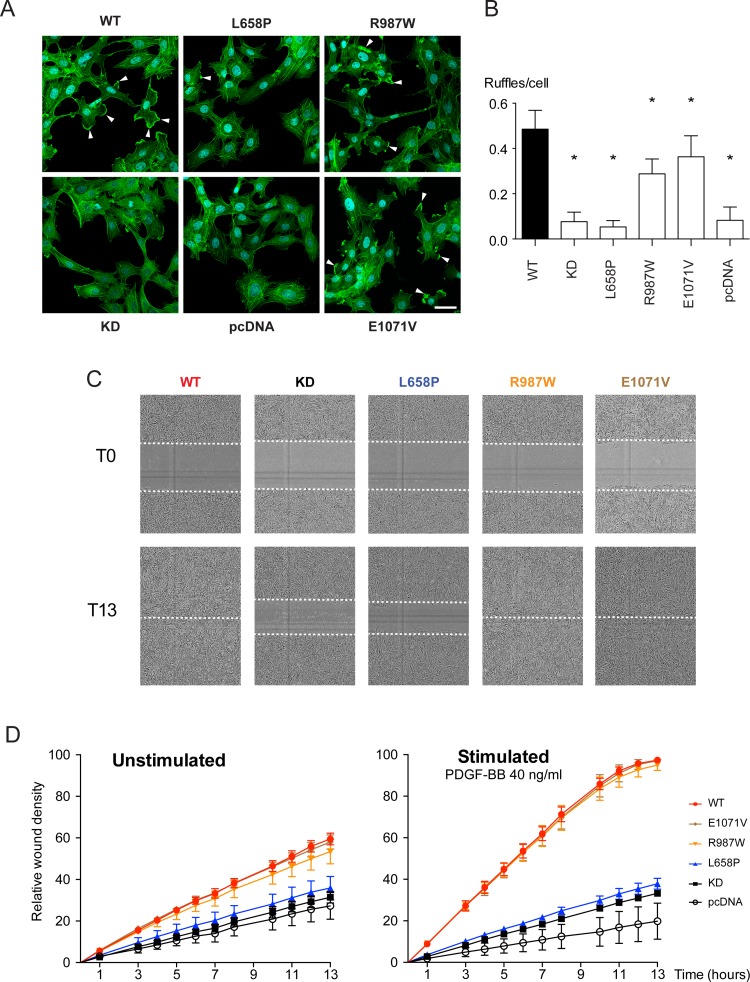
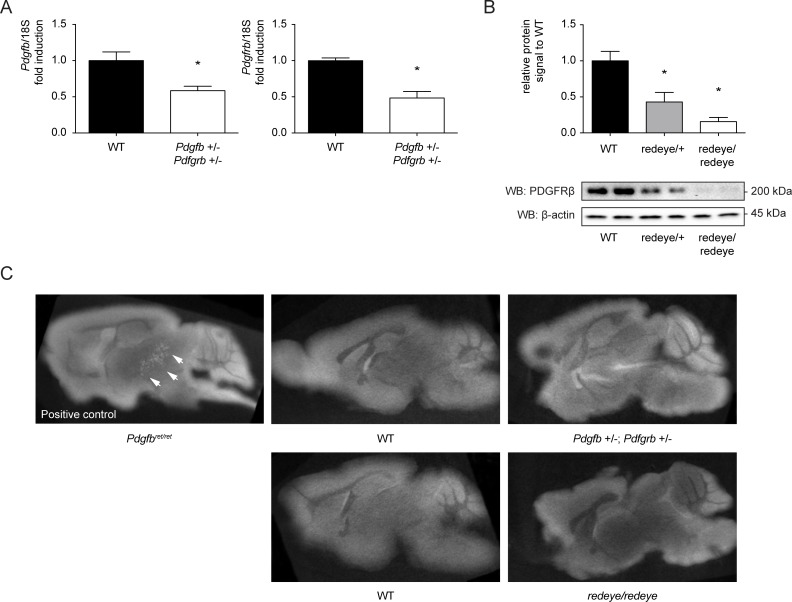
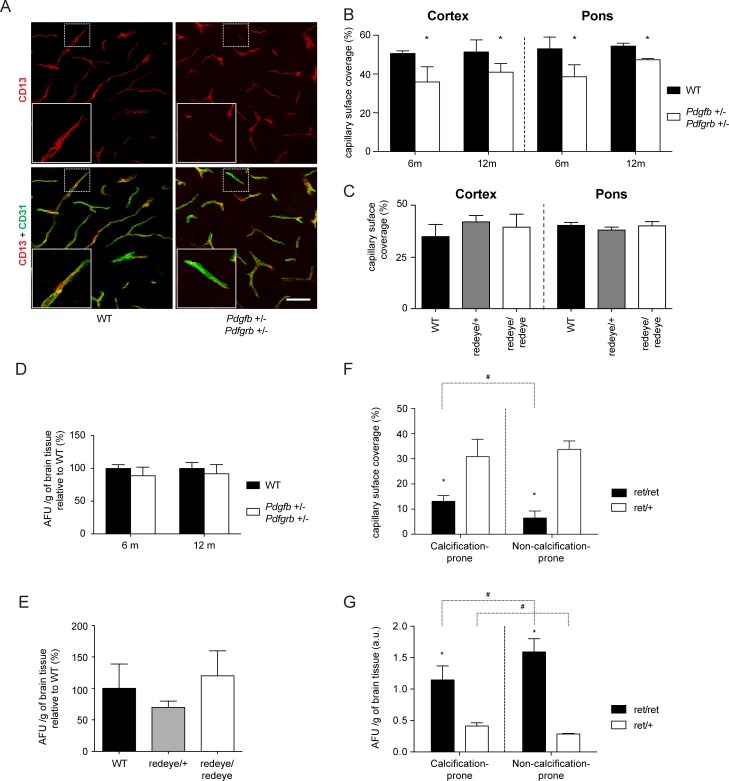
Primary Familial Brain Calcification (PFBC), a neurodegenerative disease characterized by progressive pericapillary calcifications, has recently been linked to heterozygous mutations in PDGFB and PDGFRB genes. Here, we functionally analyzed several of these mutations in vitro. All six analyzed PDGFB mutations led to complete loss of PDGF-B function either through abolished protein synthesis or through defective binding and/or stimulation of PDGF-Rβ. The three analyzed PDGFRB mutations had more diverse consequences. Whereas PDGF-Rβ autophosphorylation was almost totally abolished in the PDGFRB L658P mutation, the two sporadic PDGFRB mutations R987W and E1071V caused reductions in protein levels and specific changes in the intensity and kinetics of PLCγ activation, respectively. Since at least some of the PDGFB mutations were predicted to act through haploinsufficiency, we explored the consequences of reduced Pdgfb or Pdgfrb transcript and protein levels in mice. Heterozygous Pdgfb or Pdgfrb knockouts, as well as double Pdgfb+/-;Pdgfrb+/- mice did not develop brain calcification, nor did Pdgfrbredeye/redeye mice, which show a 90% reduction of PDGFRβ protein levels. In contrast, Pdgfbret/ret mice, which have altered tissue distribution of PDGF-B protein due to loss of a proteoglycan binding motif, developed brain calcifications. We also determined pericyte coverage in calcification-prone and non-calcification-prone brain regions in Pdgfbret/ret mice. Surprisingly and contrary to our hypothesis, we found that the calcification-prone brain regions in Pdgfbret/ret mice model had a higher pericyte coverage and a more intact blood-brain barrier (BBB) compared to non-calcification-prone brain regions. While our findings provide clear evidence that loss-of-function mutations in PDGFB or PDGFRB cause PFBC, they also demonstrate species differences in the threshold levels of PDGF-B/PDGF-Rβ signaling that protect against small-vessel calcification in the brain. They further implicate region-specific susceptibility factor(s) in PFBC pathogenesis that are distinct from pericyte and BBB deficiency.


Conflict of interest statement

Competing Interests: The authors have declared that no competing interests exist.

Figures

Fig 1
Fig 1. Overview of PFBC-related PDGFB and PDGFRB mutations.
(A) In-scale schematic representation of a PDGF-BB dimer with the location of the known PFBC-associated mutations. Cysteine residues involved in interchain disulfide bonds are indicated in orange. The relative position of different mutations is indicated by stars. The predicted protein extension due to the stop codon mutation is indicated by dashed boxes. (B) Location of the main point mutations in PDGFB in the PDGF-BB:PDGF-Rβ complex. Ribbon diagram of two PDGF-Rβ proteins (in blue) in complex with dimeric PDGF-B (in grey). The location of the 3 stop mutations Q145*, Q147* and R149* are indicated in red. The location of the L119P missense mutation is indicated in green. The image was created from PDB 3MJG (Platelet-derived growth factor subunit B) using PyMOL (The PyMOL Molecular Graphics System, Version 1.2r3pre, Schrödinger, LLC. http://pymol.sourceforge.net/faq.html). (C) Schematic representation of a PDGFRβ dimer with the location of the known PFBC-associated mutations. Ig-like C2-type domains are indicated by oval shapes. The split tyrosine-kinase domain is indicated by dark grey boxes. Tyrosine autophosphorylation sites Y751, Y771, 71009 and Y1021 assessed in the article are indicated in purple. ATP-binding sites are indicated in black, including the K634 residue mutated in our kinase-dead negative control. The relative position of the mutations is indicated by stars.
Fig 2
Fig 2. PFBC PDGFB mutations result in loss of detectable and/or functional PDGF-BB.
(A) qPCR analysis for human PDGFB in stably transfected HEK293 cells. Individual vectors expressing each of the mutations identified in PFBC families were stably transfected into HEK cells. Wild-type (WT) PDGFB-expressing construct and empty vector (pcDNA) were used as positive and negative controls, respectively. mRNA levels are shown as fold increase over basal expression of PDGF-B in HEK cells. 18s Ribosomal RNA was used for normalization. Error bars indicate standard deviation of three independent experiments. (B) Detection of PDGF-B protein expression in stably transfected HEK293 cells. Immunoblot of HEK293 cell lysates showing expression of the different PDGFB constructs. The arrowheads indicate the 2 bands corresponding to PDGF-B in the wild-type condition, probably representing fully and partially proteolytically processed PDGF-B chains. Arrows indicate specific bands migrating slower due to a mutation-induced size shift. Non-specific bands in the background are marked with asterisks. (C) ELISA assay for detection of PDGF-BB in conditioned medium of stably transfected HEK cells. HEK cells overexpressing the different PFBC mutations were serum-starved for 24 hours prior to collection of their growth medium. An ELISA specific for human PDGF-BB was performed to detect secreted PDGF-BB. Error bars indicate the standard deviation over three individual measurements. ND: Not detected. (D). Western blot of autophosphorylation of PDGF-Rβ in human brain pericytes (HBP). HBPs were serum-starved overnight, cooled on ice and their medium replaced by either cooled conditioned medium from B-C, or cooled pericyte medium supplemented with 10 ng/ml PDGF-BB (right lane). After 1 hour-incubation on ice, cells were lysed and immunoblots were performed on duplicate membranes using anti-phospho-PDGF-Rβ (Y771) and anti-total PDGF-Rβ (28E1) antibodies.
Fig 3
Fig 3. Conditioned medium from mutant PDGFB-transfected HEK cells fails to induce membrane ruffles in human brain pericytes.
After overnight serum starvation, human brain pericytes (HBP) were cooled on ice and exposed to cooled conditioned medium from HEK cells (described in Fig 1B and 1C) for 15 minutes, then warmed up in at 37°C for 30 min and fixed for phalloidin staining. A low concentration of exogenous PDGF-BB (2 ng/ml) in serum-free pericyte medium (A) and conditioned medium from wild-type PDGFB-transfected HEKs (B) were used as a positive controls. Supernatant from pcDNA-transfected HEKs was used as a negative control (C). The first two conditions induced widespread circular ruffles (arrowheads), which were absent in the negative control. Likewise, HBP treated with conditioned medium from mutant PDGFB transfected HEKs did not show any ruffles: (D) *242Yext*89 mutation, (E) M1? mutation and (F) L9R mutation. Cyan: DAPI. Green: Alexa 488 conjugated phalloidin. Scale bar: 30 μm.
Fig 4
Fig 4. Expression and autophosphorylation of PDGF-Rβ mutants in PAE cells.
PAE cells were stably transfected with vectors expressing the different PFBC mutations found in PDGFRB. (A) After mRNA extraction, the total expression of human PDGFRB was detected with qPCR. Error bars indicate standard deviation between 3 independent experiments. ND: Not detected. (B) Immunoblot demonstrating the protein expression levels of the different PDGFRB mutants. Stable clones of mutant PDGFRB expressing PAE cells were treated with a proteasomal inhibitor (MG-132), lysosomal inhibitor (chloroquine) or vehicle for 4 hours before lysis. Total levels of PDGF-Rβ were visualized with anti-total PDGF-Rβ (28E1) antibody. The graphs indicate relative expression level of the inhibitor-treated conditions vs control condition for three individual experiments. Error bars indicate standard deviation. *p<0.05 compared to basal wild type (WT) expression, # p<0.05 when comparing inhibitor-treated vs control condition for each mutant. (CD) Autophosphorylation of the PDGF-Rβ mutants. PAE cells stably expressing mutant PDGF-Rβ were exposed to 40 ng/ml of exogenous PDGF-BB for 60 minutes after cooling on ice. A wild-type PDGFRB-expressing construct was used as a positive control, while a kinase dead (KD) variant was used as a negative control. Cell lysates were adjusted to yield a comparable amount of PDGF-Rβ signal. (C) Representative western blot demonstrating autophosphorylation of the different mutants on four residues. (D) Quantification of PDGF-Rβ autophosphorylation signal from tyrosine residues 751, 771, 1009 and 1021 using phospho-specific antibodies. Signals were normalized over total levels of PDGF-Rβ protein, and expressed as a percentage of wild-type PDGF-Rβ autophosphorylation. The graph represents the averaged results from the 4 tyrosine residues that were assessed in three independent experiments. *p<0,05 when compared to the positive control (WT PDGF-Rβ).
Fig 5
Fig 5. Effect of PDGFRB mutations on PDGF-B signaling.
(A) Western blot for known downstream targets of PDGF-B signaling. PAE cells were stimulated with 40 ng/ml PDGF-BB for the indicated time periods. Autophosphorylation of PDGF-Rβ mutants was investigated with a phosphospecific antibody raised against tyrosine 771, while downstream PDGF-BB signaling was assessed with antibodies directed against phosphorylated activated forms of ERK 1/2, Akt and PLCγ. β-actin was used as a loading control. (B). To quantify ERK 1/2, Akt and PLCγ activations over time, the signals were normalized over β-actin levels and plotted against time. Error bars indicate the standard deviation of three independent experiments. *p˂0,05 when compared to wild-type PDGFRβ (red), with the color of the star indicating the mutant PDGFRβ that is being compared to wild-type PDGFRβ (blue: L658P, yellow: R987W, brown: E1071V).
Fig 6
Fig 6. Effect of PDGFRB mutations on membrane ruffle formation and wound healing.
(AB) PDGF-BB—induced membrane ruffling of stably transfected PAE cells expressing mutant PDGF-Rβ receptor. (A) Fluorescent labeling of the actin cytoskeleton in PAE cells after 30 minutes of PDGF-BB exposure. Arrowheads indicate peripheral membrane ruffles. Cyan: DAPI, green: Alexa 488-conjugated phalloidin. Error bar: 30 μm. (B) The total amount of ruffles was counted in 20 fields per condition, and normalized over the total amount of cells. *p˂0.05 as compared to wild-type PDGFRB-expressing PAE cells. Empty vector (pcDNA) and KD PDGFRB-transfected cells were used as negative controls. (CD) Wound healing assays of stably transfected PAE cells expressing different mutant PDGFRβ receptors. Confluent monolayers of PAE cells expressing different PDGFRB constructs were scratched using the WoundMaker™ and wound closure was monitored automatically every hour for 13 hours with the IncuCyte Zoom®. (C) Representative images of the wound at 0 and 13 hours of PDGF-BB stimulation. (D) Quantification of the increase in relative wound density within 13 hours. Error bars indicate standard deviation between 6 individual scratches, 2 images per scratch.
Fig 7
Fig 7. Screening for calcifications in Pdgfb+/-; Pdgfrb+/- and Pdgfrbredeye/redeye mice.
(A). RT-PCR for murine Pdgfb and Pdgfrb in brain total RNA extractions. mRNA levels of Pdgfb and Pdgfrb are shown relative to the expression in wild-type animals. *p<0.05 as compared to wild-type animals. Error bars indicate standard deviation of mRNA levels in 4 different animals. (B). Western Blot for PDGFRβ levels in Pdgfrb redeye/redeye mice. A representative Western blot indicates the reduction in detectable protein level of PDGFRβ in two mice for each genotype. As a loading control, β-actin was used. The graphs display a quantification of the levels of PDGFRβ. Error bars indicate standard deviation of receptor levels from 4 animals each. *p<0.05 as compared to wild-type animals. (C). Micro computed tomography (micro-Ct) analysis of Pdgfb ret/ret, Pdgfb +/-;Pdgfrb +/- and Pdgfr redeye/redeye mouse brains. After perfusion, the mouse brain of aged mice was surgically removed and prepared for micro-Ct. For each genotype, three brains were scanned. Brains of Pdgfb ret/ret mice were used as a positive control, and Pdgfb ret/+, Pdgfrb redeye/+ or wild-type mice were used as negative controls.
Fig 8
Fig 8. Assessment of vessel pericyte coverage and blood-brain barrier integrity in aged Pdgfrbredeye/redeye and Pdgfb+/-; Pdgfrb+/- mice.
(ABC) Assessment of pericyte coverage. A CD13 and CD31 co-immunolabelling was performed on 50 μm-thick parasagittal vibratome sections. (A) Representative 2D projections of ~40 μm z-stacks taken from the dorsal pons of wild-type (left panels) and double heterozygous (right panels) animals; upper panels (red): CD13 immunostaining; lower panels: merged CD31 (green) and CD13 immunostainings. Inserts provide a more detailed indication of the coverage rate. Scale bar: 30 μm. The capillary surface coverage rate in Pdgfb +/- ; Pdgfrb +/- (B) and Pdgfrb redeye/redeye mice (C) was calculated and is plotted as the percentage of the vessel surface enveloped by pericytes. Two pictures from the dorsal pons and two pictures from the cortex were analyzed for each animal. The standard deviation of pericyte coverage of 4 animals per genotype is indicated by the error bars. WT mice and heterozygous Pdgfrb redeye/redeye mice were used as controls. (DE) Blood-brain barrier permeability assessment in Pdgfb +/- ; Pdgfrb +/- (D) and Pdgfrb redeye/redeye (E) mice. Lysine-fixable cadaverine conjugated to Alexa Fluor-555 was injected intravenously into the tail vein (5 mg/ml in saline) 2 hours before sacrifice. Fluorescence was measured in the brain homogenate and arbitrary fluorescence units (AFU) were normalized to the brain weight. Error bars indicate standard deviation of fluorescence level measurement in 4 different animals. (F). Pericyte coverage of vessels in calcification prone regions compared with non-calcification-prone regions. Different brain regions were assessed for pericyte coverage in Pdgfb ret/ret mice and the result is plotted as the percentage of the vessel surface enveloped by pericytes. For each animal, two pictures from the dorsal pons (calcification-prone) and two pictures from the cortex (non-calcification-prone) were analyzed. The standard deviation of pericyte coverage of 4 animals per genotype is indicated by the error bars. *p<0,05 when comparing Pdgfb ret/ret with Pdgfb ret/+, #p<0,05 when comparing calcification-prone regions with non-calcification-prone regions in Pdgfb ret/ret mice. (G). Analysis of blood-brain barrier integrity in calcification prone regions compared to non-calcification-prone regions. Alexa Fluor-555 conjugated cadaverine tracer was allowed to circulate for 2 hours prior to sacrifice of the mice. The calcification prone regions of the brain were microdissected, and after homogenizing of the tissue, fluorescence was measured and normalized over the tissue weight (AFU). The standard deviation of 4 animals per genotype is indicated by the error bars. *p<0,05 when comparing Pdgfb ret/ret with Pdgfb ret/+, #p<0,05 when comparing calcification-prone regions with non-calcification-prone regions in Pdgfb ret/ret mice.

References

    1. Andrae J, Gallini R, Betsholtz C. Role of platelet-derived growth factors in physiology and medicine. Genes & Development. 2008;22: 1276–1312. 10.1101/gad.1653708 - DOI - PMC - PubMed
    1. Hoch RV, Soriano P. Roles of PDGF in animal development. Development. 2003;130: 4769–4784. 10.1242/dev.00721 - DOI - PubMed
    1. Lindahl P, Johansson BR, Levéen P, Betsholtz C. Pericyte loss and microaneurysm formation in PDGF-B-deficient mice. Science. American Association for the Advancement of Science; 1997;277: 242–245. 10.1126/science.277.5323.242 - DOI - PubMed
    1. Hellström M, Kalén M, Lindahl P, Abramsson A, Betsholtz C. Role of PDGF-B and PDGFR-beta in recruitment of vascular smooth muscle cells and pericytes during embryonic blood vessel formation in the mouse. Development. 1999;126: 3047–3055. - PubMed
    1. Levéen P, Pekny M, Gebre-Medhin S, Swolin B, Larsson E, Betsholtz C. Mice deficient for PDGF B show renal, cardiovascular, and hematological abnormalities. Genes & Development. 1994;8: 1875–1887. - PubMed

Publication types

MeSH terms

Substances