. 2016 May;279(2):400-9.
doi: 10.1148/radiol.2015150895. Epub 2015 Nov 24.

Gliomas: Motexafin Gadolinium-enhanced Molecular MR Imaging and Optical Imaging for Potential Intraoperative Delineation of Tumor Margins

Affiliations

Gliomas: Motexafin Gadolinium-enhanced Molecular MR Imaging and Optical Imaging for Potential Intraoperative Delineation of Tumor Margins

Longhua Qiu et al. Radiology. 2016 May.

Abstract

Purpose: To investigate the possibility of using motexafin gadolinium (MGd)-enhanced molecular magnetic resonance (MR) imaging and optical imaging to identify the true margins of gliomas.

Materials and methods: The animal protocol was approved by the institutional animal care and use committee. Thirty-six Sprague-Dawley rats with gliomas were randomized into six groups of six rats. Five groups were euthanized 15, 30, 60, 120, and 240 minutes after intravenous administration of 6 mg/kg of MGd, while one group received only saline solution as a control group. After craniotomy, optical imaging and T1-weighted MR imaging were performed to identify the tumor margins. One-way analysis of variance was used to compare optical photon intensity and MR imaging signal-to-noise ratios. Histologic analysis was performed to confirm the intracellular uptake of MGd by tumor cells and to correlate the tumor margins delineated on both optical and MR images.

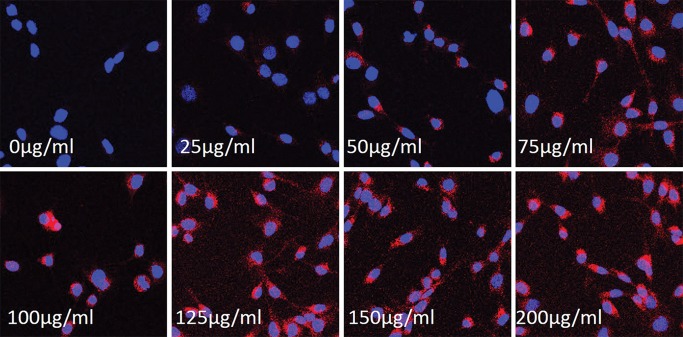
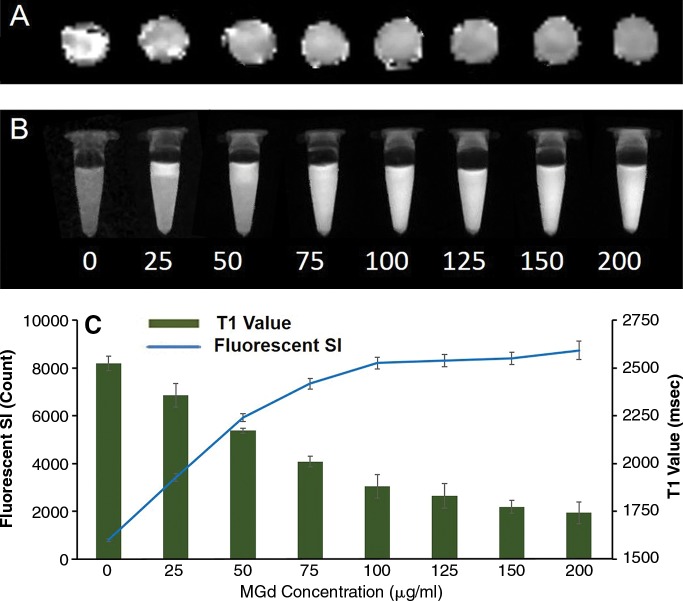
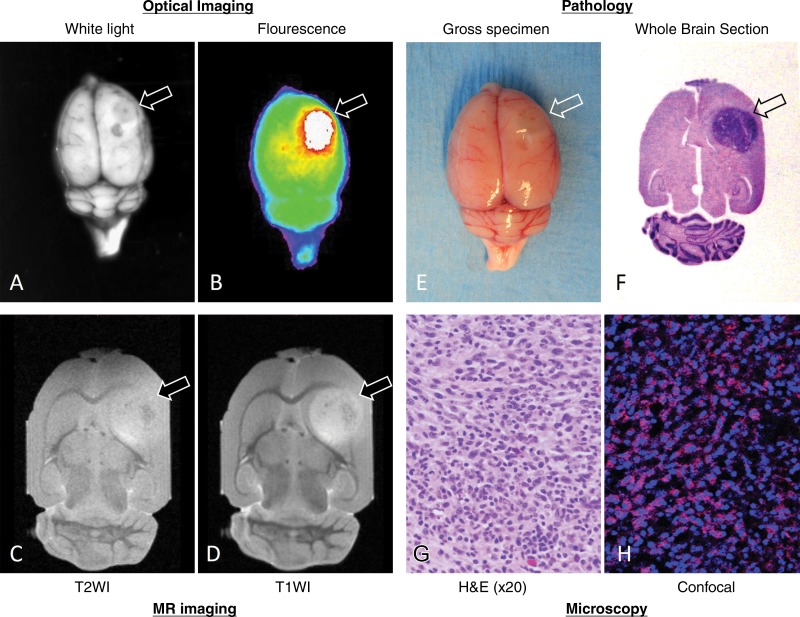
Results: Both optical imaging and T1-weighted MR imaging showed tumor margins. The highest optical photon intensity (2.6 × 10(8) photons per second per mm(2) ± 2.3 × 10(7); analysis of variance, P < .001) and MR signal-to-noise ratio (77.61 ± 2.52; analysis of variance, P = .006) were reached at 15-30 minutes after administration of MGd, with continued tumor visibility at 2-4 hours. Examination with confocal microscopy allowed confirmation that the fluorescence of optical images and MR imaging T1 enhancement exclusively originated from MGd that accumulated in the cytoplasm of tumor cells.

Conclusion: MGd-enhanced optical and MR imaging can allow determination of glioma tumor margins at the optimal time of 15-120 minutes after administration of MGd. Clinical application of these results may allow complete removal of gliomas in a hybrid surgical setting in which intraoperative optical and MR imaging are available.


Figures

Figure 1:
Figure 1:
Confocal microscopic images of rat C6 glioma cells treated with MGd at different concentrations show that MGd-emitting red fluorescence signal intensity becomes more intense as concentration of MGd increases, which indicates that intracellular uptake of MGd is concentration dependent (magnification, ×20).
Figure 2:
Figure 2:
Quantitative analysis of cells treated with MGd at different concentrations. A, MR imaging T1 map of glioma cells and, B, fluorescent optical image of cells at different concentrations from 0 to 200 μg/mL show that T1 value decreases and fluorescent signal (SI) increases as MGd concentrations increase. C, Graph shows T1 values and fluorescent signal compared with MGd concentration, further confirming that intracellular uptake of MGd increases as concentrations of MGd increase from 0 to 100 μg/mL and then maintains stable level as MGd concentration increases further.
Figure 3:
Figure 3:
Optical imaging of cells treated with MGd at concentration of 100 μg/mL at various incubation durations. A, Optical image shows that signal intensity (SI) of MGd-emitting fluorescence increases as MGd incubation time increases. B, Graph shows time to fluorescence signal intensity curve in which signal intensity increases from 0 to 24 hours and then plateaus for following 24 hours. C, Confocal microscopy confirms early uptake of MGd by cells after MGd incubation for 15 minutes, D, while no intracellular red fluorescence was seen in nontreated control cells (magnification, ×20).
Figure 4:
Figure 4:
Representative optical and MR images of MGd-enhanced rat glioma mass, with pathologic correlation and confirmation. A, Whole-brain white light image of tumor (arrow) and, B, overlay image of fluorescent tumor on white-light image clearly show margin of tumor outlined by MGd-emitting fluorescence. C, Axial non-contrast-enhanced T2-weighted (T2WI) MR image shows tumor with intermediate signal intensity (arrow). D, MGd-enhanced T1-weighted (T1WI) MR image shows heterogeneous and significant internal enhancement of tumor with clear margin. E, Whole-brain photograph displays tumor extruding (arrow) from surface of brain. F, Cross-sectional view of hematoxylin and eosin (H&E)–stained brain section shows tumor located in frontal caudate area (arrow) and, G, glioma tumor is confirmed by means of microscopy. H, Confocal microscopic image shows exclusive intracellular accumulation of MGd (pink spots in H) in glioma tumor cells.
Figure 5:
Figure 5:
Optical imaging and MGd-enhanced T1-weighted imaging of rat glioma tumors collected at different time points after MGd administration. Optical images (top row) and overlay optical images (second row) show that tumors have highest signal intensity at 15–30 minutes after administration of MGd, and signal intensity becomes weak during observation times of 4 hours. Axial T1-weighted MR images (third row) show strongest enhancement of tumors at 15 minutes, with signal intensity of MGd-enhanced tumors decreasing during observation times. Cross-sectional view of hematoxylin and eosin–stained sections (fourth row) confirms presence of tumors in brains. Graphs show time-to-photon intensity (left) and time-to-signal-to-noise ratio (SNR) curves (right). Steep increase in signal intensity was seen at 15 minutes, followed by gradual signal intensity decline on both optical and MR images. T1WI = T1-weighted imaging.
Figure 6:
Figure 6:
Confocal microscopic images of MGd-treated tumors show that MGd is specifically taken up by glioma cells (intracellular pink spots on G–K), and highest signal intensity is demonstrated at 15 minutes. There is clear margin between MGd-containing tumor cells (T) and normal brain cells (NB).

References

    1. Van Meir EG, Hadjipanayis CG, Norden AD, Shu HK, Wen PY, Olson JJ. Exciting new advances in neuro-oncology: the avenue to a cure for malignant glioma. CA Cancer J Clin 2010;60(3):166–193. - PMC - PubMed
    1. Meyer MA. Malignant gliomas in adults. N Engl J Med 2008;359(17):1850; author reply 1850. - PubMed
    1. Eyüpoglu IY, Hore N, Savaskan NE, et al. . Improving the extent of malignant glioma resection by dual intraoperative visualization approach. PLoS One 2012;7(9):e44885. - PMC - PubMed
    1. Stummer W, Pichlmeier U, Meinel T, et al. . Fluorescence-guided surgery with 5-aminolevulinic acid for resection of malignant glioma: a randomised controlled multicentre phase III trial. Lancet Oncol 2006;7(5):392–401. - PubMed
    1. Colditz MJ, Jeffree RL. Aminolevulinic acid (ALA)-protoporphyrin IX fluorescence guided tumour resection. Part 1: clinical, radiological and pathological studies. J Clin Neurosci 2012;19(11):1471–1474. - PubMed

LinkOut - more resources