. 2015 Nov 24;10(11):e0142994.
doi: 10.1371/journal.pone.0142994. eCollection 2015.

Squidpops: A Simple Tool to Crowdsource a Global Map of Marine Predation Intensity

Affiliations

Squidpops: A Simple Tool to Crowdsource a Global Map of Marine Predation Intensity

J Emmett Duffy et al. PLoS One. .

Abstract

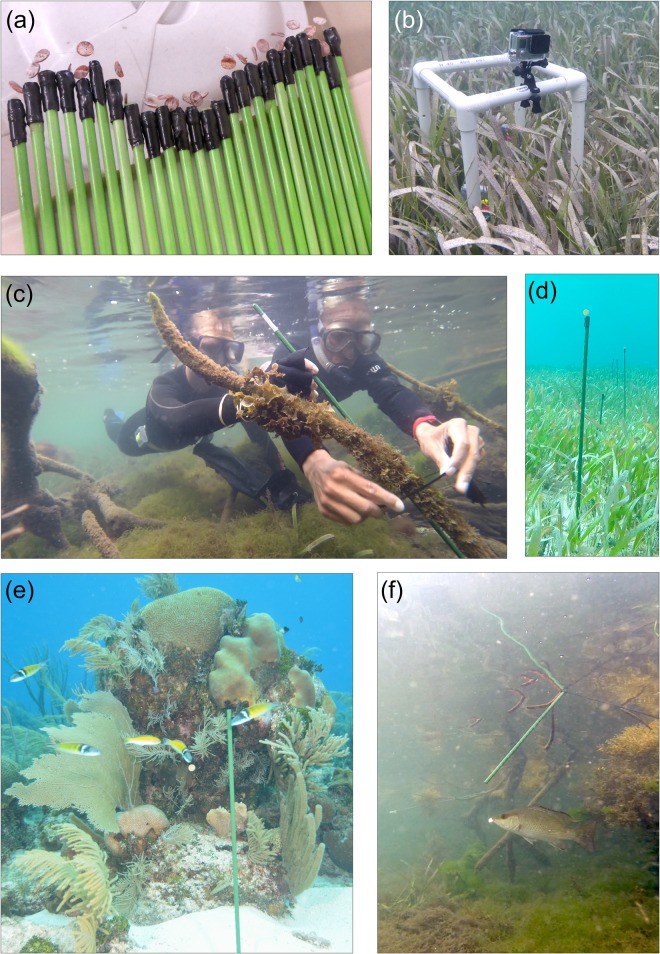
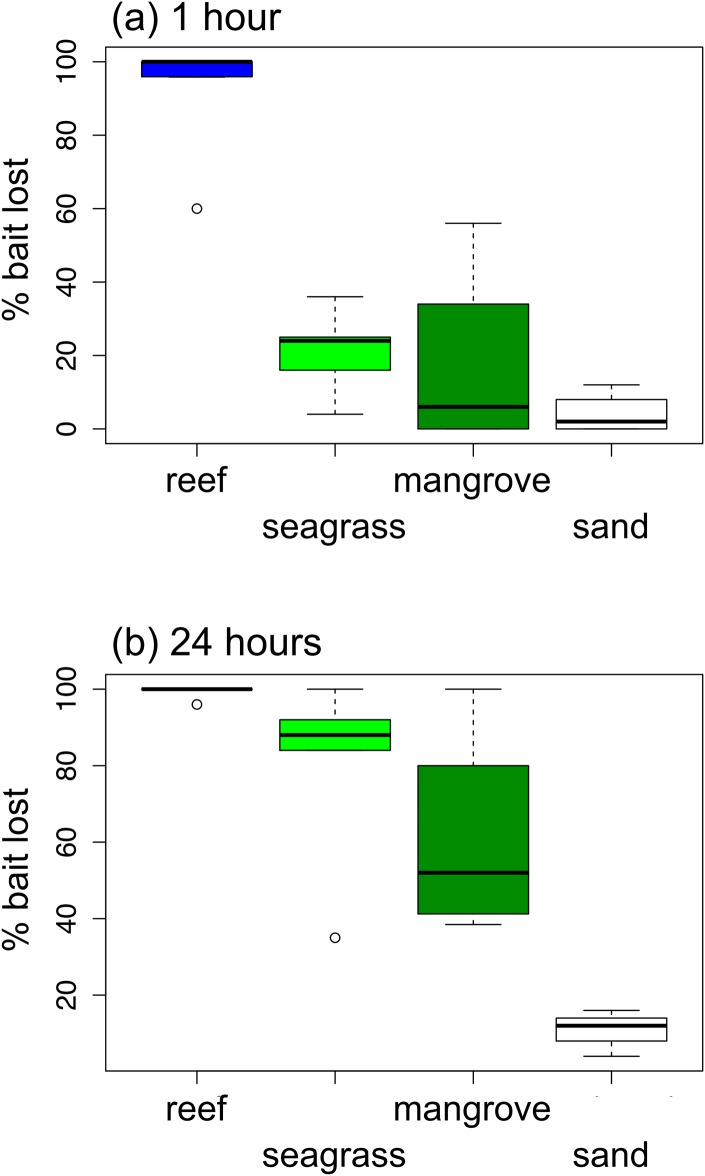
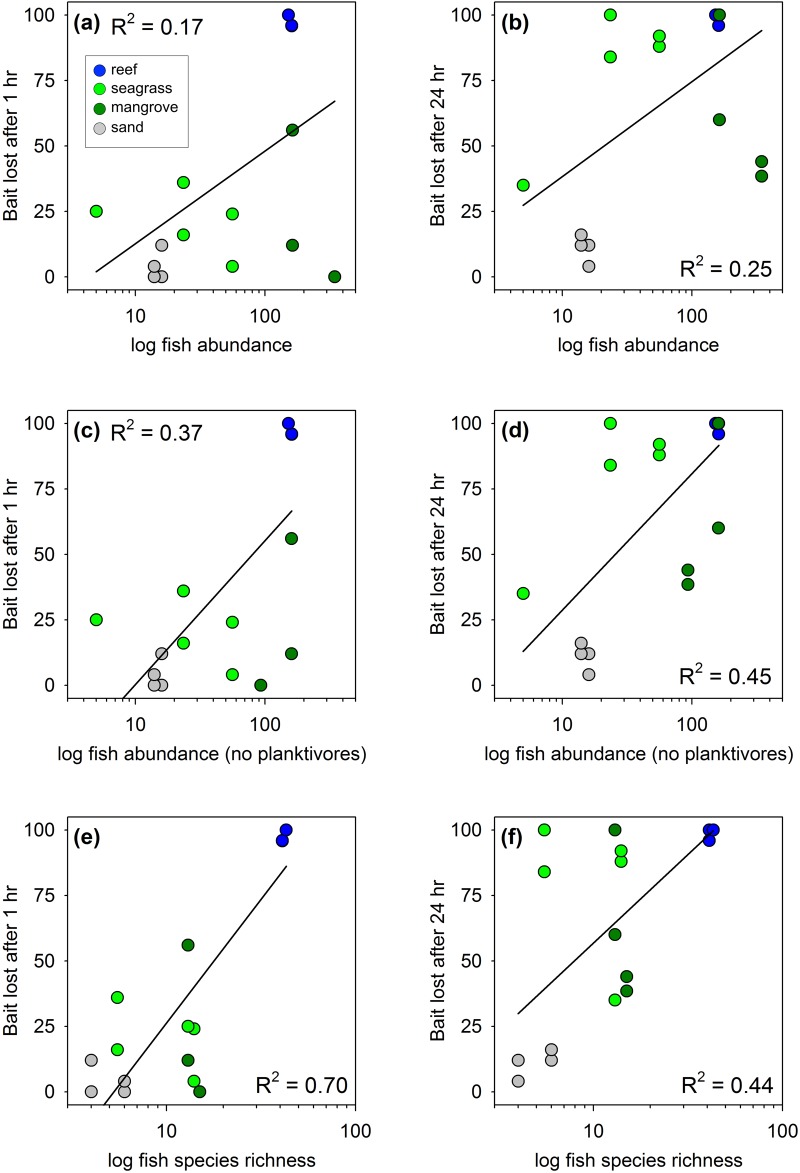
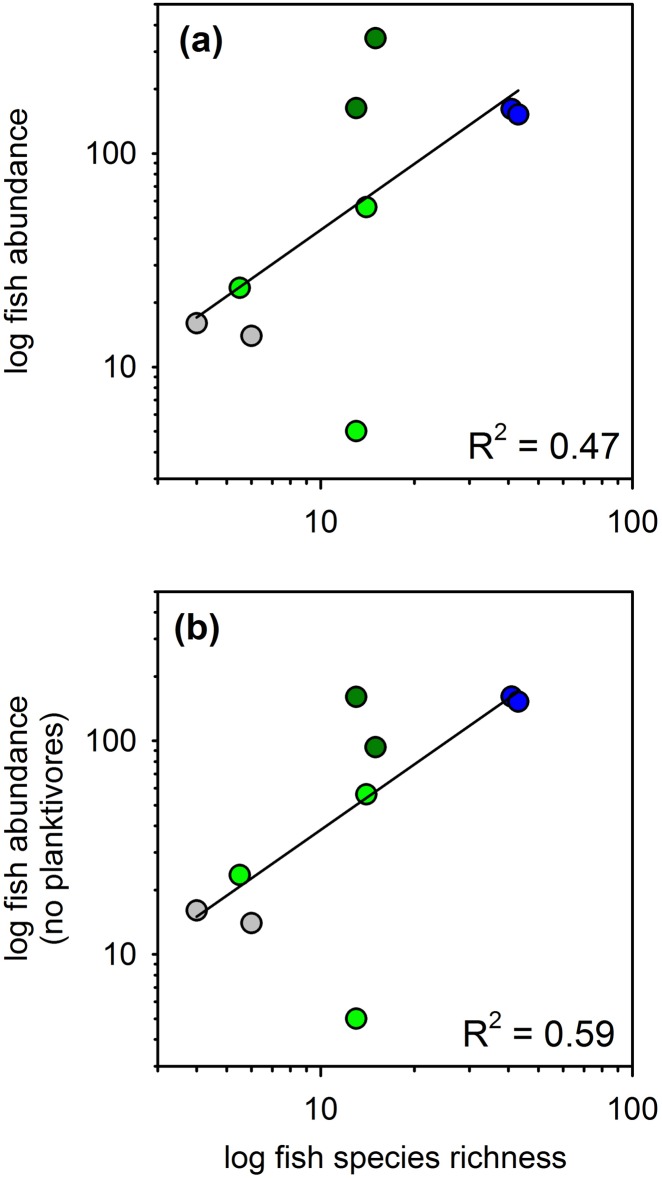
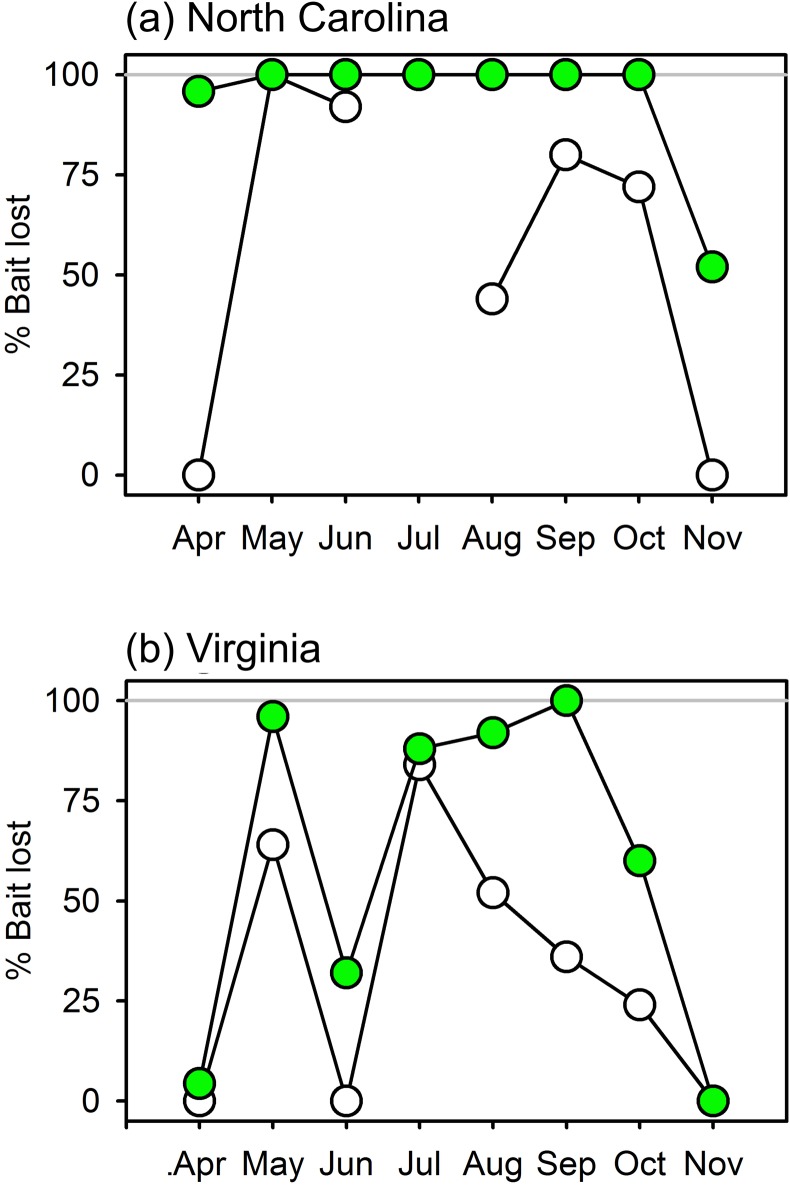
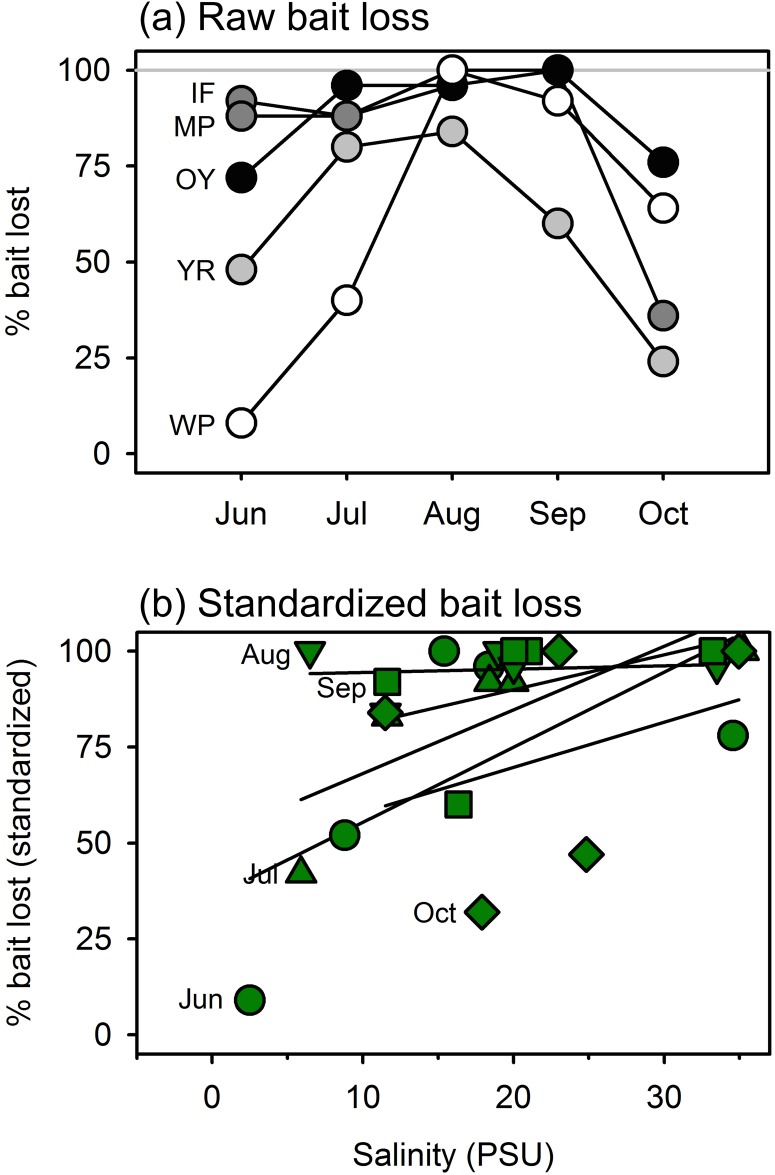
We present a simple, standardized assay, the squidpop, for measuring the relative feeding intensity of generalist predators in aquatic systems. The assay consists of a 1.3-cm diameter disk of dried squid mantle tethered to a rod, which is either inserted in the sediment in soft-bottom habitats or secured to existing structure. Each replicate squidpop is scored as present or absent after 1 and 24 hours, and the data for analysis are proportions of replicate units consumed at each time. Tests in several habitats of the temperate southeastern USA (Virginia and North Carolina) and tropical Central America (Belize) confirmed the assay's utility for measuring variation in predation intensity among habitats, among seasons, and along environmental gradients. In Belize, predation intensity varied strongly among habitats, with reef > seagrass = mangrove > unvegetated bare sand. Quantitative visual surveys confirmed that assayed feeding intensity increased with abundance and species richness of fishes across sites, with fish abundance and richness explaining up to 45% and 70% of the variation in bait loss respectively. In the southeastern USA, predation intensity varied seasonally, being highest during summer and declining in late autumn. Deployments in marsh habitats generally revealed a decline in mean predation intensity from fully marine to tidal freshwater sites. The simplicity, economy, and standardization of the squidpop assay should facilitate engagement of scientists and citizens alike, with the goal of constructing high-resolution maps of how top-down control varies through space and time in aquatic ecosystems, and addressing a broad array of long-standing hypotheses in macro- and community ecology.


Conflict of interest statement

Competing Interests: The authors have declared that no competing interests exist.

Figures

Fig 1
Fig 1. Design and deployment of the squidpop predation assay.
(a) Assembled squidpops ready for deployment. (b) A GoPro camera deployed adjacent to a row of squidpops in seagrass to capture a record of predator visits. (c) Squidpops were attached to mangrove prop roots using cable-ties. (d) Squidpops deployed in a seagrass bed in Belize. (e) Bluehead wrasses (Thalassoma bifasciatum) attacking a squidpop in a reef habitat in Belize. (f) Gray snapper (Lutjanus griseus) attacking a squidpop in a mangrove habitat in Belize. The individuals pictured in Fig 1a) have given written informed consent (as outlined in PLOS consent form) to publish these case details.
Fig 2
Fig 2. Variation in predation (loss of squid baits) across habitats on the Belize Barrier Reef after (a) one hour and (b) 24 hours.
Box and whisker plots show median (thick horizontal line), quartiles (box), 95% percentiles (whiskers) and outliers. Bait loss differed strongly among habitats (P < 0.001), and between 1 and 24 hour scoring times (P < 0.001), with a significant interaction between habitat and time (P = 0.035) based on analysis of deviance from a generalized linear mixed effects model.
Fig 3
Fig 3. Variation in predation (loss of squid baits) across habitats on the Belize Barrier Reef as a function of fish abundance (a-d) and richness (e,f).
Panels b and d show relationships to fish abundance when schooling planktivores are excluded. All relationships are significant (P < 0.05, linear regression).
Fig 4
Fig 4. Relationships between fish abundance and richness across habitats on the Belize Barrier Reef.
(a) Data for all fishes. (b) Schooling planktivores excluded. Both relationships are significant (P < 0.05, linear regression). Symbol colors as in Fig 3.
Fig 5
Fig 5. Variation in predation (loss of squid baits) in seagrass habitat across seasons and latitude.
Plotted are % of baits lost after 1 and 24 hours at a northern (Virginia) and a southern site (North Carolina), deployed monthly from April through November 2014. Unfilled and filled symbols represent losses at 1 and 24 hours, respectively.
Fig 6
Fig 6. Variation in biomass of epifaunal crustaceans in seagrass habitat across seasons and latitude.
Blue and red bars show results from North Carolina and Virginia, respectively, during monthly squidpop deployments between April and November 2014.
Fig 7
Fig 7. Variation in predation (loss of squid baits) in salt marsh habitat across seasons along a salinity gradient from near freshwater at the head of the York River (West Point, WP) to the ocean margin at Oyster (OY), Virginia, USA, deployed monthly from June through September 2014.
(a) Seasonal patterns of bait loss at each of the five sites along the gradient; darker symbols represent higher-salinity sites. (b) Bait loss plotted against salinity at time of deployment. Trend lines are calculated separately for each month, and squid loss data are standardized by dividing by the maximum value recorded during that month. Bait loss increased significantly with salinity (P < 0.001) based on a generalized linear mixed effects model.

References

    1. Elser J, Bracken M, Cleland E, Gruner D, Harpole W, Hillebrand H, et al. (2007) Global analysis of nitrogen and phosphorus limitation of primary producers in freshwater, marine and terrestrial ecosystems. Ecol Letters 10: 1135–1142. - PubMed
    1. Field C, Behrenfeld M, Randerson J, Falkowski P (1998) Primary production of the biosphere: integrating terrestrial and oceanic components. Science 281: 237–240. - PubMed
    1. Vitousek PM, Howarth RW (1991) Nitrogen limitation on land and in the sea: how can it occur? Biogeochemistry 13: 87–115.
    1. Running SW, Nemani RR, Heinsch FA (2004) A continuous satellite-derived measure of global terrestrial primary production. BioScience 54: 547–560.
    1. Behrenfeld MJ, O’malley RT, Siegel DA, Mcclain CR, Sarmiento JL, Feldman GC et al. (2006) Climate-driven trends in contemporary ocean productivity. Nature 444: 752–755. 10.1038/nature05317 - DOI - PubMed

Publication types

LinkOut - more resources