. 2015 Nov 24;10(11):e0143243.
doi: 10.1371/journal.pone.0143243. eCollection 2015.

High-Throughput Screening of Myometrial Calcium-Mobilization to Identify Modulators of Uterine Contractility

Affiliations

High-Throughput Screening of Myometrial Calcium-Mobilization to Identify Modulators of Uterine Contractility

Jennifer L Herington et al. PLoS One. .

Abstract

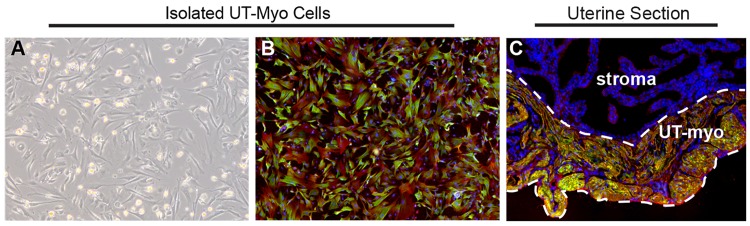
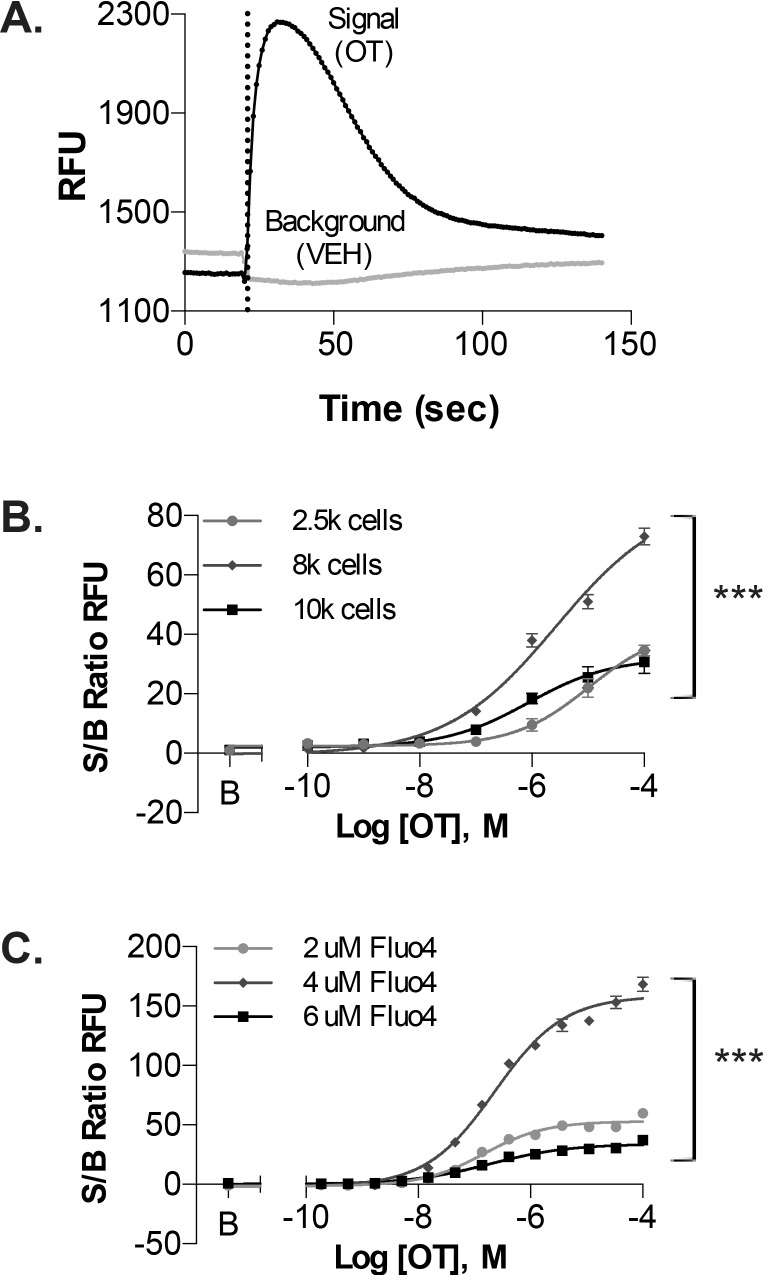
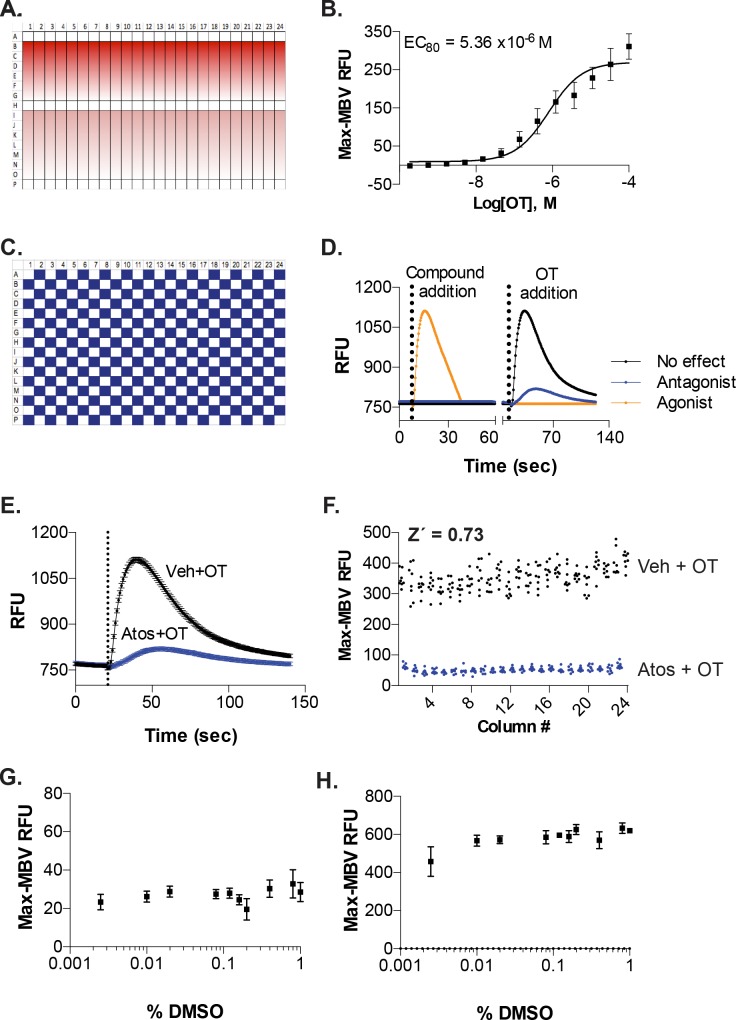
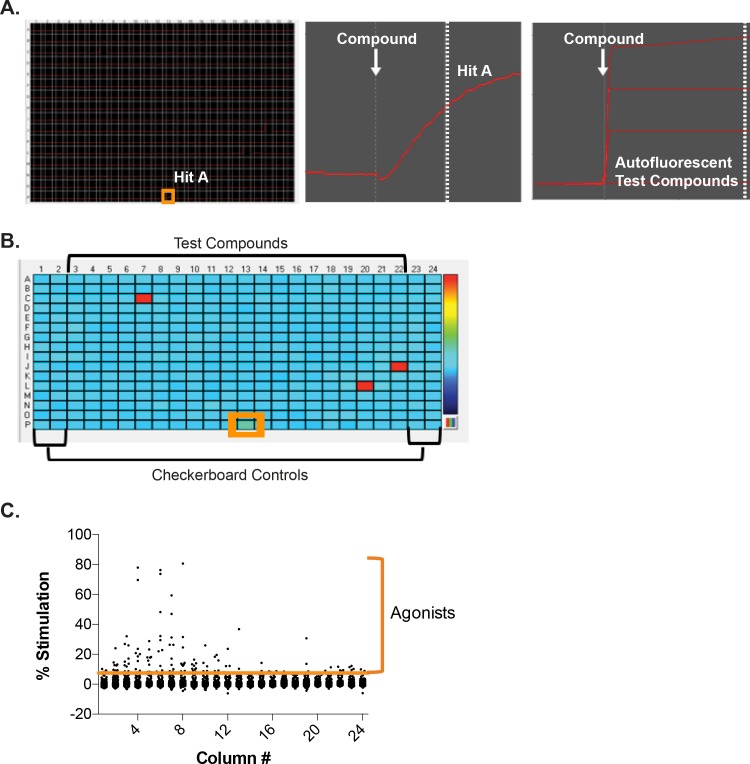
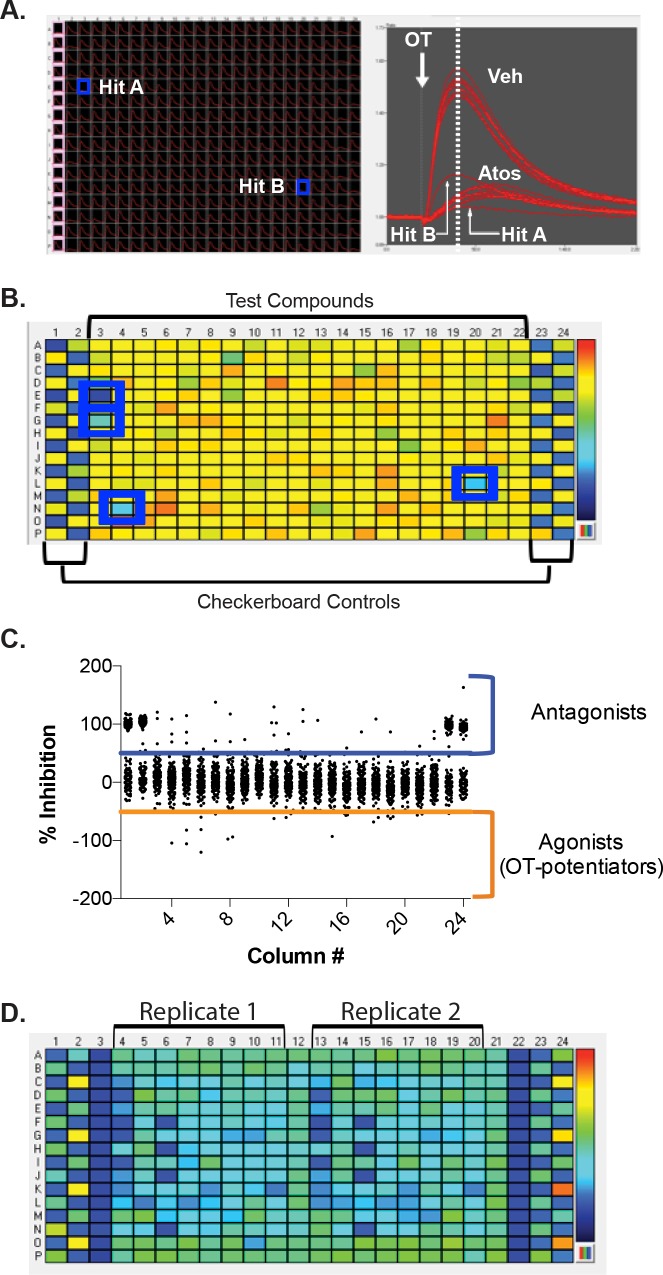
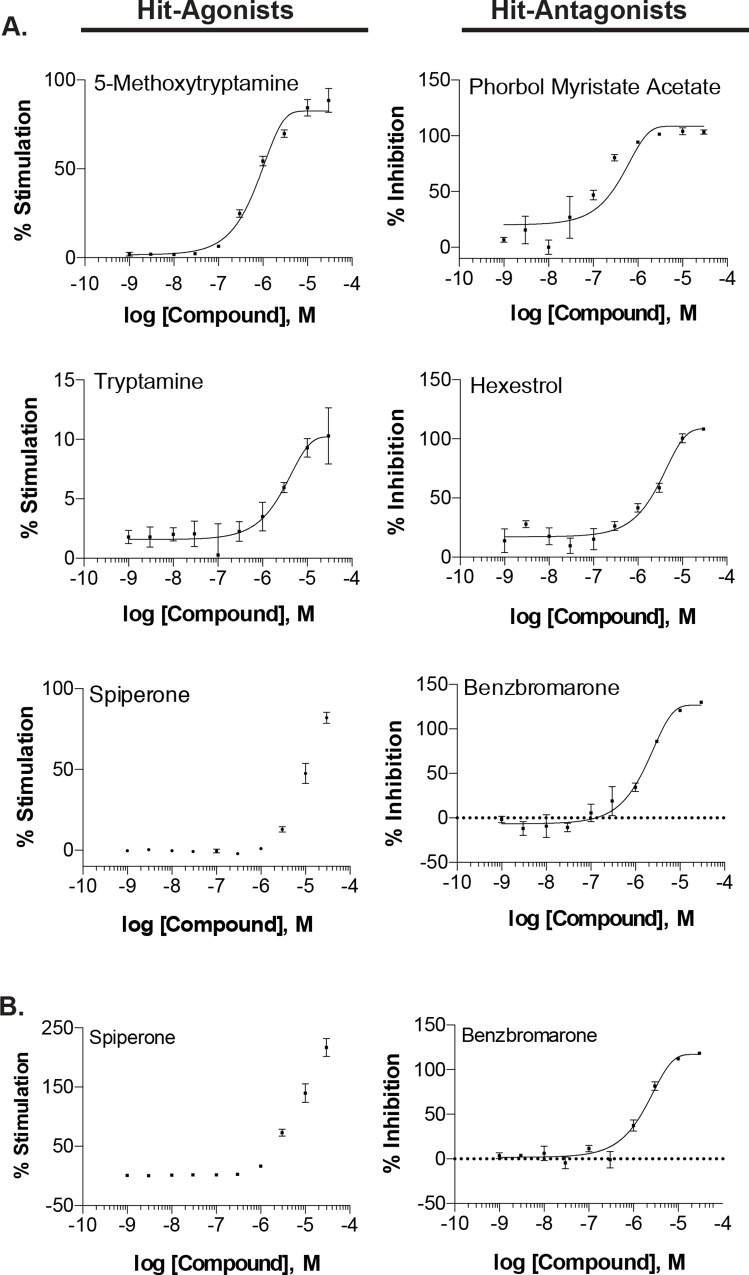
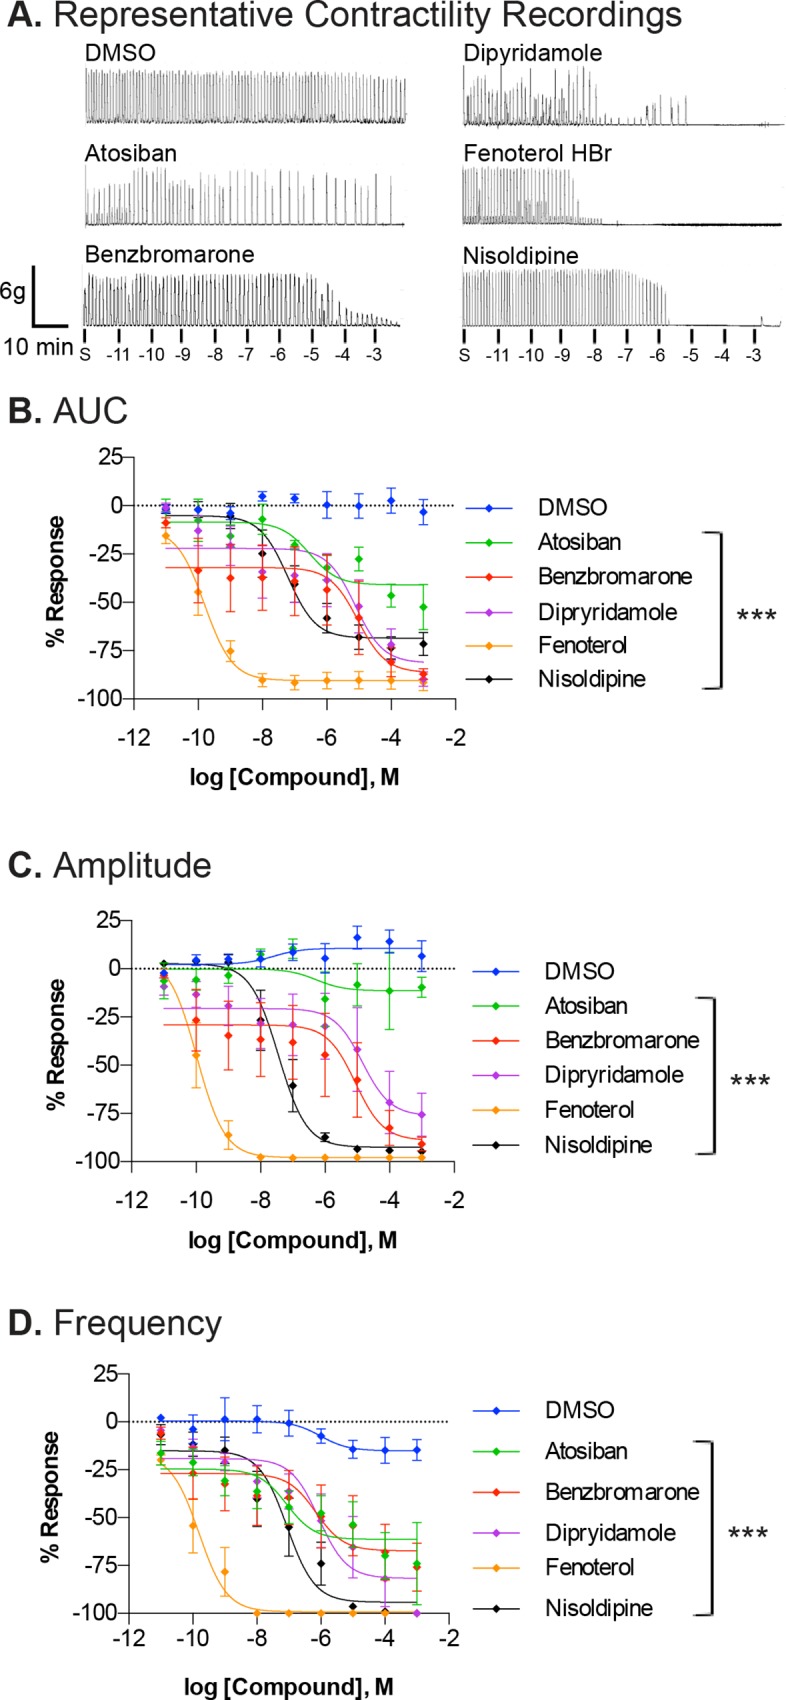
The uterine myometrium (UT-myo) is a therapeutic target for preterm labor, labor induction, and postpartum hemorrhage. Stimulation of intracellular Ca2+-release in UT-myo cells by oxytocin is a final pathway controlling myometrial contractions. The goal of this study was to develop a dual-addition assay for high-throughput screening of small molecular compounds, which could regulate Ca2+-mobilization in UT-myo cells, and hence, myometrial contractions. Primary murine UT-myo cells in 384-well plates were loaded with a Ca2+-sensitive fluorescent probe, and then screened for inducers of Ca2+-mobilization and inhibitors of oxytocin-induced Ca2+-mobilization. The assay exhibited robust screening statistics (Z´ = 0.73), DMSO-tolerance, and was validated for high-throughput screening against 2,727 small molecules from the Spectrum, NIH Clinical I and II collections of well-annotated compounds. The screen revealed a hit-rate of 1.80% for agonist and 1.39% for antagonist compounds. Concentration-dependent responses of hit-compounds demonstrated an EC50 less than 10μM for 21 hit-antagonist compounds, compared to only 7 hit-agonist compounds. Subsequent studies focused on hit-antagonist compounds. Based on the percent inhibition and functional annotation analyses, we selected 4 confirmed hit-antagonist compounds (benzbromarone, dipyridamole, fenoterol hydrobromide and nisoldipine) for further analysis. Using an ex vivo isometric contractility assay, each compound significantly inhibited uterine contractility, at different potencies (IC50). Overall, these results demonstrate for the first time that high-throughput small-molecules screening of myometrial Ca2+-mobilization is an ideal primary approach for discovering modulators of uterine contractility.


Conflict of interest statement

Competing Interests: The authors have declared that no competing interests exist.

Figures

Fig 1
Fig 1. Assessment of primary murine UT-myo cell homogeneity.
A. Representative photomicrograph of UT-myo cells prior to dissociation and use in Ca2+-mobilization or immunofluorescent staining. Representative photomicrograph of UT-myo cells (B) and uterine myometrium (C) stained with smooth muscle cell markers, alpha-SMA (red) and calponin (green), and DAPI (blue). UT-myo cells and whole-mount uterine tissue were collected from day 19 of mouse pregnancy. The placenta and embryo were removed from whole-mount tissue sections.
Fig 2
Fig 2. Ca2+-mobilization assay using uterine myometrial cells.
A. Representative recording of OT-induced Ca2+-mobilization from UT-myo cells loaded with Fluo-4AM. Ca2+-mobilization was monitored as an increase in Relative Fluorescent Units (RFUs). Dashed line indicates time of OT or vehicle (VEH) addition. Optimal assay conditions were determined by performing cell density gradient (B) and Fluo-4AM concentration response curves (C), from signal-to-background (S/B) ratios of Max-Min RFU obtained from OT and VEH wells, respectively. Non-linear regression was used to fit the data (Mean±SEM; n = 8 well replicates); significant (***p<0.0001) difference between each fit line.
Fig 3
Fig 3. Assay automation and determination of suitability for HTS.
A. Platemap used for CRCs performed for OT-induced Ca2+-mobilization from UT-myo cells. B. Mean OT CRC from all Ca2+-mobilization assays performed for checkerboard analysis and pilot screen (n = 7 independent experiments (batches of primary mouse UT-myo cells) performed in quadruplicate). OT CRCs were used to calculate the OT-EC80 for each day of the checkerboard analyses. Mean ± SEM OT EC80 is shown. C. Platemap used to perform checkerboard analyses. Every other well received either 0.1% DMSO (final concentration vehicle, white boxes) or 10μM atosiban (blue boxes) for 30 min prior to the addition of OT (EC80) to the entire plate. D. Dual-addition assay format for the identification of agonists and antagonists of Ca2+-mobilization from UT-myo cells from a single HTS screen. Compound addition (either atosiban or vehicle) followed by 30min incubation at room temperature, then OT addition. E. Representative graph showing the response of UT-myo cells to either vehicle (Veh) or atosiban (Atos) prior to OT-induced Ca2+-mobilization. F. The Z´-factor was calculated from checkerboard analyses performed on three separate days. Tolerance of UT-myo cells to the compound solvent, DMSO, added during the “compound addition” (G) prior to OT-induced Ca2+-mobilization (H).
Fig 4
Fig 4. Hit-agonist identification during pilot screen.
A, left panel. Representative image of realtime monitoring of Ca2+-mobilization from UT-myo cells following the compound addition (white arrow, middle panel). The two end columns of each plate were used for checkerboard analyses to determine the Z´-factor for each HTS assay, and received either 0.1% DMSO vehicle or 10uM atosiban during the compound addition. The inner 320 wells received 10μM of test compounds. An example of a “Hit”-agonist is highlighted (orange box). A, right panel. Examples of relative fluorescent recordings from autofluorescent test compounds. B. Plate heatmap of Ca2+-mobilization at the time following compound addition (dashed line, middle panel A). A representative hit-agonist compound (green well) is highlighted by orange box, while autofluorescent compounds are visualized as bright red wells. C. The average cutoff threshold for hit-agonists was 5.85±1.59% stimulation, based on 3*MAD from median (refer to “Materials and Methods” section).
Fig 5
Fig 5. Hit-antagonist identification during pilot screen and confirmation after retesting.
A, left panel. Realtime monitoring of OT-induced Ca2+-mobilization from UT-myo cells. The two end columns (one highlighted in pink) of each plate were used for checkerboard analyses to determine the Z´-factor for each HTS assay. Examples of “Hit”-antagonists are highlighted (blue boxes). A, right panel. OT-induced Ca2+-mobilization of highlighted wells. White arrow indicates the time of OT addition. B. Plate heatmap of Ca2+-mobilization at the time indicated by the dashed line (right panel A). Representative hit-antagonist compounds are highlighted by blue boxes. C. The average cutoff threshold based on 3*MAD from median (refer to “Materials and Methods” section) for “hit”-antagonists was 41.07±3.79% inhibition and “hit”-agonists (OT-potentiators) was 50.02±4.77% activation. D. Representative heatmap of additional Ca2-mobilization assays performed to retest hit-agonists and antagonists in duplicate. Veh = vehicle, Atos = atosiban
Fig 6
Fig 6. Concentration-response effect of confirmed hit-compounds.
A. Representative compound titrations performed to examine the potency of confirmed hit-agonists and hit-antagonists on UT-myo native and OT-induced Ca2+-mobilization. B. Additionally, compound titrations for hit-compounds were performed using commercially purchased compounds. A 10-point three-fold titration of confirmed hit-compounds were added during the compound addition of the Ca2+-mobilization assay. Data is shown as either mean±SEM %stimulation of Ca2+-mobilization or %inhibition of OT-induced Ca2+-mobilization. Non-linear regression was used to fit the data.
Fig 7
Fig 7. Effect of confirmed hit-compounds on ex vivo uterine myometrial contractility.
A. Representative recordings of spontaneous contractile activity prior to treatment with increasing concentrations (10pm to 1mM) of either DMSO (vehicle control), atosiban, benzbromarone, dipyridamole, fenoterol HBr or nisoldipine. Isometric tension recordings were analyzed for AUC (B), amplitude (C) and frequency (D) of contractions. Data is shown as mean±SEM % response from baseline (spontaneous contraction) from 5–8 different uterine strips from different mice. Non-linear regression was used to fit the data. Significant (***p<0.0001) difference between each fit line and DMSO is indicated. S = spontaneous contractility

Similar articles

Cited by

References

    1. Norwitz ER, Robinson JN, Challis JR. The control of labor. N Engl J Med. 1999;341(9):660–6. Epub 1999/08/26. 10.1056/NEJM199908263410906 . - DOI - PubMed
    1. Giles W, Bisits A. Preterm labour. The present and future of tocolysis. Best Pract Res Clin Obstet Gynaecol. 2007;21(5):857–68. Epub 2007/04/27. 10.1016/j.bpobgyn.2007.03.011 . - DOI - PubMed
    1. de Heus R, Mol BW, Erwich JJ, van Geijn HP, Gyselaers WJ, Hanssens M, et al. Adverse drug reactions to tocolytic treatment for preterm labour: prospective cohort study. BMJ. 2009;338:b744 Epub 2009/03/07. 10.1136/bmj.b744 - DOI - PMC - PubMed
    1. Yasuda K, Nakamoto T, Yasuhara M, Okada H, Nakajima T, Kanzaki H, et al. Role of protein kinase Cbeta in rhythmic contractions of human pregnant myometrium. Reproduction. 2007;133(4):797–806. Epub 2007/05/17. 10.1530/REP-06-0041 . - DOI - PubMed
    1. Shynlova O, Tsui P, Jaffer S, Lye SJ. Integration of endocrine and mechanical signals in the regulation of myometrial functions during pregnancy and labour. Eur J Obstet Gynecol Reprod Biol. 2009;144 Suppl 1:S2–10. Epub 2009/03/21. 10.1016/j.ejogrb.2009.02.044 . - DOI - PubMed

Publication types

MeSH terms