Review
. 2015:2015:101029.
doi: 10.1155/2015/101029. Epub 2015 Oct 12.

Imaging Diagnosis of Splanchnic Venous Thrombosis

Affiliations
Review

Imaging Diagnosis of Splanchnic Venous Thrombosis

S Rajesh et al. Gastroenterol Res Pract. 2015.

Abstract

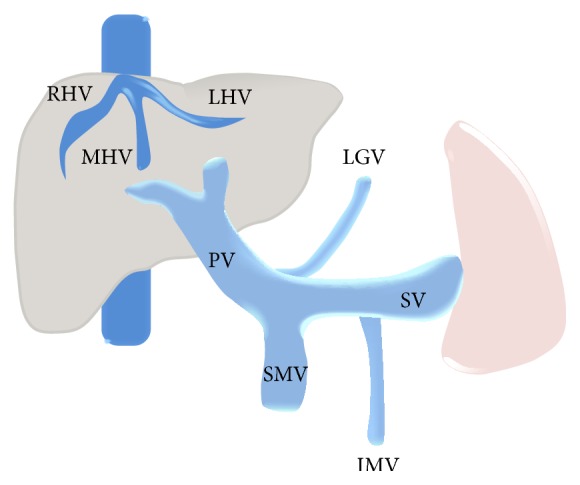
Splanchnic vein thrombosis (SVT) is a broad term that includes Budd-Chiari syndrome and occlusion of veins that constitute the portal venous system. Due to the common risk factors involved in the pathogenesis of these clinically distinct disorders, concurrent involvement of two different regions is quite common. In acute and subacute SVT, the symptoms may overlap with a variety of other abdominal emergencies while in chronic SVT, the extent of portal hypertension and its attendant complications determine the clinical course. As a result, clinical diagnosis is often difficult and is frequently reliant on imaging. Tremendous improvements in vascular imaging in recent years have ensured that this once rare entity is being increasingly detected. Treatment of acute SVT requires immediate anticoagulation. Transcatheter thrombolysis or transjugular intrahepatic portosystemic shunt is used in the event of clinical deterioration. In cases with peritonitis, immediate laparotomy and bowel resection may be required for irreversible bowel ischemia. In chronic SVT, the underlying cause should be identified and treated. The imaging manifestations of the clinical syndromes resulting from SVT are comprehensively discussed here along with a brief review of the relevant clinical features and therapeutic approach.


Figures

Figure 1
Figure 1
Graphic illustration of the splanchnic venous system. RHV: right hepatic vein, MHV: middle hepatic vein, LHV: left hepatic vein, PV: portal vein, SMV: superior mesenteric vein, SV: splenic vein, LGV: left gastric vein, and IMV: inferior mesenteric vein.
Figure 2
Figure 2
Gray-scale US image demonstrating homogeneously hypoechoic and bulbous liver with chinked portal venous radicals (arrows) in a patient with fulminant BCS.
Figure 3
Figure 3
Gray-scale image from the US study of a patient with BCS due to obstruction of the common channel of the middle and the left hepatic veins (arrow) showing a more heterogeneous hepatic parenchymal echotexture. Collateral channel can be seen bridging the two hepatic veins proximal to obstruction (interrupted arrow).
Figure 4
Figure 4
Noncontrast-enhanced axial CT scan image showing a diffusely hypodense liver in this patient with acute thrombosis of all the three hepatic veins. On careful inspection, the right and middle hepatic veins can be made out as mildly hyperdense structures (arrows) on the background of this hypodense liver. Ascites can also be seen on this section (asterisk).
Figure 5
Figure 5
Axial CECT image acquired in the portal venous phase showing enhancement of the caudate lobe (asterisk) while rest of the liver parenchyma in the periphery remains predominantly hypoenhancing. Thrombosed right and middle hepatic veins (white arrows) and IVC (black arrow) can also be seen.
Figure 6
Figure 6
Coronal (a) and axial (b) portal venous phase CECT image showing thrombosed right hepatic vein (arrows) and the part of the intrahepatic portion of IVC (arrowheads) with mottled enhancement of the liver parenchyma and ascites.
Figure 7
Figure 7
Axial CECT images from two different patients with chronic BCS demonstrating markedly hypertrophied caudate lobe (asterisk).
Figure 8
Figure 8
Axial images from the CECT scan of two different patients with chronic BCS demonstrating cirrhotic architecture of liver in the form of irregular lobulated outlines and heterogeneous mottled hepatic parenchymal enhancement. Ascites (asterisks in (a)), splenomegaly (asterisk in (b)) and paraesophageal and perisplenic collaterals (arrow in (a) and (b), resp.) can also be seen.
Figure 9
Figure 9
Axial CECT images acquired in the arterial (a) and venous (b) phase showing an arterial phase enhancing nodule (arrow in (a)) in liver which retains the contrast in the venous phase (arrow in (b)) consistent with regenerative nodule in this patient who had undergone direct intrahepatic portocaval shunt (DIPS) for BCS.
Figure 10
Figure 10
Gray-scale US images from two different patients demonstrating echogenic thrombus within the right hepatic vein (arrows).
Figure 11
Figure 11
Gray-scale US image demonstrating stenosis at the ostium of right hepatic vein (black arrow) with multiple intrahepatic collaterals (white arrows) and heterogeneous hepatic echotexture.
Figure 12
Figure 12
Gray-scale US image demonstrating stenosis at the ostium of right hepatic vein (long white arrow in (a)) and the common channel of middle and left hepatic vein (arrow in (b)) with multiple intrahepatic collaterals (small white arrows in (a)).
Figure 13
Figure 13
Gray-scale US image showing the distal portion of right hepatic vein (marked by calipers) being reduced to a cord-like structure due to chronic thrombosis.
Figure 14
Figure 14
Spectral Doppler image posthepatic vein stenting demonstrates restoration of normal triphasic waveform (inverted “M” shape) of the right hepatic vein in a patient with BCS. Arrow denotes the stent in the right hepatic vein.
Figure 15
Figure 15
Spectral Doppler image in a patient with BCS shows monophasic waveform in the hepatic vein.
Figure 16
Figure 16
Coronal CECT (a) and gray-scale US (b) image demonstrating compression of intrahepatic IVC (arrows) caused by hypertrophy of the caudate lobe.
Figure 17
Figure 17
Gray-scale US image demonstrating echogenic thrombus in IVC (arrow).
Figure 18
Figure 18
Gray-scale US (a) and coronal MIP (b) images demonstrating an IVC web (sequel of chronic focal thrombosis) which appears as a linear echogenic structure on US (arrow in (a)), while on CT, it appears as an intraluminal hypodense linear structure (arrow in (b)).
Figure 19
Figure 19
Coronal CECT image (a) showing an IVC web (arrow). IVC angiogram (b) of the same patient showing a jet of contrast (arrow) entering the right atrium signifying the obstruction caused by the web. Postangioplasty image (c) shows resolution of the stenosis.
Figure 20
Figure 20
Axial CECT image demonstrating a web in the left hepatic vein (arrow) with heterogeneous hepatic parenchymal enhancement.
Figure 21
Figure 21
Coronal CECT images demonstrating mural calcification involving the IVC (long thin black arrows in (a) and (b)) secondary to chronic thrombosis. Multiple superficial abdominal wall and paraesophageal collaterals (white arrows and short thick black arrow, resp.) along with a prominent accessory vein (arrowhead) can also be seen.
Figure 22
Figure 22
Prominent caudate lobe vein (marked by calipers; measuring 7 mm) in setting of BCS.
Figure 23
Figure 23
Thrombosed middle and left hepatic veins appearing as hypodense nonenhancing structures (arrows) on a background of heterogeneous liver parenchyma and ascites (asterisk).
Figure 24
Figure 24
Gray-scale US images demonstrating thrombosed distal portion of right hepatic vein (arrow in (a)) with a typical comma-shaped venovenous collateral (arrow in (b)).
Figure 25
Figure 25
Other examples of comma-shaped collaterals (arrows) on US.
Figure 26
Figure 26
Axial CECT images from four different patients demonstrating comma-shaped intrahepatic collaterals (arrows) demonstrating varying degrees of patency.
Figure 27
Figure 27
Secondary BCS in two different patients. (a) Axial maximum-intensity-projection (MIP) CECT image in a patient with past history of blunt trauma to the abdomen demonstrating a liver laceration (arrows) which had caused thrombosis of the middle hepatic vein with resultant comma-shaped intrahepatic venovenous collateral (arrowheads) between the left hepatic vein and the remnant middle hepatic vein. (b) Axial MIP image from the CECT scan of a young woman with hydatid cyst of liver (asterisk) causing thrombosis of the right hepatic vein and formation of intrahepatic collateral (arrowheads) between the middle and right hepatic vein.
Figure 28
Figure 28
Spider web pattern of collaterals in BCS on catheter angiography.
Figure 29
Figure 29
Axial (a) and coronal (b) MIP images showing multiple abdominal wall collaterals in a patient with IVC thrombus.
Figure 30
Figure 30
Angiogram performed via a catheter inserted in the left hepatic vein demonstrates drainage through the inferior phrenic vein (vertical arrow in (a)) and pericardiophrenic collateral (horizontal arrow) with delayed opacification of the intercostal veins as well (vertical arrows in (b)).
Figure 31
Figure 31
IVC angiogram demonstrating opacification of the intervertebral venous plexus and hemiazygous vein (arrow).
Figure 32
Figure 32
Classification of PVT proposed by Yerdel et al.
Figure 33
Figure 33
Gray-scale US image showing thrombosed left portal vein (arrow in (a)). On application of colour Doppler (b), hypertrophy of the accompanying branch of hepatic artery can be seen (black arrow in (b)) with opening up of periportal collateral venous channels (white arrow).
Figure 34
Figure 34
Side-by-side contrast-enhanced US (a) and gray-scale image (b) demonstrating absence of enhancement of the portal vein thrombus in the arterial phase (arrow in (a)) signifying benign nature of the thrombus.
Figure 35
Figure 35
Axial NCCT (a) and CECT (b) images demonstrating mildly hyperdense thrombus occluding the main portal vein (arrows). Corresponding images at a caudal level in the same patient showing hyperdense thrombus in the SMV with associated fat stranding in the adjoining mesentery.
Figure 36
Figure 36
Axial CECT images obtained in the arterial (a) and venous (b) phases showing an abscess in the left lobe (asterisk) which had caused acute thrombosis of the left portal vein (pylephlebitis). Associated hepatic artery buffer response is seen in the form of increased enhancement of the left hepatic lobe in the arterial phase (arrows in (a)) which becomes essentially isodense on the portal venous phase.
Figure 37
Figure 37
Coronal oblique CECT image of a patient with acute necrotizing pancreatitis demonstrates thrombosed splenic vein (thick white arrows) and a segmental branch of right portal vein (thin white arrow) with hepatic artery buffer response in the form of differential hyperenhancement of the affected liver segment (black arrows).
Figure 38
Figure 38
Coronal oblique CECT image demonstrating thrombosed portal vein as well as the SMV (arrows) with rim-enhancement of their walls.
Figure 39
Figure 39
Axial T2-weighted MR image demonstrating mildly hyperintense thrombus (arrow) in the right portal vein.
Figure 40
Figure 40
(a) Axial T2-weighted fat saturated image in a patient with liver cirrhosis and multifocal hepatocellular carcinoma showing occlusive heterogeneously hyperintense tumor thrombus (asterisk and arrows) expanding the right portal vein. It shows diffusion restriction (asterisk and arrows in (b)). One of the tumoral masses can also be seen on this image (thick arrow).
Figure 41
Figure 41
Axial CEMRI images obtained in the arterial (a) and venous (b) phases showing a lobulated lesion showing arterial phase enhancement (asterisk in (a)) with washout of contrast on the venous phase. Associated enhancing right portal vein tumor thrombus (arrows) is present.
Figure 42
Figure 42
Axial MIP image showing a severely attenuated and partially calcified retropancreatic splenic vein (interrupted arrows) resulting in formation of a prominent gastroepiploic collateral channel (arrowheads) between the SMV and the remnant splenic vein at splenic hilum (solid arrow) along the greater curvature of stomach. Asterisk denotes the gastric lumen.
Figure 43
Figure 43
Gray-scale US (a) image showing replacement of the main portal vein by an ill-defined echogenic area containing multiple subtle anechoic tubular structures. On application of colour Doppler (b) turbulent flow can be seen within these anechoic structures consistent with portal cavernoma.
Figure 44
Figure 44
Graphic illustration demonstrating opening up of epi- and paracholedochal venous collaterals in chronic PVT causing portal biliopathy.
Figure 45
Figure 45
Coronal oblique CECT image (a) showing multiple paracholedochal collaterals (solid black arrows) causing extrinsic compression over the CBD (interrupted arrow). (b) 2D MRCP image of the same patient demonstrating undulating margins of CBD (arrow) due to the compression.
Figure 46
Figure 46
(a) Thick-slab 3D MRCP image of a patient with portal biliopathy demonstrating extrinsic vascular impression over CBD by the paracholedochal collaterals (solid arrows). The distal CBD is narrowed by these collaterals with resultant upstream biliary dilatation. Undulating margins of biliary system can also be seen (interrupted arrow) with a grossly distended gall bladder. (b) 3D MRCP image from another patient showing wavy contour of the mid- and distal CBD due to portal biliopathy with resultant narrowing and gross bilobar biliary dilatation.
Figure 47
Figure 47
Coronal oblique CECT image showing chronic, partially calcified, occlusive thrombus involving the main portal vein (black arrow) with multiple tortuous periportal collateral channels (solid white arrows). Splenic vein is also partially thrombosed (asterisk). Gall bladder calculi (interrupted arrow) and ascites can also be seen.
Figure 48
Figure 48
Axial CECT image of a patient with EHPVO showing multiple tiny paracholedochal collaterals appearing as continuous enhancement of one of the biliary radicals in right hepatic lobe (arrows) mimicking cholangiocarcinoma (pseudocholangiocarcinoma sign). Splenic infarct is also seen due to associated splenic vein thrombosis (interrupted arrow) along with ascites (asterisk).
Figure 49
Figure 49
Axial (a) and coronal (b) MIP images of a patient with liver cirrhosis and multifocal hepatocellular carcinoma demonstrating multiple thin streaks of arterial phase enhancement within the main portal vein (arrows in (b)) as well as its intrahepatic branches (arrows in (a)) consistent with tumor thrombus (threads-and-streaks sign).
Figure 50
Figure 50
Coronal MIP image showing complete portomesenteric vein thrombosis (black arrows) with associated mesenteric stranding (white arrows).
Figure 51
Figure 51
Axial NCCT image showing submucosal bowel wall hemorrhage appearing as linear hyperdense rim (solid arrows). Small bowel dilatation (asterisk) and pneumatosis intestinalis (interrupted arrow) can also be seen.
Figure 52
Figure 52
Axial CECT image demonstrating halo sign in one of the jejunal loops due to inner mucosal and outer muscularis propria rings of high attenuation separated by submucosal layer of low attenuation representing edema in a patient with SMV thrombosis. Extensive mesenteric stranding and minimal ascites can also be seen.
Figure 53
Figure 53
Axial CECT image showing nonenhancing loop of jejunum (arrow) due to SMV thrombosis.
Figure 54
Figure 54
Axial CECT image showing nondependent focus of portal venous gas (arrow) with mesenteric stranding and ascites.
Box 1
Box 1
Causes of BCS.
Box 2
Box 2
Classification of BCS based on the level of obstruction.
Box 3
Box 3
Different types of collateral pathways described in association with BCS (Figures 24 –31).
Box 4
Box 4
Causes of portomesenteric venous thrombosis.

References

    1. de Stefano V., Martinelli I. Splanchnic vein thrombosis: clinical presentation, risk factors and treatment. Internal and Emergency Medicine. 2010;5(6):487–494. doi: 10.1007/s11739-010-0413-6. - DOI - PubMed
    1. de Stefano V., Za T., Ciminello A., Betti L., Rossi E. Causes of adult splanchnic vein thrombosis in the mediterranean area. Mediterranean Journal of Hematology and Infectious Diseases. 2011;3(1) doi: 10.4084/mjhid.2011.063.e2011063 - DOI - PMC - PubMed
    1. Janssen H. L. A., Garcia-Pagan J.-C., Elias E., Mentha G., Hadengue A., Valla D.-C. Budd-Chiari syndrome: a review by an expert panel. Journal of Hepatology. 2003;38(3):364–371. doi: 10.1016/s0168-8278(02)00434-8. - DOI - PubMed
    1. Valla D.-C. Primary Budd-Chiari syndrome. Journal of Hepatology. 2009;50(1):195–203. doi: 10.1016/j.jhep.2008.10.007. - DOI - PubMed
    1. Valla D. Hepatic venous outflow tract obstruction etipathogenesis: Asia versus the West. Journal of Gastroenterology and Hepatology. 2004;19, supplement:204–211.

LinkOut - more resources