. 2015 Nov 6;1(10):e1500845.
doi: 10.1126/sciadv.1500845. eCollection 2015 Nov.

The PTEN pathway in Tregs is a critical driver of the suppressive tumor microenvironment

Affiliations

The PTEN pathway in Tregs is a critical driver of the suppressive tumor microenvironment

Madhav D Sharma et al. Sci Adv. .

Abstract

The tumor microenvironment is profoundly immunosuppressive. We show that multiple tumor types create intratumoral immune suppression driven by a specialized form of regulatory T cell (Treg) activation dependent on the PTEN (phosphatase and tensin homolog) lipid phosphatase. PTEN acted to stabilize Tregs in tumors, preventing them from reprogramming into inflammatory effector cells. In mice with a Treg-specific deletion of PTEN, tumors grew slowly, were inflamed, and could not create an immunosuppressive tumor microenvironment. In normal mice, exposure to apoptotic tumor cells rapidly elicited PTEN-expressing Tregs, and PTEN-deficient mice were unable to maintain tolerance to apoptotic cells. In wild-type mice with large established tumors, pharmacologic inhibition of PTEN after chemotherapy or immunotherapy profoundly reconfigured the tumor microenvironment, changing it from a suppressive to an inflammatory milieu, and tumors underwent rapid regression. Thus, the immunosuppressive milieu in tumors must be actively maintained, and tumors become susceptible to immune attack if the PTEN pathway in Tregs is disrupted.

Keywords: PTEN; Regulatory T cells; Tregs; indoleamine 2,3-dioxygenase; tumor immunology; tumor microenvironment.


Figures

Fig. 1
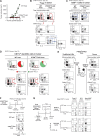
Fig. 1. PTEN is required to maintain IDO-induced Treg activation.
(A) Analysis of peripheral Tregs from LNs of normal mice without tumor or from TDLNs and tumor of mice with B16F10 tumors, gated on CD4+Foxp3+ Tregs. (B) Proposed model for regulation of Akt by IDO and the PD-1→PTEN pathway during Treg activation, based on data from figs. S2 to S8. (C and D) Tregs from PTENTreg-KO mice or wild-type (WT) controls were activated in vitro for 2 days with IDO+ DCs from TDLNs, using the coculture system described in fig. S2A. (C) Tregs were analyzed for phosphorylation of Akt by FACS at the end of activation. (D) After activation, Tregs were re-sorted and tested in readout assays for their ability to maintain FoxO3a and PD-1. (E) PTENTreg-KO Tregs or WT (parental) control Tregs were activated either with IDO+ DCs from TDLNs or using conventional anti-CD3 mitogen with IDO blocked. After 2 days, Tregs were re-sorted and tested in readout assays for functional suppressor activity, as in fig. S2A. Each point is the mean of triplicate cocultures; error bars show SD (most are less than ±5%, smaller than the symbols). *P < 0.01 by analysis of variance (ANOVA) versus PD-1/L blockade (all other groups not significant versus PD-1/L blockade). (F and G) WT Tregs were activated with either IDO+ TDLN DCs or conventional αCD3 mitogen and then sorted and tested for functional suppressor activity (F) in the presence of PTEN inhibitor VO-OHpic. Mean of triplicate cocultures; SD bars are smaller than the symbols; *P < 0.01 by ANOVA versus no VO-OHpic. (G) In parallel experiments, the re-sorted Tregs were recovered at the end of the suppression assay and assessed for their level of Akt phosphorylation and detectable FoxO3a expression by FACS. Panels are representative of three to five independent experiments each.
Fig. 2
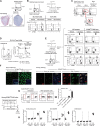
Fig. 2. Tumors in PTENTreg-KO hosts lose the ability to create a suppressive intratumoral milieu.
(A) Growth of B16F10 tumors in PTENTreg-KO hosts and WT B6 hosts. Pooled data from four experiments, n = 6 to 8 tumors per time point. *P < 0.05 versus WT, and all points thereafter. (B to D) Analysis of tumor-infiltrating immune cells in B16F10 tumors after 10 days of tumor growth in either PTENTreg-KO or parental Foxp3-GFP-Cre hosts: (B) Tregs, (C) CD8+ T cells, and (D) CD11c+ DCs. Representative of a total of nine experiments on days 10, 15, and 22. Intracellular cytokines were measured after 4 hours of activation with phorbol 12-myristate 13-acetate (PMA)/ionomycin. (E) Tumors were implanted on one side of PTENTreg-KO hosts; then, on day 14, the phenotype of T cells and DCs within the tumor was compared with pooled contralateral LNs, distant from the tumor. (F) Carboxyfluorescein diacetate succinimidyl ester (CFSE)–labeled pmel-1 cells, recognizing tumor-associated gp100, were transferred into WT or PTENTreg-KO hosts after a single dose of cyclophosphamide (CTX) to release tumor antigens. (G) PTENTreg-KO hosts or WT controls were implanted with B16F10 tumors or B16-OVA tumors bearing a nominal antigen. Mice then received a mixture of two CFSE-labeled responder cells: pmel-1 recognizing gp100 and OT-I recognizing OVA. Mice were then vaccinated against only the gp100 antigen, and tumors were analyzed 4 days later for evidence of epitope spreading (OT-I activation). (E) to (G) are representative of at least three experiments each.
Fig. 3
Fig. 3. Vaccination drives rapid reconfiguration of the suppressive tumor microenvironment when PTEN is blocked.
(A and B) WT C57Bl/6 mice with established B16F10 tumors (A) or E.G7 tumors (B) were treated with tumor-specific T cells (pmel-1 or OT-I) plus cognate vaccine, with or without VO-OHpic [10 mg kg−1 day−1 intraperitoneally (ip)] as indicated. Each curve represents pooled data from a total of 6 to 22 tumors in three to five independent experiments, measured serially. *P < 0.01 versus all other curves by ANOVA. (C) B16F10 tumors received vaccine and pmel-1 cells as in (A), with or without either VO-OHpic or CAL-101 (PI3K-δ inhibitor, 30 mg kg−1 day−1 ip). Tumors were harvested 4 days after vaccine and stained for Akt phosphorylation in gated GFP+ Tregs and for evidence of Treg destabilization and reprogramming. Representative of five experiments. (D) Effect of VO-OHpic on intratumoral OT-I responses and activation of tumor-associated DCs in mice with E.G7 tumors, treated with OT-I/vaccine as in (B), with or without VO-OHpic. Similar results were seen using B16F10 with pmel-1/hgp100 vaccine. (E) Requirement for both VO-OHpic and activated OT-I/vaccine to successfully drive Treg destabilization and DC activation in established E.G7 tumors. (D) and (E) are representative of at least three experiments each.
Fig. 4
Fig. 4. The PTEN pathway in Tregs is required to suppress immune responses to apoptotic cells.
(A to D) Normal mice without tumors received footpad injection of dying EL4 tumor cells (treated for 3 hours in vitro with staurosporine to induce apoptosis). (A) After 48 hours, DLNs and unaffected contralateral LNs (CLNs) were stained for IDO (red chromogen). (B) OT-I response to cell-associated antigen from apoptotic EL4-OVA (E.G7) cells, or parental EL4 controls, with or without treatment in vivo with the IDO inhibitor drug in drinking water. (C) After apoptotic cell injection, Foxp3+ Tregs were compared in DLNs versus control distant CLNs for activation of pten-Tregs, with or without IDO inhibitor (indoximod). (D) Two days after challenge with apoptotic cells, Tregs were sorted from DLNs (or control LNs without injection) and directly tested ex vivo for constitutive suppressor activity, as described in fig. S2A, with or without PD-1/L blockade in the readout assay. Each point is the mean of triplicate cocultures; bars show SD (all are less than ±5%, smaller than the symbols). (E) Effect of PTEN inhibitor (VO-OHpic) on the immune response to apoptotic EL4-OVA cells (E.G7). Responses were compared in WT (parental) hosts and PTENTreg-KO hosts, with and without VO-OHpic. (F) Old mice (1- to 2-year-old retired breeders) and young mice (<6 months) from the PTENTreg-KO strain were tested for spontaneous antinuclear autoantibodies in serum (ANA, left) and deposition of immunoglobulin G (IgG) and complement C3 in the kidney (right). (G and H) Young, healthy PTENTreg-KO mice, or control WT B6 mice, were challenged with 2 × 10⁷ apoptotic thymocytes weekly for four doses intravenously. Splenic B cells were analyzed for CD24 expression on day 28 (G). Serum titers of autoantibodies were compared at days 0, 14, and 28 (H). Pooled data from four to five mice; bars show SD.
Fig. 5
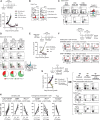
Fig. 5. Blocking PTEN allows rapid, spontaneous reconfiguration of the suppressive tumor milieu after chemotherapy.
(A) WT B6 mice with established B16F10 tumors were treated with a single dose of CTX (150 mg kg−1 ip) with or without VO-OHpic (10 mg kg−1 day−1 ip). Tumor volume is shown. Pooled data from five independent experiments; n = 10 to 16 tumors in each group; bars show SD. *P < 0.01 versus all other groups by ANOVA. (B to D) Mice with B16F10 tumors were treated as in (A) with CTX plus either VO-OHpic, CAL-101, or vehicle. (B) Phosphorylation of Akt in tumor-associated Tregs was assessed 4 days after CTX [numbers show the mean fluorescence intensity (MFI) of the positive population]. (C) Treg reprogramming in tumors after chemotherapy. Inset histograms show reduction in Foxp3 fluorescence with VO-OHpic. (D) DC activation in tumors after chemotherapy with VO-OHpic. (E) Rag1-KO hosts or WT B6 controls treated with CTX plus VO-OHpic. Mean of 16 tumors from two independent experiments; bars show SD (the bars in the WT group are smaller than the symbols). *P < 0.01 by ANOVA. (F) B6 mice received 2 × 10⁶ Thy1.1-congenic resting pmel-1 cells and then were implanted with B16F10 tumors. After 9 days, mice received either CTX + VO-OHpic or no treatment, and the phenotype of pmel-1 cells in tumors was analyzed on day 14. Representative of three experiments. (G) The effect of CTX + VO-OHpic is abrogated by antibody-mediated depletion of CD8+ cells. FACS analysis of tumor-infiltrating cells from representative tumors is shown on the right. n = 6 tumors per group, pooled from three independent experiments, *P < 0.01 by ANOVA. (H) Aggregate phenotyping data for immune cells infiltrating tumors treated with CTX, with or without VO-OHpic. The number of independent experiments for each marker is given, with P value by two-tailed paired t test. Lines connect the two groups in each experiment.
Fig. 6
Fig. 6. Extensive autochthonous melanoma tumors regress after chemotherapy plus PTEN inhibitor.
Tg(Grm1)Epv mice with extensive, multifocal autochthonous melanomas were treated with a single dose of CTX plus VO-OHpic as shown. Some mice also received concurrent CD8-depleting antibody as described in Materials and Methods. (A) Regression of tumors on the ears and tail (ears are from representative mice; tails are before and after). Inset graph: quantitation of ear thickness (proxy for tumor involvement) after treatment. n = 10 to 16 ears per group serially measured from three independent experiments; bars show SD. *P < 0.01 by ANOVA versus all other groups. The “pooled controls” group contains CTX alone and VO-OHpic alone, neither of which showed any effect. To estimate tumor regression, we subtracted the normal thickness of healthy mouse ear (0.6 ± 0.03 mm, n = 12) and then we expressed the serial tumor measurements as percent change relative to the original pretreatment baseline for that ear. (B) Histology on day +4 of CTX/VO-OHpic [hematoxylin and eosin (H&E) stain; tumor cells are visible as black melanotic lesions]. Representative of four experiments. (C to F) Phenotype of cells from disaggregated tumor (several pooled tumors from the same mouse). Representative of five independent experiments.

References

    1. Duan F., Duitama J., Al Seesi S., Ayres C. M., Corcelli S. A., Pawashe A. P., Blanchard T., McMahon D., Sidney J., Sette A., Baker B. M., Mandoiu I. I., Srivastava P. K., Genomic and bioinformatic profiling of mutational neoepitopes reveals new rules to predict anticancer immunogenicity. J. Exp. Med. 211, 2231–2248 (2014). - PMC - PubMed
    1. Coulie P. G., Van den Eynde B. J., van der Bruggen P., Boon T., Tumour antigens recognized by T lymphocytes: At the core of cancer immunotherapy. Nat. Rev. Cancer 14, 135–146 (2014). - PubMed
    1. Gubin M. M., Zhang X., Schuster H., Caron E., Ward J. P., Noguchi T., Ivanova Y., Hundal J., Arthur C. D., Krebber W.-J., Mulder G. E., Toebes M., Vesely M. D., Lam S. S. K., Korman A. J., Allison J. P., Freeman G. J., Sharpe A. H., Pearce E. L., Schumacher T. N., Aebersold R., Rammensee H.-G., Melief C. J. M., Mardis E. R., Gillanders W. E., Artyomov M. N., Schreiber R. D., Checkpoint blockade cancer immunotherapy targets tumour-specific mutant antigens. Nature 515, 577–581 (2014). - PMC - PubMed
    1. Snyder A., Makarov V., Merghoub T., Yuan J., Zaretsky J. M., Desrichard A., Walsh L. A., Postow M. A., Wong P., Ho T. S., Hollmann T. J., Bruggeman C., Kannan K., Li Y., Elipenahli C., Liu C., Harbison C. T., Wang L., Ribas A., Wolchok J. D., Chan T. A., Genetic basis for clinical response to CTLA-4 blockade in melanoma. N. Engl. J. Med. 371, 2189–2199 (2014). - PMC - PubMed
    1. Cha E., Klinger M., Hou Y., Cummings C., Ribas A., Faham M., Fong L., Improved survival with T cell clonotype stability after anti–CTLA-4 treatment in cancer patients. Sci. Transl. Med. 6, 238ra70 (2014). - PMC - PubMed