. 2015 Mar 20;1(2):e1500052.
doi: 10.1126/sciadv.1500052. eCollection 2015 Mar.

Habitat fragmentation and its lasting impact on Earth's ecosystems

Affiliations

Habitat fragmentation and its lasting impact on Earth's ecosystems

Nick M Haddad et al. Sci Adv. .

Abstract

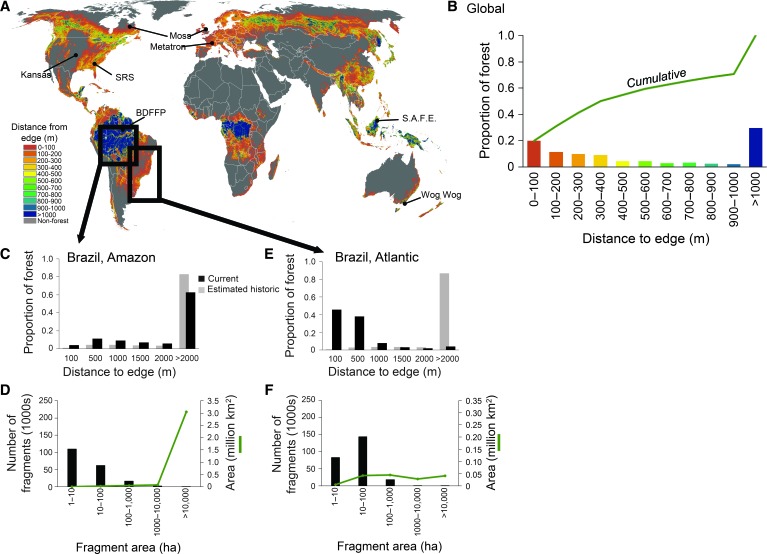
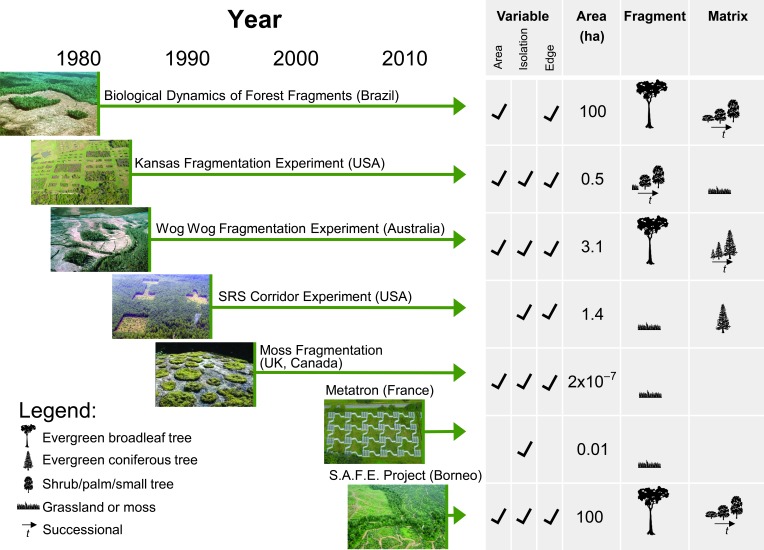
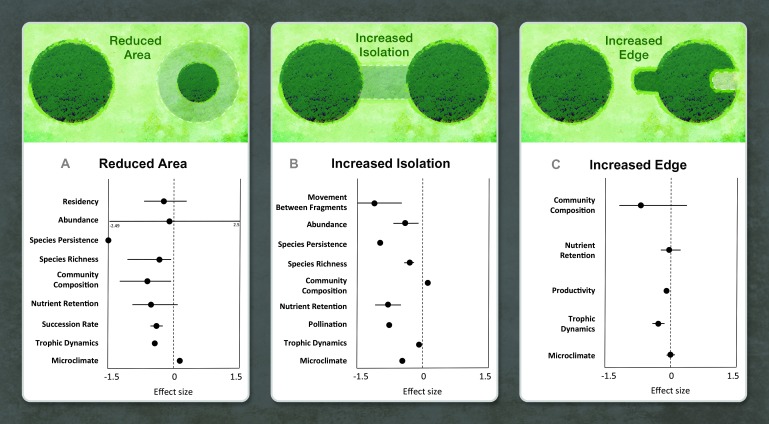
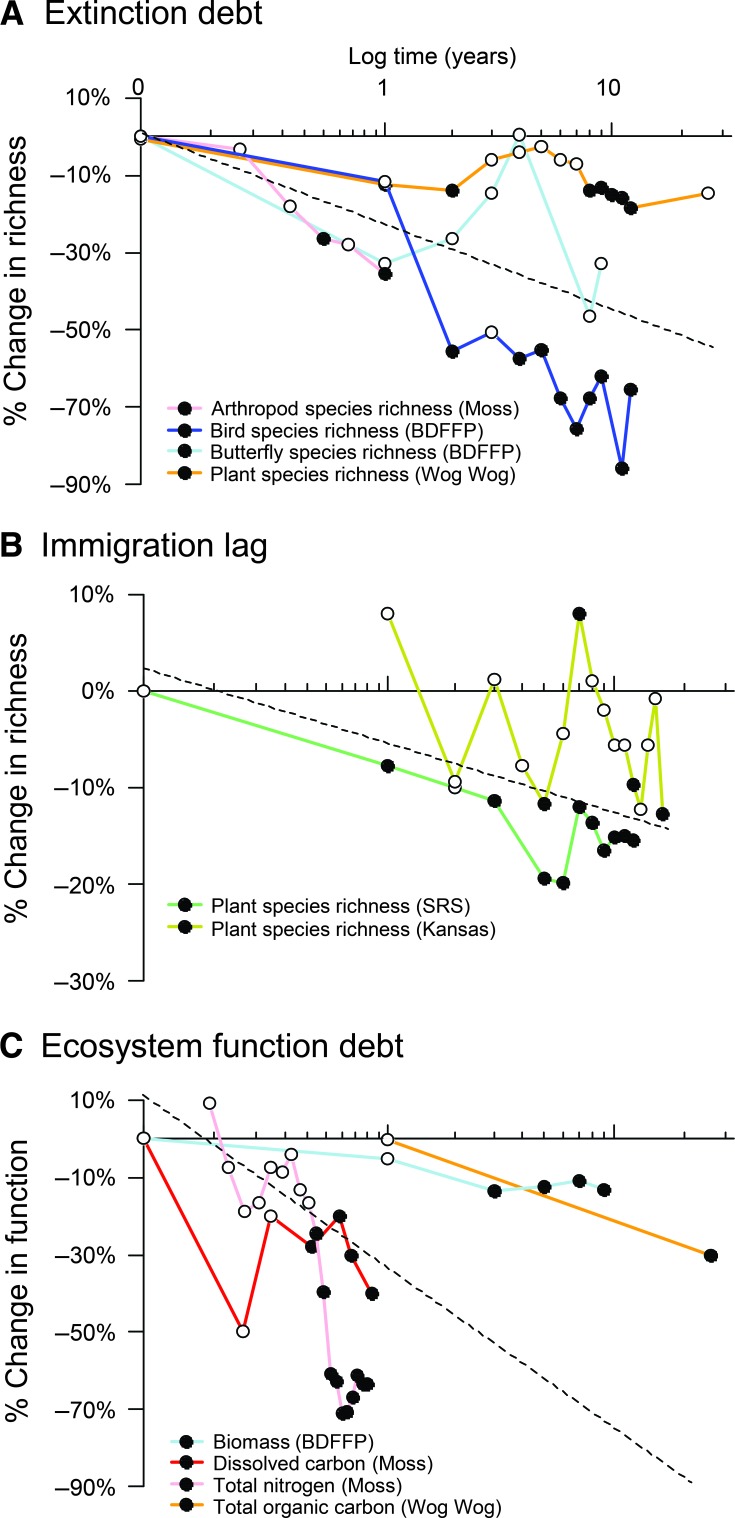
We conducted an analysis of global forest cover to reveal that 70% of remaining forest is within 1 km of the forest's edge, subject to the degrading effects of fragmentation. A synthesis of fragmentation experiments spanning multiple biomes and scales, five continents, and 35 years demonstrates that habitat fragmentation reduces biodiversity by 13 to 75% and impairs key ecosystem functions by decreasing biomass and altering nutrient cycles. Effects are greatest in the smallest and most isolated fragments, and they magnify with the passage of time. These findings indicate an urgent need for conservation and restoration measures to improve landscape connectivity, which will reduce extinction rates and help maintain ecosystem services.


Figures

Fig. 1
Fig. 1. The global magnitude of forest fragmentation.
(A) Mean distance to forest edge for forested pixels within each 1-km cell. Lines point to locations of ongoing fragmentation experiments identified and described in Fig. 2. (B) Proportion of the world’s forest at each distance to the forest edge and the cumulative proportion across increasing distance categories (green line). (C and E) In the Brazilian Amazon (C) and Atlantic Forests (E), the proportion of forest area at each distance to forest edge for both the current and estimated historic extent of forest. (D and F) In the Brazilian Amazon (D) and Atlantic Forests (F), the number of fragments and the total area of fragments of that size. The total number of fragments in the smallest bin (1 to 10 ha) is an underestimate in both the Atlantic Forest and Amazon data sets because not all of the very smallest fragments are mapped.
Fig. 2
Fig. 2. The world’s ongoing fragmentation experiments.
All experiments have been running continuously since the time indicated by the start of the associated arrow (with the exception of the moss fragmentation experiment, which represents a series of studies over nearly two decades). The variables under study in each experiment are checked. The area is that of the experiment’s largest fragments. Icons under “Fragment” and “Matrix” indicate the dominant community and its relative height, with multiple trees representing succession.
Fig. 3
Fig. 3. Fragmentation effects propagate through the whole ecosystem.
(A to C) For each fragmentation treatment [reduced area in BDFFP, Wog Wog, Kansas (A); increased isolation in SRS and Moss (B); and increased edge in all experiments (C)], we summarize major findings for ecological processes at all levels of ecological organization. Each dot represents the mean effect size [computed as log response ratio: ln(mean in more fragmented treatment/mean in non- or less-fragmented treatment)] for an ecological process. Effect sizes are statistical, such that negative or positive values could represent degrading function. Horizontal bars are the range when a dot is represented by more than one study. Details, including individual effect sizes for each study, are reported in table S1.
Fig. 4
Fig. 4. Delayed effects of fragmentation on ecosystem degradation.
(A) The extinction debt represents a delayed loss of species due to fragmentation. (B) The immigration lag represents differences in species richness caused by smaller fragment area or increased isolation during fragment succession. (C) The ecosystem function debt represents delayed changes in ecosystem function due to reduced fragment size or increased isolation. Percent loss is calculated as proportional change in fragmented treatments [for example, (no. of species in fragment − no. of species in control)/(no. of species in control) × 100]. Fragments and controls were either the same area before and after fragmentation, fragments compared to unfragmented controls, or small compared to large fragments. Filled symbols indicate times when fragmentation effects became significant, as determined by the original studies (see table S2). Mean slopes (dashed lines) were estimated using linear mixed (random slopes) models. Mean slope estimates (mean and SE) were as follows: (A) −0.22935 (0.07529); (B) −0.06519 (0.03495); (C) −0.38568 (0.16010).

References

    1. Pereira H. M., Leadley P. W., Proenca V., Alkemade R., Scharlemann J. P. W., Fernandez-Manjarres J. F., Araujo M. B., Balvanera P., Biggs R., Cheung W. W. L., Chini L., Cooper H. D., Gilman E. L., Guenette S., Hurtt G. C., Huntington H. P., Mace G. M., Oberdorff T., Revenga C., Rodrigues P., Scholes R. J., Sumaila U. R., Walpole M., Scenarios for global biodiversity in the 21st century. Science 330, 1496–1501 (2010). - PubMed
    1. Rands M. R. W., Adams W. M., Bennun L., Butchart S. H. M., Clements A., Coomes D., Entwistle A., Hodge I., Kapos V., Scharlemann J. P. W., Sutherland W. J., Vira B., Biodiversity conservation: Challenges beyond 2010. Science 329, 1298–1303 (2010). - PubMed
    1. D. B. Lindenmayer, J. Fischer, Habitat Fragmentation and Landscape Change: An Ecological and Conservation Synthesis (Island Press, Washington, DC, 2006).
    1. Didham R. K., Kapos V., Ewers R. M., Rethinking the conceptual foundations of habitat fragmentation research. Oikos 121, 161–170 (2012).
    1. Fahrig L., Rethinking patch size and isolation effects: The habitat amount hypothesis. J. Biogeogr. 40, 1649–1663 (2013).