. 2015 Jun 19;1(5):e1400127.
doi: 10.1126/sciadv.1400127. eCollection 2015 Jun.

Biodiversity and distribution of polar freshwater DNA viruses

Affiliations

Biodiversity and distribution of polar freshwater DNA viruses

Daniel Aguirre de Cárcer et al. Sci Adv. .

Abstract

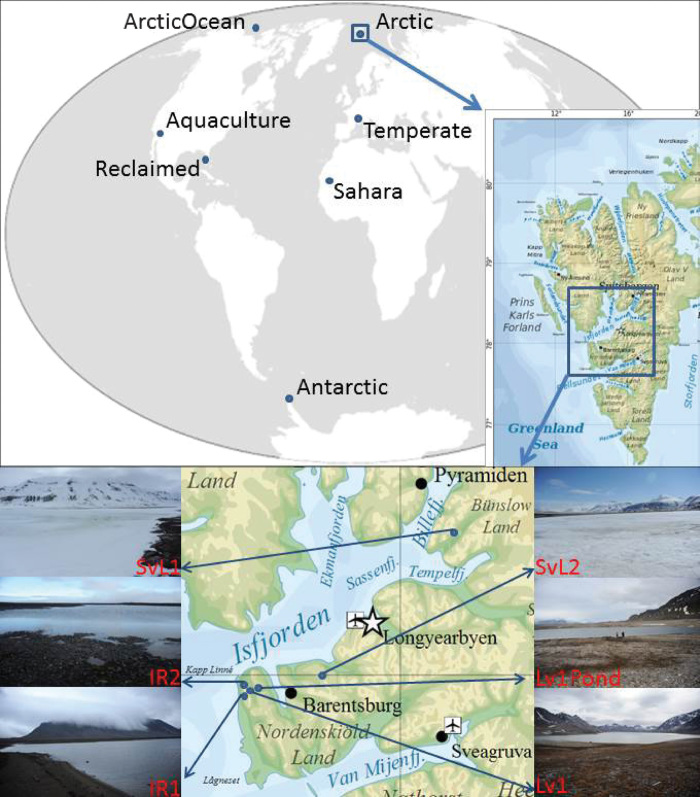
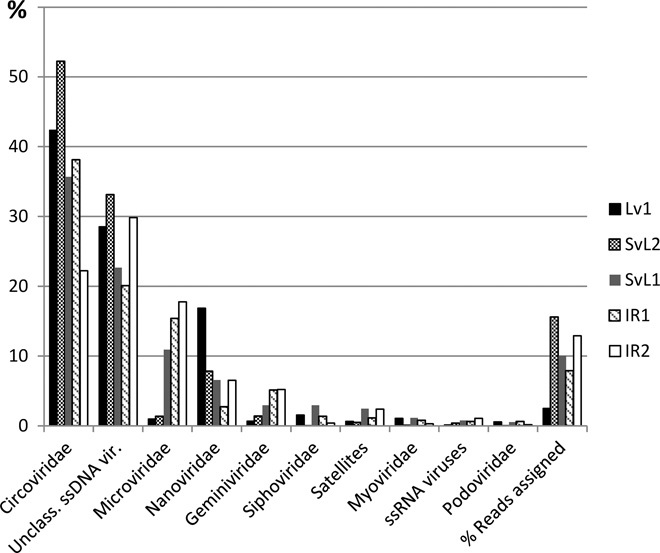
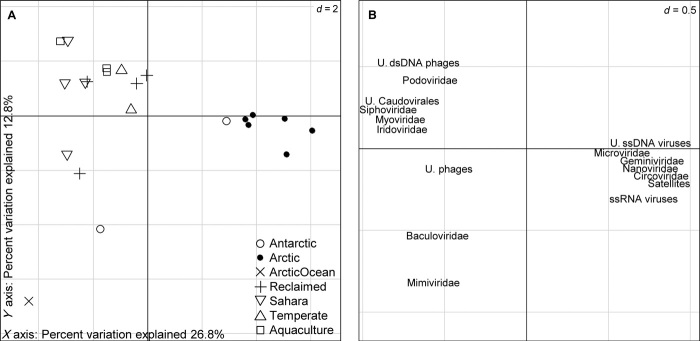
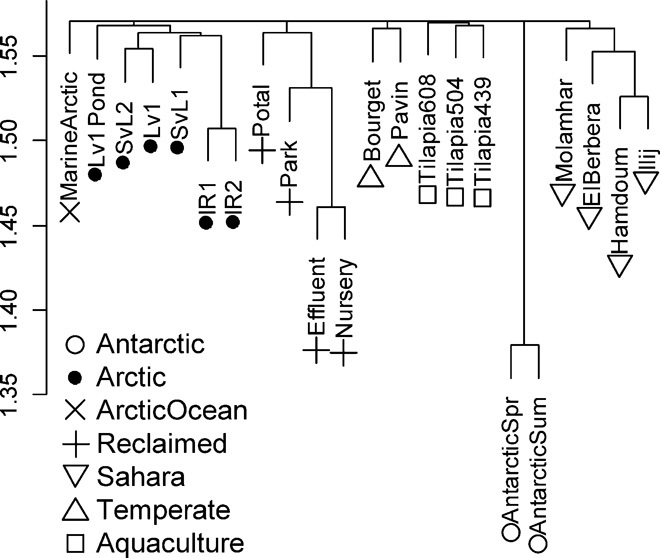
Viruses constitute the most abundant biological entities and a large reservoir of genetic diversity on Earth. Despite the recent surge in their study, our knowledge on their actual biodiversity and distribution remains sparse. We report the first metagenomic analysis of Arctic freshwater viral DNA communities and a comparative analysis with other freshwater environments. Arctic viromes are dominated by unknown and single-stranded DNA viruses with no close relatives in the database. These unique viral DNA communities mostly relate to each other and present some minor genetic overlap with other environments studied, including an Arctic Ocean virome. Despite common environmental conditions in polar ecosystems, the Arctic and Antarctic DNA viromes differ at the fine-grain genetic level while sharing a similar taxonomic composition. The study uncovers some viral lineages with a bipolar distribution, suggesting a global dispersal capacity for viruses, and seemingly indicates that viruses do not follow the latitudinal diversity gradient known for macroorganisms. Our study sheds light into the global biogeography and connectivity of viral communities.

Keywords: Arctic; Virus; biodiversity; environmental microbiology; freshwater lake; metagenomics.


Figures

Fig. 1
Fig. 1. Diagram depicting the global location of the freshwater environments studied.
A detailed position of the Arctic lakes in Spitsbergen and photographs of the lakes at the time of sampling are shown. Coordinates (latitude/longitude) of the Arctic lakes: Lv1 (Lake Linnevatnet) (78°03.864′N; 13°46.308′E); Lv1Pond (Borgdammane) (78°04.254′N; 13°47.652′E); IR1 (Lake Tunsjøen) (78°03.375′N; 13°40.313′E); IR2 (78°02.935′N; 13°41973′E); SvL1 (Lake Nordammen) (78°38.279′N; 16°44.025′E); SvL2 (Lake Tenndammen) (78°06.118′N; 15°02.024′E). [Svalbard map was obtained from http://es.wikipedia.org/wiki/Svalbard#mediaviewer/Archivo:Topographic_map_of_Svalbard.svg and published under terms of the GNU Free Documentation License (http://commons.wikimedia.org/wiki/Commons:GNU_Free_Documentation_License_1.2).]
Fig. 2
Fig. 2. Taxonomic distribution of assigned metagenomic reads from Arctic viromes.
Results represent blastx hits against a viral genome database summarized by MEGAN (Meta Genome Analyzer). Only the 10 most abundant categories are shown.
Fig. 3
Fig. 3. Ordination of individual freshwater viromes according to their taxonomic profiles.
The figure represents the first two axes of a principal components analysis based on the taxonomic affiliation of assigned reads. (A) Projection of the individual viromes on the model. Viromes from the same environment are represented by equal forms. (B) Projection of the viral groups with a higher contribution to the model. The position of each group represents its association with each virome. The analysis indicates a strong partitioning of the viromes between polar and nonpolar viromes, driven mainly by the relative abundance of small circular ssDNA viruses and phages. U., unclassified; d, distance.
Fig. 4
Fig. 4. Reference-independent cross-assembly (crAss) comparison of individual freshwater viromes.
The dendrogram represents a hierarchical clustering (average-linkage method) of Wootters distance values derived from the cross-assembly of freshwater viromes. Viromes from the same environment are represented by equal forms. The analysis evidences very low fine-grain genetic overlap between viromes from different environments.
Fig. 5
Fig. 5. Coarse-grain genetic overlap between environments.
The heatplot represents the results of cross-tblastx searches between per-environment pooled viral metagenomes. Values (% of total reads with hits with E value <0.001) are registered within the boxes and color-coded. Horizontal labels represent viromes acting as query, and vertical labels represent viromes acting as reference.

References

    1. Suttle C. A., Viruses in the sea. Nature 437, 356–361 (2005). - PubMed
    1. Ignacio-Espinoza J. C., Solonenko S. A., Sullivan M. B., The global virome: Not as big as we thought? Curr. Opin. Virol. 3, 566–571 (2013). - PubMed
    1. Fuhrman J. A., Marine viruses and their biogeochemical and ecological effects. Nature 399, 541–548 (1999). - PubMed
    1. Mann N. H., Cook A., Millard A., Bailey S., Clokie M., Marine ecosystems: Bacterial photosynthesis genes in a virus. Nature 424, 741 (2003). - PubMed
    1. Williamson S. J., Rusch D. B., Yooseph S., Halpern A. L., Heidelberg K. B., Glass J. I., Andrews-Pfannkoch C., Fadrosh D., Miller C. S., Sutton G., Frazier M., Venter J. C., The Sorcerer II Global Ocean Sampling Expedition: Metagenomic characterization of viruses within aquatic microbial samples. PLOS One 3, e1456 (2008). - PMC - PubMed

LinkOut - more resources