. 2015 Sep 25;1(8):e1500527.
doi: 10.1126/sciadv.1500527. eCollection 2015 Sep.

A phylogenomic data-driven exploration of viral origins and evolution

Affiliations

A phylogenomic data-driven exploration of viral origins and evolution

Arshan Nasir et al. Sci Adv. .

Abstract

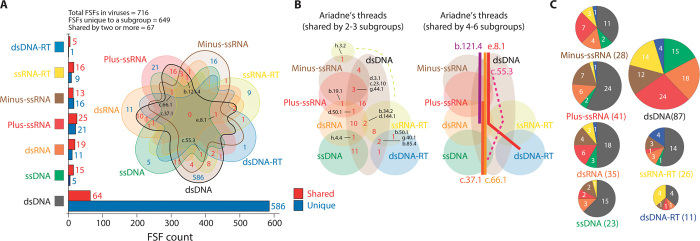
The origin of viruses remains mysterious because of their diverse and patchy molecular and functional makeup. Although numerous hypotheses have attempted to explain viral origins, none is backed by substantive data. We take full advantage of the wealth of available protein structural and functional data to explore the evolution of the proteomic makeup of thousands of cells and viruses. Despite the extremely reduced nature of viral proteomes, we established an ancient origin of the "viral supergroup" and the existence of widespread episodes of horizontal transfer of genetic information. Viruses harboring different replicon types and infecting distantly related hosts shared many metabolic and informational protein structural domains of ancient origin that were also widespread in cellular proteomes. Phylogenomic analysis uncovered a universal tree of life and revealed that modern viruses reduced from multiple ancient cells that harbored segmented RNA genomes and coexisted with the ancestors of modern cells. The model for the origin and evolution of viruses and cells is backed by strong genomic and structural evidence and can be reconciled with existing models of viral evolution if one considers viruses to have originated from ancient cells and not from modern counterparts.

Keywords: fold; horizontal gene transfer; origin of life; phylogenetic analysis; protein domain; structure; taxonomy; tree of life; virus.


Figures

Fig. 1
Fig. 1. FSF sharing patterns and makeup of cellular and viral proteomes.
(A) Numbers in parentheses indicate the total number of proteomes that were sampled from Archaea, Bacteria, Eukarya, and viruses. (B) Barplots comparing the proteomic composition of viruses infecting the three superkingdoms. Numbers in parentheses indicate the total number of viral proteomes in each group. Numbers above bars indicate the total number of proteins in each of the three classes of proteins. VSFs are listed in Table 1. (C and D) FSF use and reuse for proteomes in each viral subgroup and in the three superkingdoms. Values given in logarithmic scale. Important outliers are labeled. Shaded regions highlight the overlap between parasitic cells and giant viruses.
Fig. 2
Fig. 2. Spread of viral FSFs in cellular proteomes.
(A) Violin plots comparing the spread (f value) of FSFs shared and not shared with viruses in archaeal, bacterial, and eukaryal proteomes. (B) Violin plots comparing the spread (f value) of FSFs shared with each viral subgroup in archaeal, bacterial, and eukaryal proteomes. Numbers on top indicate the total number of FSFs involved in each comparison. White circles in each boxplot represent group medians. Density trace is plotted symmetrically around the boxplots.
Fig. 3
Fig. 3. Virus-host preferences and FSF distribution in viruses infecting different hosts.
(A) The abundance of each viral replicon type that is capable of infecting Archaea, Bacteria, and Eukarya and major divisions in Eukarya. Virus-host information was retrieved from the National Center for Biotechnology Information Viral Genomes Project (119). Hosts were classified into Archaea, Bacteria, Protista (animal-like protists), Fungi, Plants (all plants, blue-green algae, and diatoms), Invertebrates and Plants (IP), and Metazoa (vertebrates, invertebrates, and humans). Host information was available for 3440 of the 3660 viruses that were sampled in this study. Two additional ssDNA archaeoviruses were added from the literature (129, 130). Numbers on bars indicate the total virus count in each host group. (B) Venn diagram shows the distribution of 715 (of 716) FSFs that were detected in archaeoviruses, bacterioviruses, and eukaryoviruses. Host information on the Circovirus-like genome RW_B virus encoding the “Satellite viruses” FSF (b.121.7) was not available. (C) Mean f values for FSFs corresponding to each of the seven Venn groups defined in (B) in archaeal, bacterial, and eukaryal proteomes. Values were averaged for all FSFs in each of the seven Venn groups. Text above bars indicates how many different viral subgroups encoded those FSFs.
Fig. 4
Fig. 4. FSF distribution in the viral supergroup.
(A) Total number of FSFs that were either shared or uniquely present in each viral subgroup. A seven-set Venn diagram makes explicit the 127 (27 – 1) combinations that are possible with seven groups. (B) Ariadne’s threads give the most parsimonious solution to encase all highly shared FSFs between different viral subgroups. Threads were inferred directly from the seven-set Venn diagram. FSFs identified by SCOP css. (C) Number of FSFs shared in each viral subgroup with every other subgroup. Pie charts are proportional to the size of the FSF repertoire in each viral subgroup.
Fig. 5
Fig. 5. Phylogenomic analysis of FSF domains.
(A) ToD describe the evolution of 1995 FSF domains (taxa) in 5080 proteomes (characters) (tree length = 1,882,554; retention index = 0.74; g1 = −0.18). The bar on top of ToD is a simple representation of how FSFs appeared in its branches, which correlates with their age (nd). FSFs were labeled blue for cell-only and red for those either shared with or unique to viruses. The boxplots identify the most ancient and derived Venn groups. Two major phases in the evolution of viruses are indicated in different background colors. Patterned area highlights the appearances of AV, BV, and EV soon after A, B, and E, respectively. FSFs are identified by SCOP css. (B) Viral FSFs plotted against their spread in viral proteomes (f value) and evolutionary time (nd). FSFs identified by SCOP css. (C) Distribution of ABEV FSFs in each viral subgroup along evolutionary time (nd). Numbers in parentheses indicate the total number of ABEV FSFs in each viral subgroup. White circles indicate group medians. Density trace is plotted symmetrically around the boxplots.
Fig. 6
Fig. 6. Ancient history of RNA viral proteomes.
(A) The length of Ariadne’s threads (colored lines) identifies FSFs that were shared by more than three viral subgroups. Filled circles indicate FSFs shared between two or three viral subgroups. Numbers next to each circle give the mean nd of FSFs shared by each combination. Numbers in parentheses give the range between the most ancient and the most recent FSFs that were shared by each combination. (B) Distribution of the most ancient (nd < 0.3) ABEV FSFs in evolutionary timeline (nd) for each viral subgroup. Numbers in parentheses indicate the total FSFs in each viral subgroup. White circles indicate group medians. A density trace is plotted symmetrically around the boxplots.
Fig. 7
Fig. 7. Evolutionary relationships between cells and viruses.
(A) ToP describing the evolution of 368 proteomes (taxa) that were randomly sampled from cells and viruses and were distinguished by the abundance of 442 ABEV FSFs (characters) (tree length = 45,935; retention index = 0.83; g1 = −0.31). All characters were parsimony informative. Differently colored branches represent BS support values. Major groups are identified. Viral genera names are given inside parentheses. The viral order “Megavirales” is awaiting approval by the ICTV and hence written inside quotes. Viral families that form largely unified or monophyletic groups are labeled with an asterisk. Virion morphotypes were mapped to ToP and illustrated with images from the ViralZone Web resource (131). No picture was available for Turriviridae. aActinobacteria, Bacteroidetes/Chlorobi, Chloroflexi, Cyanobacteria, Fibrobacter, Firmicutes, Planctomycetes, and Thermotogae. (B) A distance-based phylogenomic network reconstructed from the occurrence of 442 ABEV FSFs in randomly sampled 368 proteomes (uncorrected P distance; equal angle; least-squares fit = 99.46). Numbers on branches indicate BS support values. Taxa were colored for easy visualization. Important groups are labeled. bActinobacteria, Bacteroidetes/Chlorobi, Chloroflexi, Cyanobacteria, Deinococcus-Thermus, Fibrobacter, Firmicutes, and Planctomycetes. cAmoebozoa and Chromalveolata.
Fig. 8
Fig. 8. Evolutionary history of proteomes inferred from numerical analysis.
(A) Plot of the first three axes of evoPCO portrays evolutionary distances between cellular and viral proteomes. The percentage of variability explained by each coordinate is given in parentheses on each axis. The proteome of the last common ancestor of modern cells (57) was added as an additional sample to infer the direction of evolutionary splits. aIgnicoccus hospitalis, bLactobacillus delbrueckii, cCaenorhabditis elegans. (B) A distance-based NJ tree reconstructed from the occurrence of 442 ABEV FSFs in randomly sampled 368 proteomes. Each taxon was given a unique tree ID (tables S1 and S2). Taxa were colored for quick visualization.

References

    1. Domingo E., Holland J. J., RNA virus mutations and fitness for survival. Annu. Rev. Microbiol. 51, 151–178 (1997). - PubMed
    1. A. M. Q. King, M. J. Adams, E. B. Carstens, E. J. Lefkowitz, Virus Taxonomy: Classification and Nomenclature of Viruses: Ninth Report of the International Committee on Taxonomy of Viruses (Elsevier, San Diego, CA, 2012).
    1. Krupovic M., Bamford D. H., Double-stranded DNA viruses: 20 families and only five different architectural principles for virion assembly. Curr. Opin. Virol. 1, 118–124 (2011). - PubMed
    1. Balaji S., Srinivasan N., Comparison of sequence-based and structure-based phylogenetic trees of homologous proteins: Inferences on protein evolution. J. Biosci. 32, 83–96 (2007). - PubMed
    1. Abroi A., Gough J., Are viruses a source of new protein folds for organisms? Virosphere structure space and evolution. Bioessays 33, 626–635 (2011). - PubMed

LinkOut - more resources