. 2015 Oct 30;1(9):e1500661.
doi: 10.1126/sciadv.1500661. eCollection 2015 Oct.

Fingertip skin-inspired microstructured ferroelectric skins discriminate static/dynamic pressure and temperature stimuli

Affiliations

Fingertip skin-inspired microstructured ferroelectric skins discriminate static/dynamic pressure and temperature stimuli

Jonghwa Park et al. Sci Adv. .

Abstract

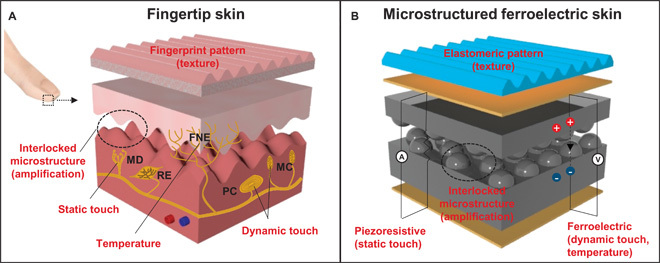
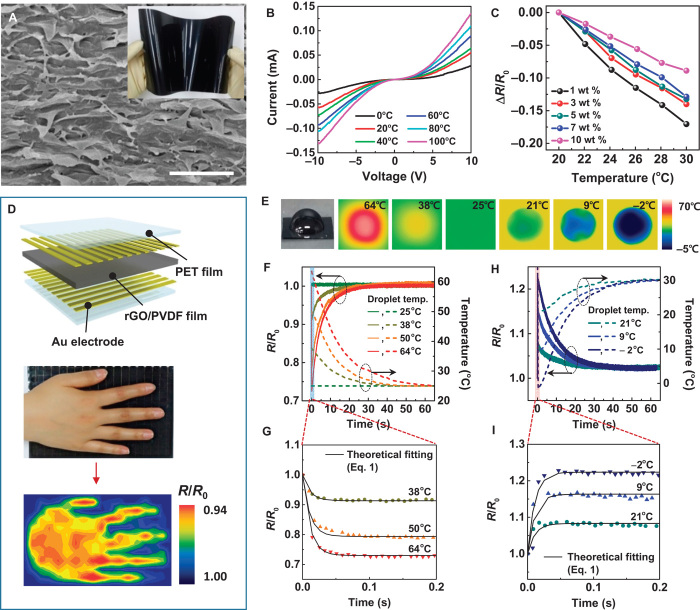
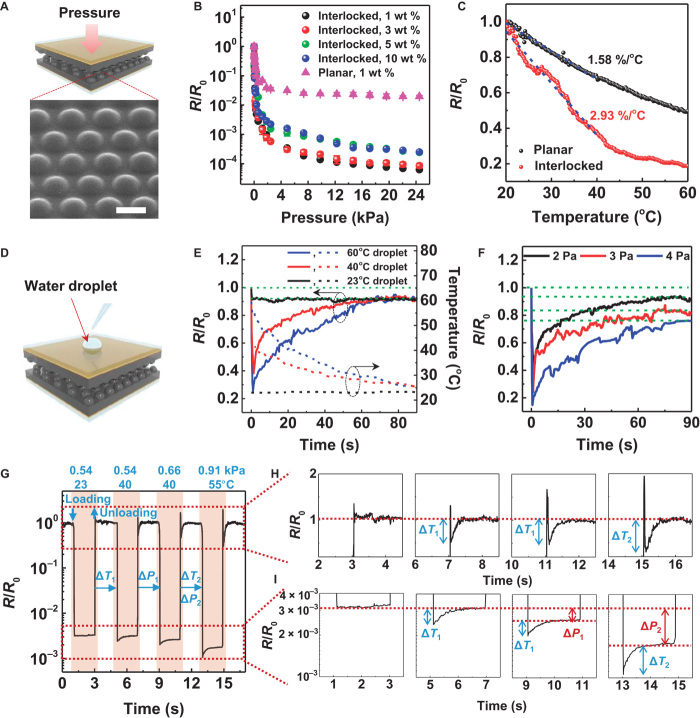
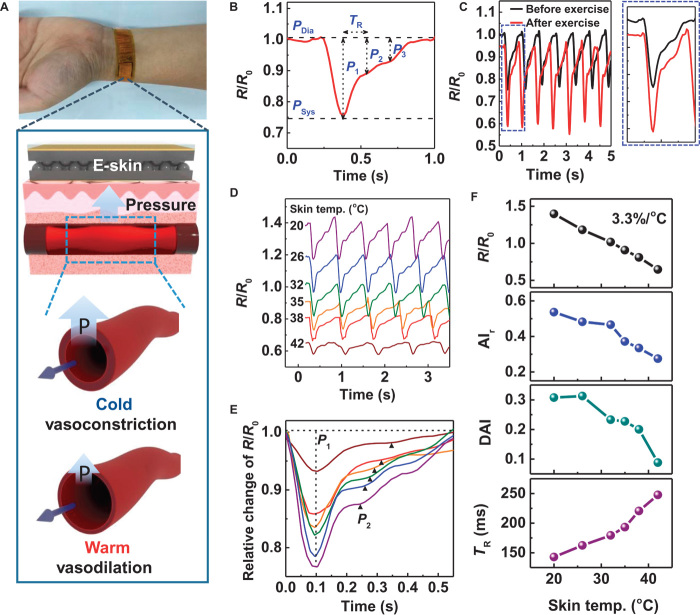
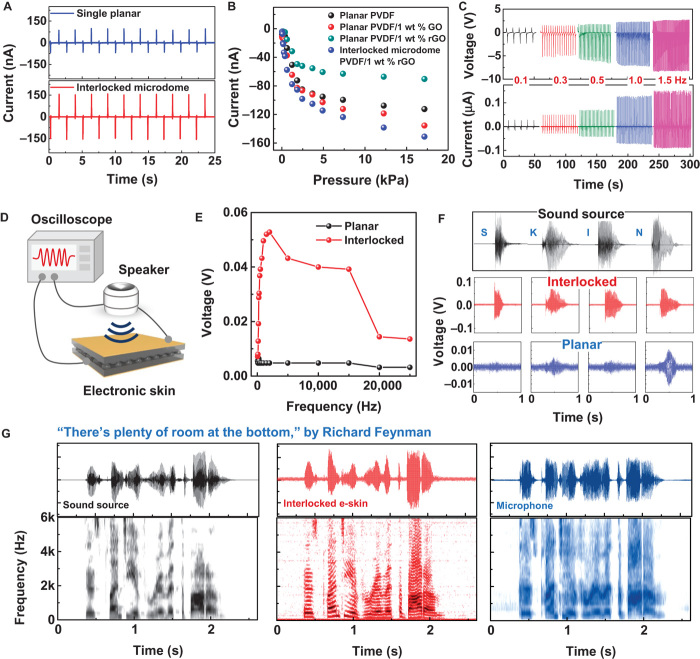
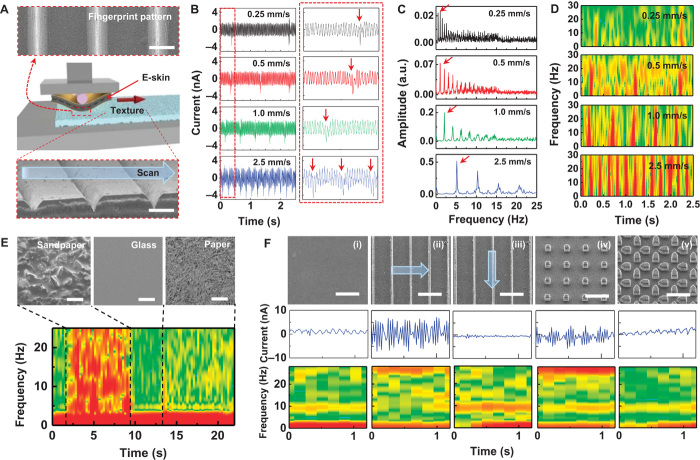
In human fingertips, the fingerprint patterns and interlocked epidermal-dermal microridges play a critical role in amplifying and transferring tactile signals to various mechanoreceptors, enabling spatiotemporal perception of various static and dynamic tactile signals. Inspired by the structure and functions of the human fingertip, we fabricated fingerprint-like patterns and interlocked microstructures in ferroelectric films, which can enhance the piezoelectric, pyroelectric, and piezoresistive sensing of static and dynamic mechanothermal signals. Our flexible and microstructured ferroelectric skins can detect and discriminate between multiple spatiotemporal tactile stimuli including static and dynamic pressure, vibration, and temperature with high sensitivities. As proof-of-concept demonstration, the sensors have been used for the simultaneous monitoring of pulse pressure and temperature of artery vessels, precise detection of acoustic sounds, and discrimination of various surface textures. Our microstructured ferroelectric skins may find applications in robotic skins, wearable sensors, and medical diagnostic devices.

Keywords: Acoustic Sound Detection; Ferroelectric Skin; Fingertip Skin; Graphene; Poly(vinylidene fluoride); Static and Dynamic Pressure Sensor; Surface Texture Recognition; Temperature Sensor.


Figures

Fig. 1
Fig. 1. Human skin–inspired multifunctional e-skin.
(A) Structural and functional characteristics of human fingertips. Fingertip skin consists of slow-adapting mechanoreceptors [Merkel (MD) and Ruffini corpuscles (RE)] for static touch, fast-adapting mechanoreceptors [Meissner (MC) and Pacinian corpuscles (PC)] for dynamic touch, free nerve endings (FNE) for temperature, fingerprint patterns for texture, and epidermal/dermal interlocked microstructures for tactile signal amplification. (B) Flexible and multimodal ferroelectric e-skin. The functionalities of human skin are mimicked by elastomeric patterns (texture) and piezoresistive (static pressure), ferroelectric (dynamic pressure and temperature), and interlocked microdome arrays (tactile signal amplification).
Fig. 2
Fig. 2. Temperature-sensing properties of the flexible rGO/PVDF nanocomposite film.
(A) Cross-sectional SEM image of the rGO/PVDF composite film with stacked GO sheets. Scale bar, 1 μm. The inset shows a photograph of a flexible and large-scale (20 × 15 cm2) rGO/PVDF composite film. (B) Current-voltage curves of 1 wt % rGO/PVDF composite films at various temperatures. (C) Relative resistance change of rGO/PVDF composite film as a function of temperature for various concentrations of rGO. (D) Detection of temperature distribution on the human palm. (Top) Schematic diagram of a sensor array, where the rGO/PVDF composite film is sandwiched between gold electrode arrays (18 × 12 pixels). (Middle) Photograph of a human hand on top of the sensor array. (Bottom) Contour mapping of electrical resistance variations for the local temperature distribution on the human palm. (E) A representative photograph and infrared (IR) camera images of water droplets with different droplet temperatures (64° to −2°C) on the e-skins. (F and H) Relative resistance (R/R0) and temperature (T) variations of the e-skins after contact with water droplets (F) above room temperature (25° to 64°C) and (H) below room temperature (−2° to 21°C). Temperature (T) change is measured by an IR camera. (G and I) Initial stages of time-domain signals in (F) and (H) showing the variation of relative resistance immediately after contact between e-skins and water droplets. The solid lines represent a fit derived from Eq. 1.
Fig. 3
Fig. 3. Piezoresistive e-skin with interlocked microdome arrays for simultaneous detection of static pressure and temperature.
(A) Schematic illustration of the e-skin with interlocked microdome array. A tilted SEM image shows the microdome arrays that are 10 μm in diameter, 4 μm in height, and 12 μm in pitch size. Scale bar, 10 μm. (B) Relative resistances of e-skins with interlocked microdome (circle) and single planar (triangle) geometries as a function of applied pressure for different rGO loading concentrations. (C) Relative resistances of e-skins with interlocked microdome (red) and single planar (black) geometries as a function of temperature for 1 wt % rGO. (D) Schematic illustration of the loading of a water droplet onto the e-skin. (E and F) Time-dependent variation of relative resistances and temperature immediately after the loading of water droplets on e-skins at (E) different temperatures (droplet pressure, 2 Pa) and (F) different pressures (droplet temperature, 40°C). (G) Time-dependent variation of relative resistances after the loading/unloading cycles of objects with various pressure and temperature values on top of an interlocked e-skin. (H and I) Magnified variation of relative resistances at the moment of loading/unloading cycles in (G) showing the detection and discrimination of simultaneous temperature and pressure variations.
Fig. 4
Fig. 4. Piezoresistive e-skin with interlocked microdome array for simultaneous monitoring of artery pulse pressure and temperature.
(A) Photograph of a wearable e-skin for monitoring artery pulse pressure and temperature. The enlarged schematic illustrations indicate the effect of temperature on the constriction (cold) and dilation (warm) of arterial vessels. (B) Relative resistance variations in response to artery pulse pressure. The pulse pressure waveform consists of three peaks corresponding to pulse pressure (P1) and reflected wave pressures from the hand (P2) and lower body (P3). P1 is the difference between the systolic (PSys) and diastolic (PDia) pressures. (C) Variation of the pulse pressure waveforms before (black) and after (red) physical exercise. (D) Relative resistance change of the artery pulse pressure waveforms as a function of skin temperature (20° to 42°C). (E) Comparison of the variation of artery pulse pressure waveform at different skin temperatures. The data in (D) are used with the data-offset modification for the comparison. (F) The blood pressure and temperature information acquired from the measurements in (E); variations of relative resistance (R/R0) (black), radial artery augmentation index (AIr = P2/P1) (blue), radial diastolic augmentation index (DAI = P3/P1) (green), and round trip time for the reflected wave from the hand periphery (TR) (purple) as a function of skin temperature.
Fig. 5
Fig. 5. Piezoelectric e-skin with interlocked microdome array for dynamic touch and acoustic sound detection.
(A) Piezoelectric output currents of e-skins with (top) interlocked microdome array and (bottom) single planar geometries. (B) Pieozoelectric pressure sensitivities of the e-skins fabricated with different materials and device structures (frequency of loading pressure, 0.5 Hz). (C) Piezoelectric output voltage and current under repetitive impact pressure loadings at different frequencies (0.1 to 1.5 Hz) for the static normal loading force of 8.56 kPa at a fixed pushing distance of pushing tester. (D) Schematic illustration of the sound detection tests using the piezoelectric e-skins at the sound intensity of 96.5 dB. The sensor distance from the speaker is 2 cm. (E) Variation of the piezoelectric voltage in response to acoustic waves of different frequencies. (F) The waveforms of acoustic sound for different letters of the alphabet (“S,” “K,” “I,” and “N”) (black). The readout voltage signals from the interlocked microdome (red) and planar e-skins (blue). (G) The waveform and short-time Fourier transform (STFT) signals of the original sound (“There’s plenty of room at the bottom,” black) extracted by the sound wave analyzer, readout signals from the interlocked e-skin (red), and microphone (blue).
Fig. 6
Fig. 6. Piezoelectric e-skin with fingerprint-like patterns for texture perception.
(A) Schematic illustration of texture perception measurements, for which the e-skin is attached to a microstage and scanned over a surface. (Top) SEM image of the fingerprint-inspired PDMS pattern. (Bottom) SEM image of the PDMS substrate with periodic line patterns (P = 470 μm, W = 163 μm). Scale bar, 200 μm. (B) Time-dependent variation of piezoelectric currents when the e-skin is scanned over the patterned surface at different scanning speeds (0.25 to 2.5 mm/s). (C) Fast Fourier transform (FFT) spectra of time-dependent piezoelectric current signals in (B). (D) STFT spectrograms of the piezoelectric current signals in (B) for the low-frequency range (0 to 30 Hz). (E) Perception of texture with different roughnesses. (Top) SEM images of the sandpaper, paper, and glass surfaces. (Bottom) STFT spectra of the corresponding output currents when the e-skin is scanned at 2.5 mm/s. Scale bar, 200 μm. (F) Perception of fine textures (<100 μm). (Top) SEM images, (middle) output current signals, and (bottom) STFT spectra of different silicon substrates with (i) planar, (ii and iii) line pattern (P = 80 μm, D = 10 μm), (iv) square pattern (P = 80 μm, D = 20 μm), and (v) pentagon pattern (P = 90 μm, D = 20 μm). The arrow indicates the scanning direction. Scale bar, 100 μm. a.u., arbitrary units.

References

    1. Someya T., Kato Y., Sekitani T., Iba S., Noguchi Y., Murase Y., Kawaguchi H., Sakurai T., Conformable, flexible, large-area networks of pressure and thermal sensors with organic transistor active matrixes. Proc. Natl. Acad. Sci. U.S.A. 102, 12321–12325 (2005). - PMC - PubMed
    1. Sekitani T., Yokota T., Zschieschang U., Klauk H., Bauer S., Takeuchi K., Takamiya M., Sakurai T., Someya T., Organic nonvolatile memory transistors for flexible sensor arrays. Science 326, 1516–1519 (2009). - PubMed
    1. Takei K., Takahashi T., Ho J. C., Ko H., Gillies A. G., Leu P. W., Fearing R. S., Javey A., Nanowire active-matrix circuitry for low-voltage macroscale artificial skin. Nat. Mater. 9, 821–826 (2010). - PubMed
    1. Mannsfeld S. C. B., Tee B. C.-K., Stoltenberg R. M., Chen C. V. H.-H., Barman S., Muir B. V. O., Sokolov A. N., Reese C., Bao Z., Highly sensitive flexible pressure sensors with microstructured rubber dielectric layers. Nat. Mater. 9, 859–864 (2010). - PubMed
    1. Kim D.-H., Lu N. S., Ma R., Kim Y.-S., Kim R.-H., Wang S. D., Wu J., Won S. M., Tao H., Islam A., Yu K. J., Kim T.-., Chowdhury R., Ying M., Xu L. Z., Li M., Chung H.-J., Keum H., McCormick M., Liu P., Zhang Y.-W., Omenetto F. G., Huang Y., Coleman T., Rogers J. A., Epidermal electronics. Science 333, 838–843 (2011). - PubMed