. 2015 Oct 30;1(9):e1500701.
doi: 10.1126/sciadv.1500701. eCollection 2015 Oct.

Epidermal devices for noninvasive, precise, and continuous mapping of macrovascular and microvascular blood flow

Affiliations

Epidermal devices for noninvasive, precise, and continuous mapping of macrovascular and microvascular blood flow

R Chad Webb et al. Sci Adv. .

Abstract

Continuous monitoring of variations in blood flow is vital in assessing the status of microvascular and macrovascular beds for a wide range of clinical and research scenarios. Although a variety of techniques exist, most require complete immobilization of the subject, thereby limiting their utility to hospital or clinical settings. Those that can be rendered in wearable formats suffer from limited accuracy, motion artifacts, and other shortcomings that follow from an inability to achieve intimate, noninvasive mechanical linkage of sensors with the surface of the skin. We introduce an ultrathin, soft, skin-conforming sensor technology that offers advanced capabilities in continuous and precise blood flow mapping. Systematic work establishes a set of experimental procedures and theoretical models for quantitative measurements and guidelines in design and operation. Experimental studies on human subjects, including validation with measurements performed using state-of-the-art clinical techniques, demonstrate sensitive and accurate assessment of both macrovascular and microvascular flow under a range of physiological conditions. Refined operational modes eliminate long-term drifts and reduce power consumption, thereby providing steps toward the use of this technology for continuous monitoring during daily activities.

Keywords: Flexible electronics; Sensor; blood flow; circulation; skin; stretchable; thermal transport; wearable electronics.


Figures

Fig. 1
Fig. 1. Device design and thermal response to flow.
(A) Schematic illustration of the device layout, including a blood vessel near the skin surface. A large (3-mm diameter) central thermal actuator provides power input into the vessel (typically 25 or 3.5 mW mm−2), at temperatures below the threshold for sensation (<8°C rise above the base skin temperature). Fourteen surrounding sensors allow measurement of the resulting thermal distribution (inset: magnified view of one sensor). An additional sensor serves to detect changes in the background temperature to compensate for drift. An array of bonding pads enables the attachment of a thin (100 μm) flexible cable interface to external data acquisition electronics. (B) Photograph of a device on the skin. (C) An infrared image of a device on the skin over a vein, during application of power to the actuator. (D) Raw data from a device applied to an area above a large vessel. The layout of the graphs corresponds approximately to the spatial distribution of the sensors (black) and actuator (red). The thermal distribution is strongly anisotropic, with bias in the direction of flow. Heating begins at t = 60 s and ends at t = 360 s. (E) Spatial map of the temperature at t = 300 s. The color map uses spatially interpolated data. Black arrows indicate the relative magnitudes of the temperature rise measured by the inner ring of sensors. (F) Same spatial map as that shown in (E), with the signal of the heater removed to enhance the contrast of the data measured by the surrounding sensors. (G) Results of measured thermal flow, calculated from the temperature distribution around the actuator. The vector arrow map shows the calculated convection-driven thermal flow fields. The color map represents the magnitude of the flow field. (H and I) Similar maps as shown in (G), where the color maps represent the magnitude of flow in the (H) x direction (X-comp) and (I) y direction (Y-comp).
Fig. 2
Fig. 2. Process for quantifying blood flow rates from measured thermal signals.
Conversion of thermal signals to blood flow rates relies on models that include a linear vessel of radius R, a distance h beneath the surface of the skin, with a central thermal actuator on the skin surface of radius B, and two sensors, one upstream and one downstream along the vessel, at a distance L (from actuator edge to sensor center). (A and B) Top-down (A) and cross-sectional (B) views of this model system. (C) The first step determines the thermal transport properties of tissue located at each of the sensors and at the actuator. Here, 2 mA of current is applied to each sensor for 2 s. The local thermal conductivity and thermal diffusivity follow from analysis of the thermal transients associated with heating and cooling. (D) The second step approximates the depth of the blood vessel. The experimental initial transient profile of the differential temperature across the thermal actuator is compared to finite element models of the skin to determine the approximate depth of the vessel, using the thermal transport values determined in the first step (C). (E) The third step converts the thermal information to a blood flow velocity, v, using the values determined in the first (C) and second (D) steps. The differential temperature reaches a maximum at low flow velocity. The temperature rise at each sensor determines whether the calculation uses the low- or high-flow regimes. (F) Most physiologically relevant flow rates are expected to fall in the high-flow regime. The radius of the underlying blood vessel, R, has a minor impact on the responses in the high-flow regime, due to their dependence on R/L. The equations represent the numerical fits at R = 0.95 and 1.65 mm of the high-flow regime.
Fig. 3
Fig. 3. Measurements of changes in venous blood flow induced by local applied pressure.
(A) The device resides on the wrist, over a 2-mm-diameter vein with orientation shown in the illustration. formula image 
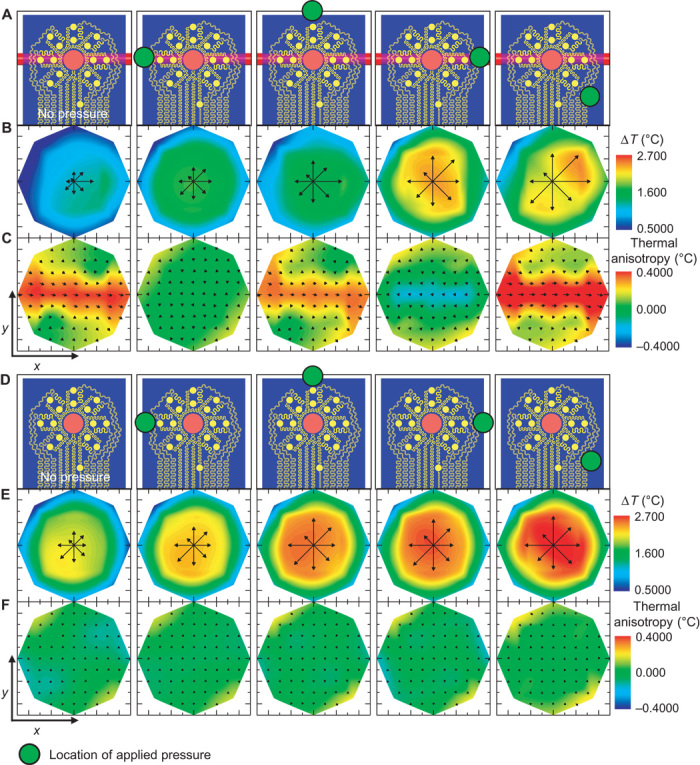
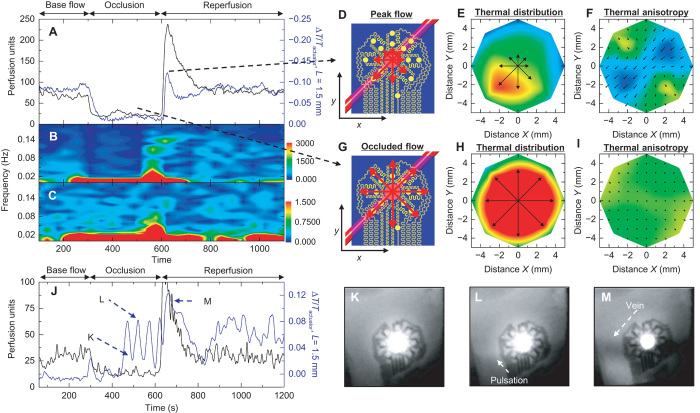
Location of pressure applied (60 s duration) with a cotton swab. (B) The local temperature distribution that follows heating for each pressure location. The temperature of the heater has been removed to improve the contrast. (C) Measured thermal anisotropy fields corresponding to the applied pressure illustration above. Computed color maps correspond to the calculated flow components in the x direction. (D to F) Similar analyses to (A) to (C), except that the device resides over a region of the forearm with no nearby large blood vessels.
Fig. 4
Fig. 4. Measurement of small-scale blood flow oscillations over an extended period.
The device resides on the volar aspect of the wrist, over a vein. The subject sits in a reclining chair in a relaxed state with no external stimuli for a 20-min period. (A and B) Changes in blood flow as measured by a laser speckle contrast imager (LSCI perfusion units, black) and our device (dimensionless flow, blue) for (A) t = 100 to 1200 s and (B) t = 1200 to 2400 s. The peaks in the two measurement techniques align well. (C and D) Fourier transform spectrogram for t = 100 to 2400 s determined from (C) LSCI data (FFT length = 128 s, five samples per second; the colorbar is the amplitude of the LSCI spectrogram) and (D) our device (FFT length = 128 s, two samples per second; the colorbar is the amplitude of the thermal anisotropy spectrogram).
Fig. 5
Fig. 5. Measurement of changes in local venous blood flow induced by occlusion and reperfusion of the forearm.
The device resides on the volar surface of the wrist, over a vein. Occlusion and reperfusion induce changes in blood flow. Occlusion with a pressure of ~200 mmHg (80 mmHg above systolic pressure) applied to the bicep begins at t = 300 s. Pressure is released at t = 600 s. (A) Changes in blood flow as measured by a laser speckle contrast imager (LSCI, black) and our device (blue). (B and C) Fourier transform spectrogram determined from (B) LSCI data (FFT length = 128 s, five samples per second; the colorbar is the amplitude of the LSCI spectrogram) and (C) our device (FFT length = 128 s, two samples per second; the colorbar is the amplitude of the thermal anisotropy spectrogram). (D) Illustration of the position of the vein relative to the device. The red arrows show the relative magnitudes of the thermal distribution at peak flow. (E and F) Full thermal distribution map (E) and flow field map (F) during peak flow as measured by our device. (G to I) Similar analyses as (D) to (F), except during occluded flow. (J) A similar experiment as in (A) but on a different subject with apparently deeper veins. Several strong pulsations of flow pulsations appear during occlusion, as measured with our device, but are entirely absent from the LSCI signal. (K to M) Infrared images confirm the result from our device, with examples shown at (K) a pulse trough, (L) a pulse peak (arrow indicates the appearance of downstream heating), and (M) reperfusion. (K) to (M) are uniformly contrast-enhanced to aid visualization. Time points of (K) to (M) are indicated in (J). Movie S3 shows the entire video result, which more clearly shows the changes.
Fig. 6
Fig. 6. Analysis of changes in local microcirculation induced by dermatographic urticaria and deep breathing.
(A) Photograph of slap-induced hyperemia and dermatographic urticaria on the forearm. formula image 
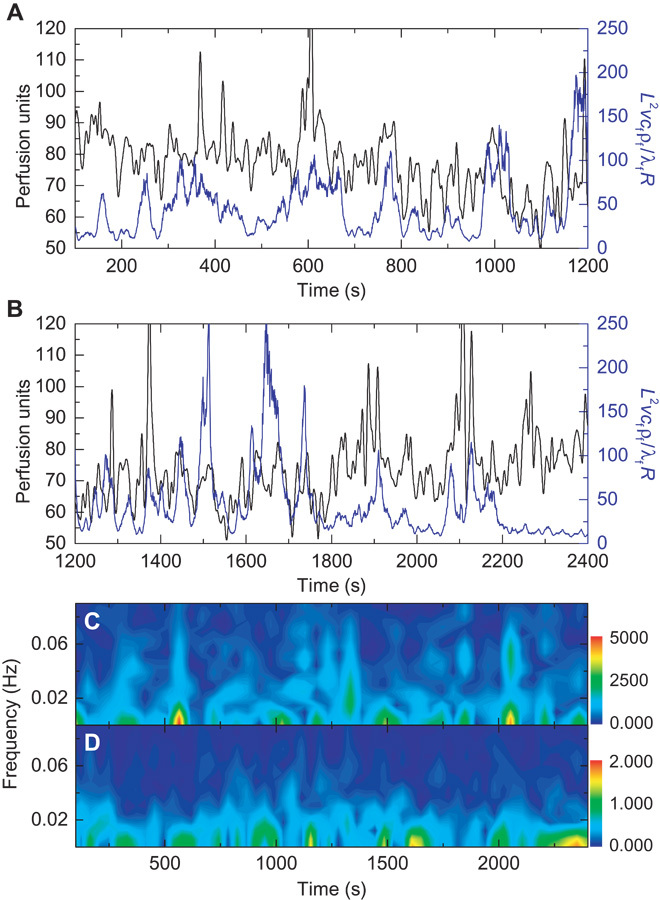
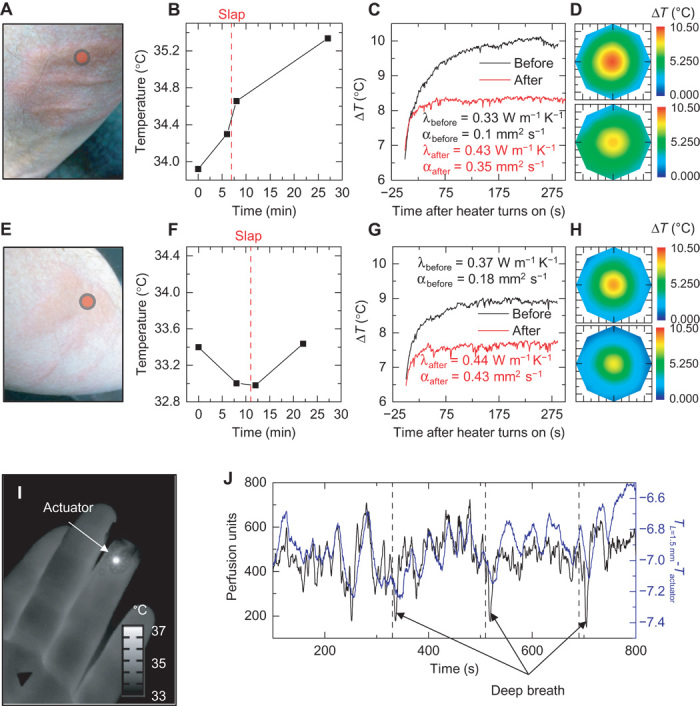
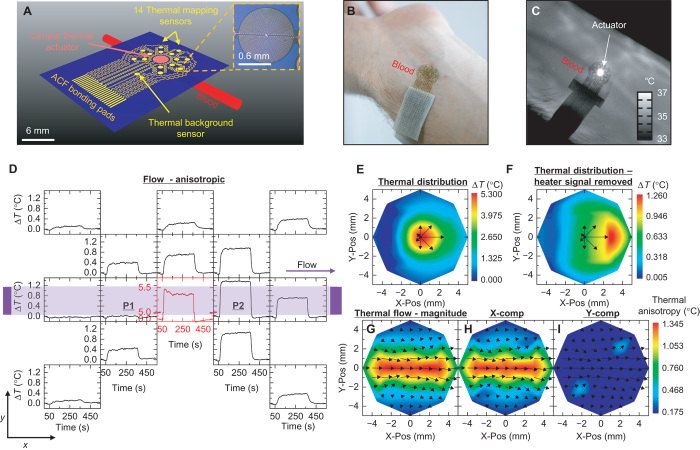
Location of the thermal actuator during measurement. (B) Temperature of the region of interest, measured by our device, before and after the onset of dermatographic urticaria. The vertical red dashed line indicates the time the slap was administered. (C) Temperature profile of the central heating element, with background temperature changes removed, before and after onset of dermatographic urticaria. A change in the time dynamics of heating indicates changes in the local heat transfer coefficient. Analysis of the time dynamics allows for calculation of the local thermal conductivity, λ, and thermal diffusivity, α, before and after the onset of dermatographic urticaria. (D) Heat distribution, as measured by our device 280 s after heating, before (top) and after (bottom) the onset of dermatographic urticaria. Even though the local tissue increases in temperature, the temperature rise of the thermal actuator is lower after trauma because of the increase in local heat transfer. (E to H) Similar analyses as shown in (A) to (D) on a different day and body location. (I) Infrared image of the device applied to the fingertip to monitor local changes in microcirculation. (J) Results from LSCI (black) and our device (blue; difference between actuator temperature and the average temperature of the inner ring of sensors). Periodic deep breathing (45-s breath holds) induces rapid dips in blood perfusion, measured by both LSCI and our device.
Fig. 7
Fig. 7. Pulsed heating as an operation mode that reduces environmental effects and power consumption.
The device resides on the volar aspect of the wrist, over a vein, during a reactive hyperemia protocol. Occlusion with a pressure cuff at the bicep, at 200 mmHg, begins at t = 400 s and ends at t = 700 s. The thermal actuator operates in a pulsed mode, as opposed to the continuous mode shown in prior figures. (A) Infrared images of pulsed heating during one cycle. (B) LSCI signal measured at a point above the vein, subject to a 0.2-Hz low-pass filter. (C) Temperature of the thermal actuator, which continuously oscillates throughout the experiment as a square wave with a 33% duty cycle, a frequency of 0.067 Hz, a 1-mA offset, and a 2-mA peak-to-peak amplitude. (D) The differential temperature measured by sensors on opposing sides of the actuator, along the vein, with L = 1.5 mm. (E) Fourier transform spectrogram of (C). The signal at 0.067 Hz is strong before and after occlusion and diminishes during occlusion owing to loss of anisotropy with loss of venous blood flow. (F) Relative amplitude of the signal at 0.067 Hz, extracted from (D). Frequency locked analysis allows for removal of drift in exchange for decreased time resolution.

References

    1. Shpilfoygel S. D., Close R. A., Valentino D. J., Duckwiler G. R., X-ray videodensitometric methods for blood flow and velocity measurement: A critical review of literature. Med. Phys. 27, 2008–2023 (2000). - PubMed
    1. Flammer A. J., Anderson T., Celermajer D. S., Creager M. A., Deanfield J., Ganz P., Hamburg N. M., Lüscher T. F., Shechter M., Taddei S., Vita J. A., Lerman A., The assessment of endothelial function: From research into clinical practice. Circulation 126, 753–767 (2012). - PMC - PubMed
    1. Petrofsky J. S., Resting blood flow in the skin: Does it exist, and what is the influence of temperature, aging, and diabetes? J. Diabetes Sci. Technol. 6, 674–685 (2012). - PMC - PubMed
    1. Wright C. I., Kroner C. I., Draijer R., Non-invasive methods and stimuli for evaluating the skin’s microcirculation. J. Pharmacol. Toxicol. Methods 54, 1–25 (2006). - PubMed
    1. Petrie J. R., Ueda S., Morris A. D., Murray L. S., Elliott H. L., Connell J. M. C., How reproducible is bilateral forearm plethysmography? Br. J. Clin. Pharmacol. 45, 131–139 (1998). - PMC - PubMed