. 2015 Oct 30;1(9):e1500738.
doi: 10.1126/sciadv.1500738. eCollection 2015 Oct.

Spectrometer-free vibrational imaging by retrieving stimulated Raman signal from highly scattered photons

Affiliations

Spectrometer-free vibrational imaging by retrieving stimulated Raman signal from highly scattered photons

Chien-Sheng Liao et al. Sci Adv. .

Abstract

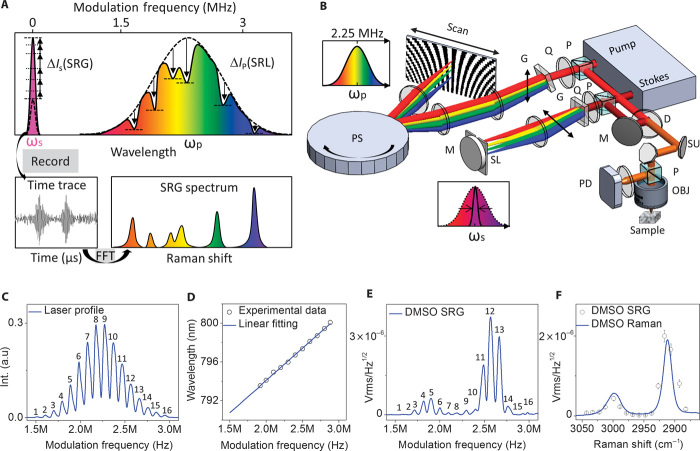
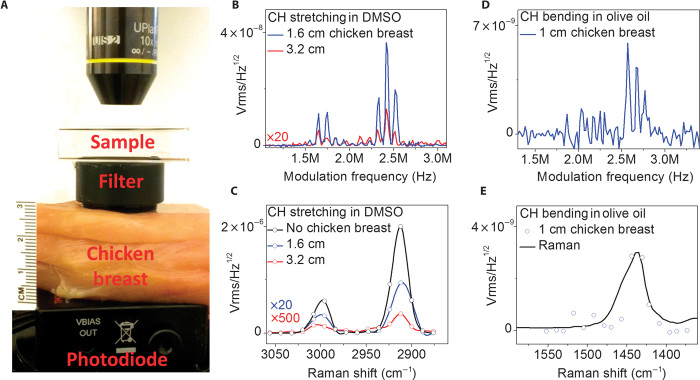
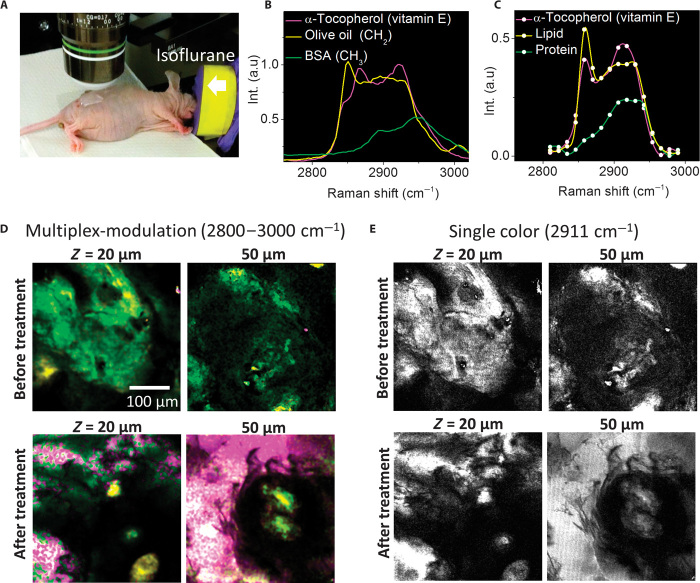
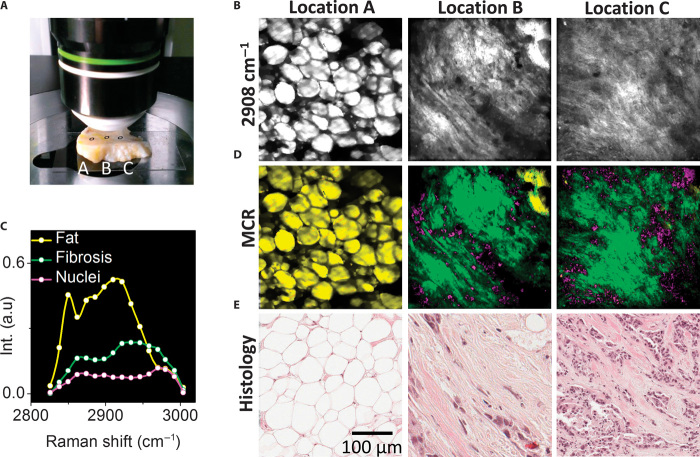
In vivo vibrational spectroscopic imaging is inhibited by relatively slow spectral acquisition on the second scale and low photon collection efficiency for a highly scattering system. Recently developed multiplex coherent anti-Stokes Raman scattering and stimulated Raman scattering techniques have improved the spectral acquisition time down to microsecond scale. These methods using a spectrometer setting are not suitable for turbid systems in which nearly all photons are scattered. We demonstrate vibrational imaging by spatial frequency multiplexing of incident photons and single photodiode detection of a stimulated Raman spectrum within 60 μs. Compared to the spectrometer setting, our method improved the photon collection efficiency by two orders of magnitude for highly scattering specimens. We demonstrated in vivo imaging of vitamin E distribution on mouse skin and in situ imaging of human breast cancerous tissues. The reported work opens new opportunities for spectroscopic imaging in a surgical room and for development of deep-tissue Raman spectroscopy toward molecular level diagnosis.

Keywords: Raman spectroscopy; label-free microscopy; molecular vibration.


Figures

Fig. 1
Fig. 1. Stimulated Raman spectroscopic imaging by spatial frequency multiplexing and single photodiode detection.
(A) Principle. Every color of the pump laser was modulated at a specific megahertz frequency. Through the SRG process, the modulation frequency transferred to the Stokes beam. A time trace was recorded, from which fast Fourier transform was performed to retrieve an SRG spectrum. (B) A lab-built multiplex-modulation SRS microscope. D, dichroic mirror; G, grating; SU, scanning unit; M, mirror; OBJ, objective; P, polarizing beam splitter; PD, photodiode; PS, polygon scanner; Q, quarter waveplate; SL, slit. (C) Modulated pump laser intensity as a function of modulation frequency. (D) Linear relation between wavelength and modulation frequency. (E) SRG intensity as a function of modulation frequency. (F) Retrieved SRG spectrum (circles) and spontaneous Raman spectrum (solid line).
Fig. 2
Fig. 2. Microsecond-scale acquisition of SRG spectra from completely diffused photons.
(A) Experiment configuration. (B) SRG intensity of DMSO as a function of modulation frequency with 1.6- or 3.2-cm chicken breast tissues before photodiode. (C) Calibrated SRG spectra of DMSO. (D) SRG intensity of olive oil as a function of modulation frequency with 1.0-cm chicken breast tissues before photodiode. (E) Calibrated SRG spectra of olive oil. The integration time was 60 μs.
Fig. 3
Fig. 3. In vivo monitoring of vitamin E distribution on mouse skin.
(A) Experiment configuration. The nude mouse was anesthetized with isoflurane. (B)Spontaneous Raman spectra of vitamin E, olive oil (rich in CH2), and bovine serum albumin (rich in CH3). (C) MCR output spectra of three components assigned to lipid, protein, and vitamin E. (D) MCR concentration maps of lipid (in yellow) and protein (in green) before and after the treatment. (E) SRG images at 2911 cm−1. The pixel dwell time was 60 μs. Scale bar, 100 μm.
Fig. 4
Fig. 4. In situ mapping of human patient breast cancer and stroma.
(A) Digital picture of a 5-mm-thick human breast cancerous tissue. (B) SRG images of locations indicated in (A) at 2908 cm−1. (C) MCR output spectra of three components assigned to fat, fibrosis, and cell nuclei. (D) MCR concentration maps of fat (in yellow), fibrosis (in green), and cell nuclei (in pink). (E) Histological analysis (H&E staining) of the same tissue. The pixel dwell time was 600 μs. Scale bar, 100 μm.

References

    1. Wei L., Hu F., Shen Y., Chen Z., Yu Y., Lin C.-C., Wang M. C., Min W., Live-cell imaging of alkyne-tagged small biomolecules by stimulated Raman scattering. Nat. Methods 11, 410–412 (2014). - PMC - PubMed
    1. Lee H. J., Zhang W. D., Zhang D. L., Yang Y., Liu B., Barker E. L., Buhman K. K., Slipchenko L. V., Dai M., Cheng J.-X., Assessing cholesterol storage in live cells and C. elegans by stimulated Raman scattering imaging of phenyl-diyne cholesterol. Sci. Rep. 5, 7930 (2015). - PMC - PubMed
    1. Hong S., Chen T., Zhu Y., Li A., Huang Y., Chen X., Live-cell stimulated Raman scattering imaging of alkyne-tagged biomolecules. Angew. Chem. Int. Ed. 53, 5827–5831 (2014). - PubMed
    1. Kong L., Ji M., Holtom G. R., Fu D., Freudiger C. W., Xie X. S., Multicolor stimulated Raman scattering microscopy with a rapidly tunable optical parametric oscillator. Opt. Lett. 38, 145–147 (2013). - PMC - PubMed
    1. Evans C. L., Potma E. O., Puoris’haag M., Côté D., Lin C. P., Xie X. S., Chemical imaging of tissue in vivo with video-rate coherent anti-Stokes Raman scattering microscopy. Proc. Natl. Acad. Sci. U.S.A. 102, 16807–16812 (2005). - PMC - PubMed