. 2015 Dec 1;22(6):1068-77.
doi: 10.1016/j.cmet.2015.09.025. Epub 2015 Oct 23.

Oncogenic Myc Induces Expression of Glutamine Synthetase through Promoter Demethylation

Affiliations

Oncogenic Myc Induces Expression of Glutamine Synthetase through Promoter Demethylation

Alex J Bott et al. Cell Metab. .

Abstract

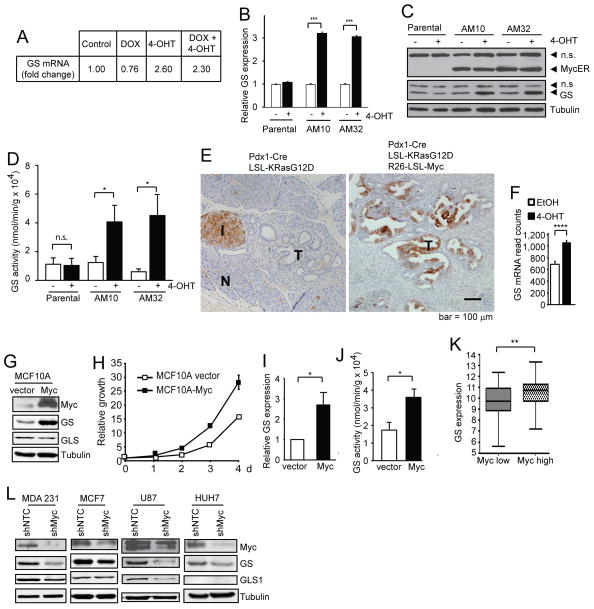
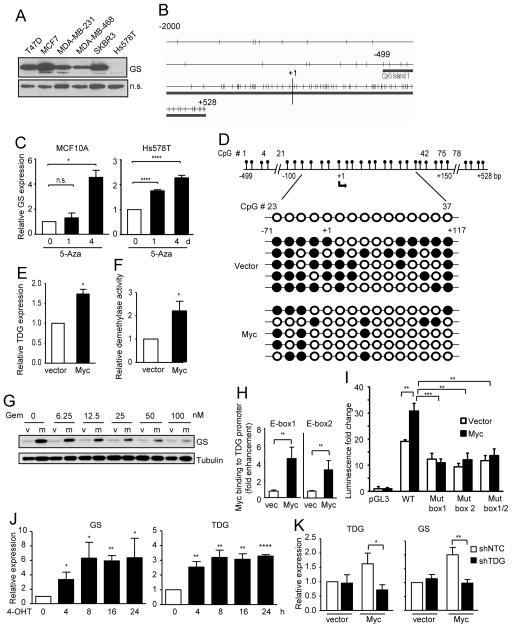
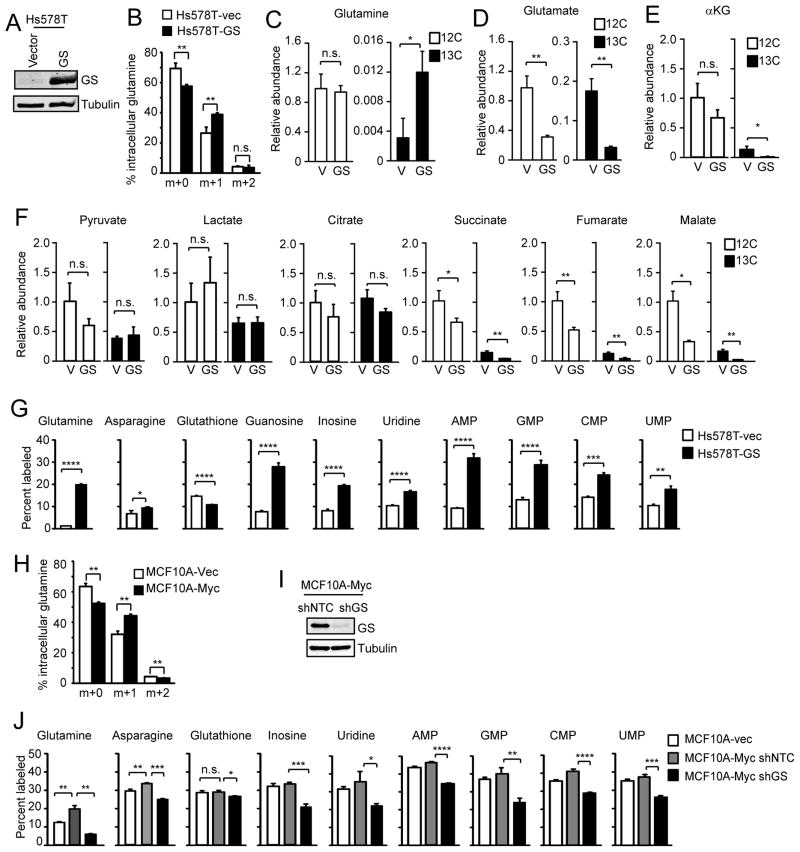
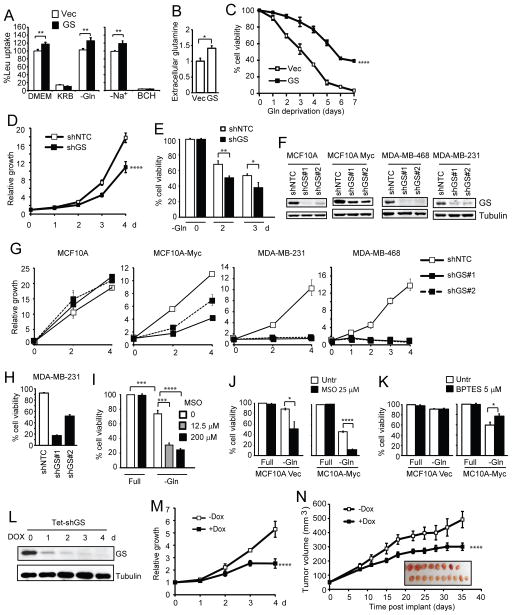
c-Myc is known to promote glutamine usage by upregulating glutaminase (GLS), which converts glutamine to glutamate that is catabolized in the TCA cycle. Here we report that in a number of human and murine cells and cancers, Myc induces elevated expression of glutamate-ammonia ligase (GLUL), also termed glutamine synthetase (GS), which catalyzes the de novo synthesis of glutamine from glutamate and ammonia. This is through upregulation of a Myc transcriptional target thymine DNA glycosylase (TDG), which promotes active demethylation of the GS promoter and its increased expression. Elevated expression of GS promotes cell survival under glutamine limitation, while silencing of GS decreases cell proliferation and xenograft tumor growth. Upon GS overexpression, increased glutamine enhances nucleotide synthesis and amino acid transport. These results demonstrate an unexpected role of Myc in inducing glutamine synthesis and suggest a molecular connection between DNA demethylation and glutamine metabolism in Myc-driven cancers.


Figures

Figure 1
Figure 1. Myc upregulates GS expression
(A–D) FL5.12 parental cells and the AM clones (AM10 and AM32) were cultured in the control medium, with Dox to activate Akt, or 4-OHT to activate Myc, or both, for 36 h. Fold change of GS transcript by mouse cDNA array is shown (A). Relative GS transcript level determined by qRT-PCR is shown as the mean plus SEM of a representative experiment performed in triplicates (B). Cell lysates were analyzed by immunoblotting (C). GS activity was determined and is shown as the mean plus SEM of at least 5 independent experiments (D). (E) Pancreata from 2-month old Pdx1-Cre; LSL-KRasG12D (n = 4) and age-matched Pdx1-Cre; LSL-KRasG12D; R26-LSL-MYC (n = 4) mice were stained for GS by IHC. I: Islets; N: normal tissue; T: tumors. Note that normal islet stains positive for GS. (F) Murine lung tumor cells derived from viral-Cre induced LSL-KRasG12D; p53fl/fl mice were infected with pBabe-MycERT2 and treated for 24 h with ethanol vehicle or 100 nM 4-OHT. mRNA was subjected to Illumina sequencing. GS mRNA levels are expressed as number of sequencing reads (Mean plus SD (n=4)). (G–J) MCF10A cells were stably transfected with vector or pBabe-c-Myc. Cells were subjected to immunoblotting (G). Cell growth was measured and shown as the mean plus SD of a representative experiment of three independent experiments performed in triplicates (H). GS transcript level analyzed by qRT-PCR is shown as the mean plus SEM of 3 independent experiments performed in duplicates (I). GS activity is shown as the mean plus SEM of 3 independent experiments (J). (K) Differential expression levels of GS in Myc-high and Myc-low groups in T-cell lymphoma. Shown are box plots of expression levels of GS. The Myc high and Myc low groups were defined by Myc expression above or below the median level. (L) Indicated cell lines were stably infected with indicated shRNAs and subjected to immunoblotting.
Figure 2
Figure 2. Myc upregulates GS expression via TDG-mediated demethylation of GS promoter
(A) Indicated breast cancer cell lines were probed for GS expression. (B) Schematic representation of the CpG distribution in the 5′-regulatory region of the GLUL gene from the CpG Island Searcher (http://www.cpgislands.com). The CpG sites are represented by vertical tick marks, and the beginning of exon 1 is depicted as “+1”. (C) MCF10A cells and Hs578T cells were treated with 20 μM 5-azacytidine (5-Aza). GS transcript level determined via qRT-PCR is shown as the mean plus SEM of a representative experiment performed in triplicates. (D) Single cell clones of vector control and Myc-expressing MCF10A cells were established by limited dilution. The GS promoter was PCR amplified in 5 clones of each cell type, and analyzed by bisulfate sequencing. The schematics of the sequencing results and the human GS promoter with the numbered CpGs are shown. Open and filled circles indicate unmethylated and methylated cytosines, respectively. (E) TDG transcript level in Myc-expressing MCF10A cells was analyzed by qRT-PCR and is shown as the mean plus SEM of 5 independent experiments performed in triplicates. (F) DNA demethylase activity was determined in Myc-expressing MCF10A cells and shown as the mean plus SEM of 4 independent experiments. (G) Vector control (v) and Myc-expressing (m) MCF10A cells were treated with gemcitabine for 24 h, and subjected to immunoblotting. (H) The level of Myc binding to the TDG promoter in Myc-expressing MCF10A cells was analyzed by ChIP assay using the Myc antibody followed by PCR of two specific regions within the promoter (PCR#1 and PCR#2). Fold enhancement represents the abundance of enriched DNA fragments over an IgG control. (I) MCF10A cells were transfected with the luciferase reporters driven by the pGL3 control vector, the wild-type TDG promoter, or the TDG promoter mutants with the two E-boxes mutated individually or simultaneously, together with a renilla luciferase construct. Luciferase activity in cell lysates was quantified after 24 h, and standardized based on renilla luciferase activity and normalized to that of the pGL3-transfected cells (Mean plus SD of a representative experiment performed in triplicates). (J) FL5.12-AM32 cells were cultured in 4-OHT to induce Myc activation. Transcript levels of GS and TDG determined by qRT-PCR are shown as the mean plus SEM from 2 independent experiments performed in triplicates. (K) MCF10A cells were stably infected with indicated shRNAs. TDG transcript level was analyzed by qRT-PCR (Mean plus SEM of an experiment performed in triplicates).
Figure 3
Figure 3. GS leads to increased cataplerotic flux towards glutamine synthesis and promotes nucleotide synthesis
(A) Hs578T cells were stably transfected with vector control or GS. (B) Cells were labeled with 15N-NH4Cl for 6 h in glutamine-deficient media and nitrogen incorporation into glutamine was determined by GC-MS. Fractions of glutamine isotopologues were normalized for stable isotope natural abundances. (C–F) Metabolic tracing analysis of the GS-expressing Hs578T cells. Cells were cultured in glutamine-free medium for 16 h before labeling with 12.5 mM 13C-glucose for 6 h in glutamine-free medium. Relative abundance of 12C and 13C in each metabolite pool was measured by GC-MS, and is expressed relative to the internal standard and protein content in each sample normalized to the value of 12C fraction in vector control cells (C: glutamine, D: glutamate, E: α-KG, F: other indicated metabolites). All data represent total labeling, i.e. all isotopologues. Shown is the mean plus SD from 3 (in some cases 2) samples. (G) Cells were labeled for 16 h with 15N-NH4Cl in glutamine-replete (2 mM) medium and subjected to LC-MS. Percent of each 15N labeled molecule is shown. All data represent total labeling (Mean plus SD from 3 individual samples). (H) MCF10A cells were labeled with 15N-NH4Cl for 6 h in glutamine-free medium and nitrogen incorporation into glutamine was determined by GC-MS. Total pool of glutamine was normalized for stable isotope natural abundances. (I and J) MCF10A cells were stably infected with indicated shRNAs. (I) Successful GS silencing is shown. (J) Cells were labeled for 16 h with 15N-NH4Cl in glutamine-replete (2 mM) medium and subjected to LC-MS. Percent of each 15N labeled molecule is shown. All data represent total labeling (Mean plus SD from a representative of three independent experiments performed in triplicate).
Figure 4
Figure 4. GS promotes amino acid uptake and tumorigenesis
(A) Hs578T cells were tested for leucine uptake at basal conditions, under amino acid withdrawal (KRB), and under glutamine deprivation alone for 5 h. System L-dependent uptake of leucine was assayed in EBSS without sodium and confirmed by the use of the System L inhibitor BCH. (B) Extracellular glutamine levels in media from Hs578T cells. Concentration was normalized to protein concentration and displayed as a fold change from vector cells (Mean plus SD of two experiments performed in triplicates). (C) Hs578T cells were cultured in glutamine-free medium. Cell viability is shown as the mean plus SD of three independent experiments. (D and E) Myc-expressing MCF10A cells with shNTC or shGS were cultured in complete (D) or glutamine-free medium (E). Cell growth (D) and cell viability (E) were measured. (F and G) Indicated cell lines were stably infected with two independent GS shRNAs. Successful silencing is shown (F). Cells growth in complete medium was measured (G). (H) MDA-MB-231 cells infected with two individual GS shRNAs were measured for spontaneous cell death. (I) Myc-expressing MCF10A cells were cultured in complete or glutamine-free medium, in the absence or presence of the GS inhibitor methionine sulfoximine (MSO). Cell viability was measured 48 h later. (J and K) MCF10A cells were cultured in complete or glutamine-free medium, in the absence or presence MSO (J) or the GLS inhibitor BPTES (K). Cell viability was measured 48 h later. (L-N) MDA-MB-468 cells were stably infected with a Tet-inducible shRNA for GS, and subjected to immunoblotting (L). Cell growth was measured (M). Cells were injected subcutaneously into both flanks of athymic nude mice. Mice were fed without (n = 8) or with (n = 10) doxycycline hyclate (1 mg/ml). Average tumor size plus SEM is shown. Images of tumors are shown in the insert.

References

    1. Biolo G, Zorat F, Antonione R, Ciocchi B. Muscle glutamine depletion in the intensive care unit. The international journal of biochemistry & cell biology. 2005;37:2169–2179. - PubMed
    1. Dang CV. Links between metabolism and cancer. Genes Dev. 2012;26:877–890. - PMC - PubMed
    1. DeBerardinis RJ, Cheng T. Q’s next: the diverse functions of glutamine in metabolism, cell biology and cancer. Oncogene. 2010;29:313–324. - PMC - PubMed
    1. DeBerardinis RJ, Lum JJ, Hatzivassiliou G, Thompson CB. The biology of cancer: metabolic reprogramming fuels cell growth and proliferation. Cell Metab. 2008;7:11–20. - PubMed
    1. DeBerardinis RJ, Mancuso A, Daikhin E, Nissim I, Yudkoff M, Wehrli S, Thompson CB. Beyond aerobic glycolysis: transformed cells can engage in glutamine metabolism that exceeds the requirement for protein and nucleotide synthesis. Proc Natl Acad Sci U S A. 2007;104:19345–19350. - PMC - PubMed

Publication types

MeSH terms