. 2015 Nov;3(11):e12616.
doi: 10.14814/phy2.12616. Epub 2015 Nov 24.

Cytoskeletal changes induced by allosteric modulators of calcium-sensing receptor in esophageal epithelial cells

Affiliations

Cytoskeletal changes induced by allosteric modulators of calcium-sensing receptor in esophageal epithelial cells

Solange Abdulnour-Nakhoul et al. Physiol Rep. 2015 Nov.

Abstract

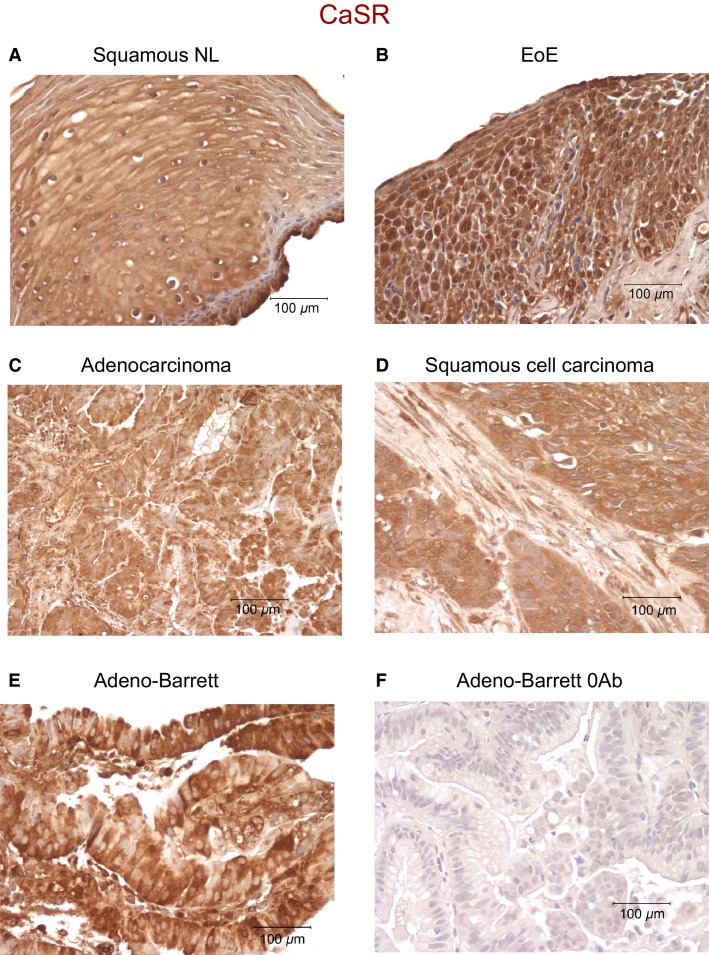
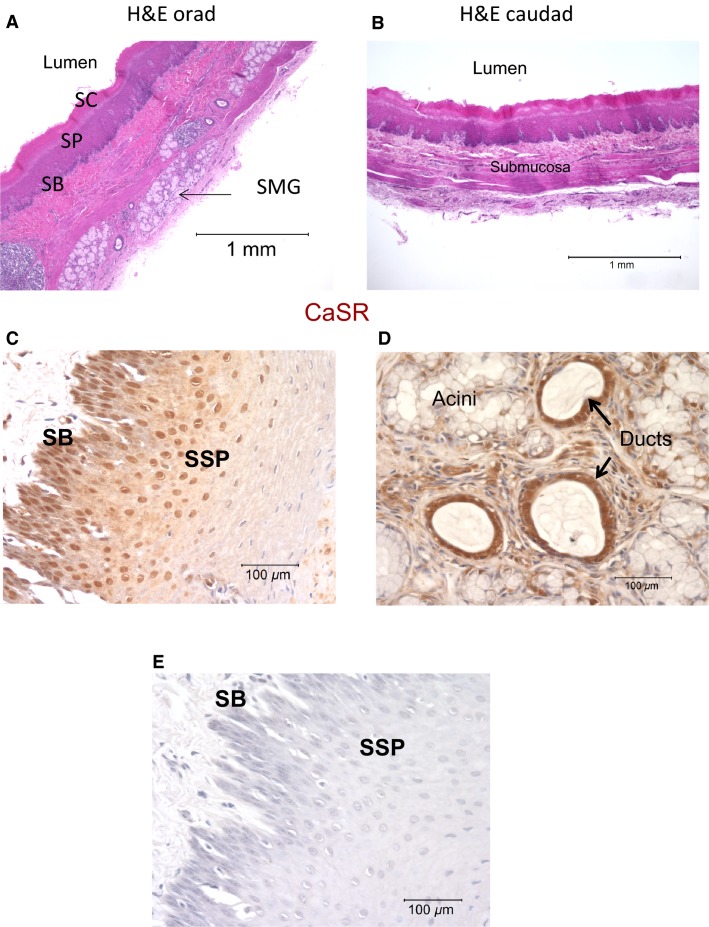
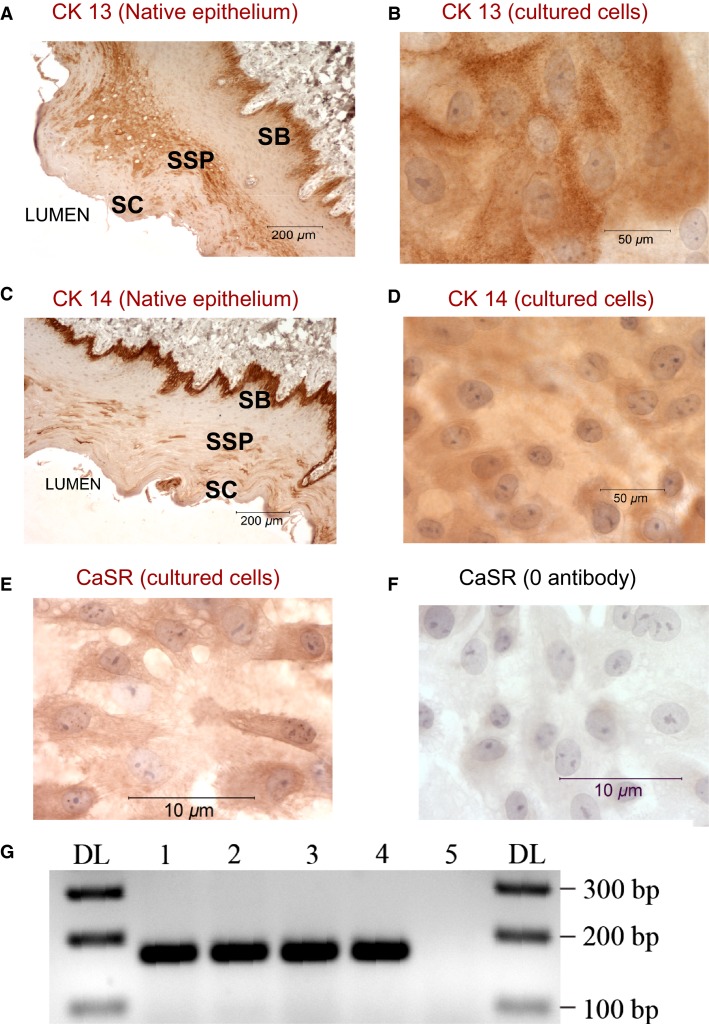
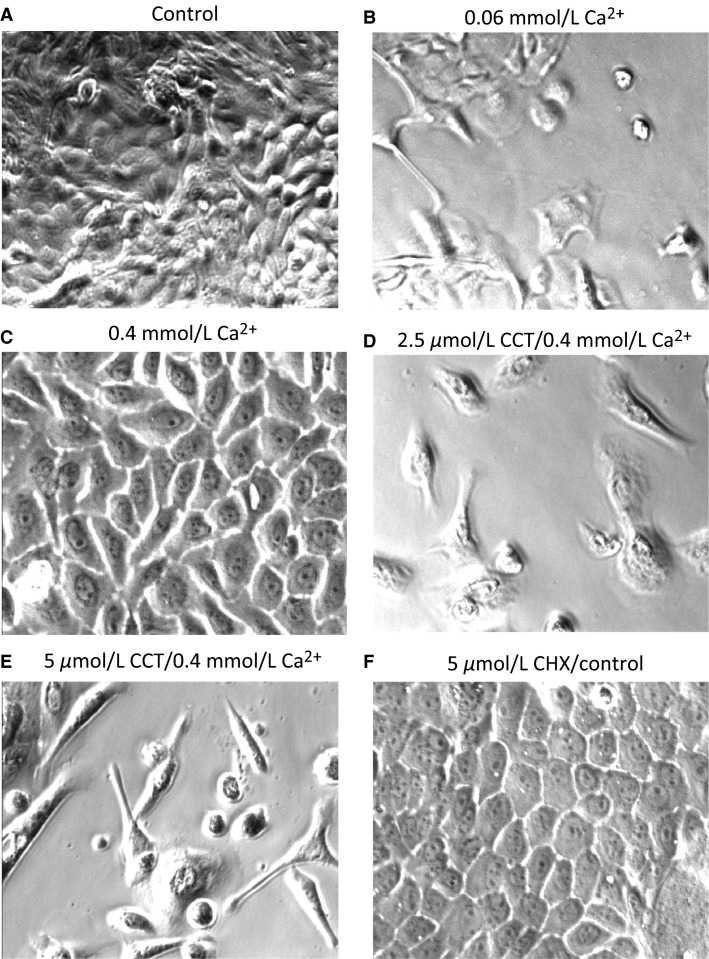
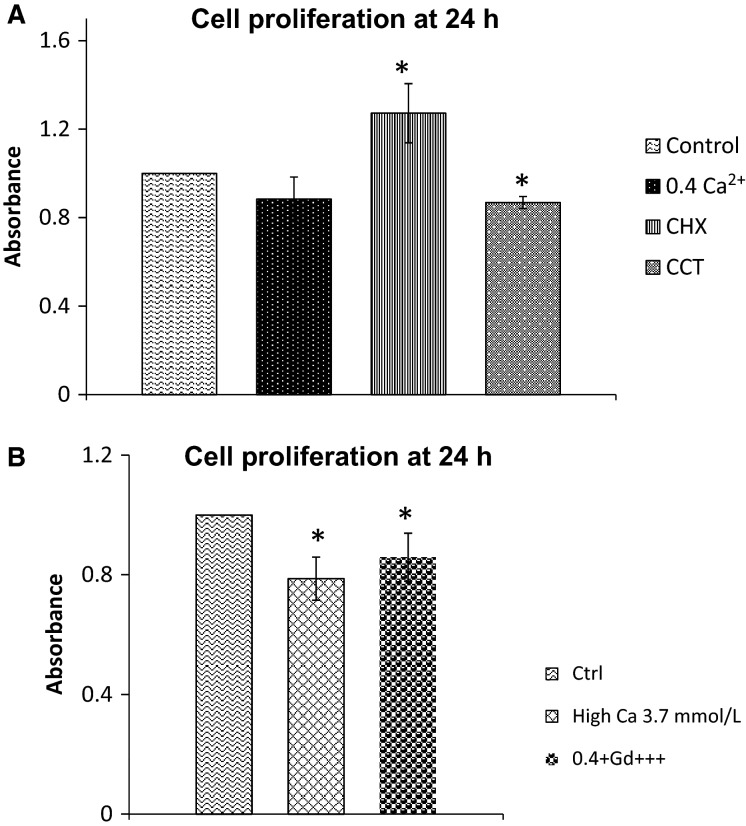
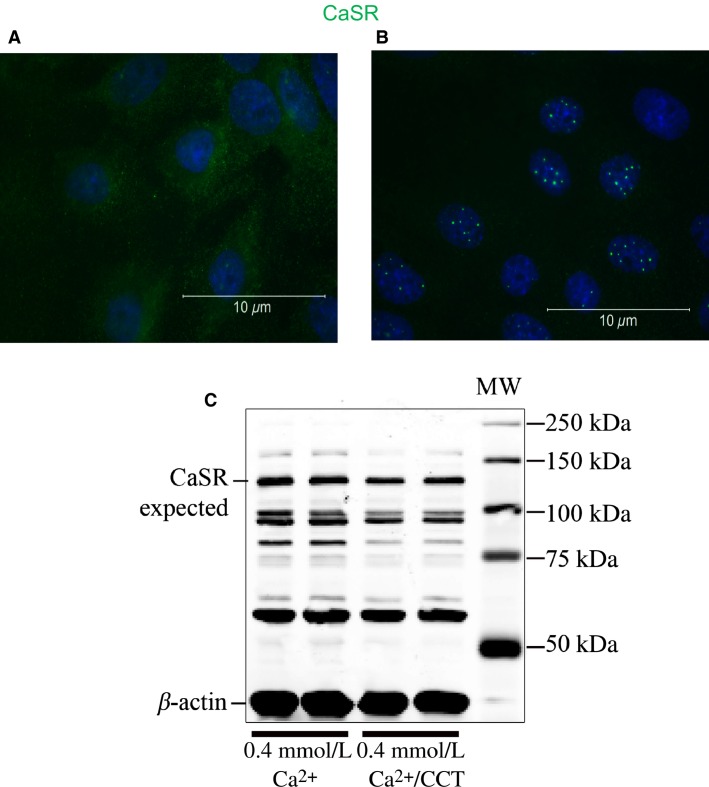
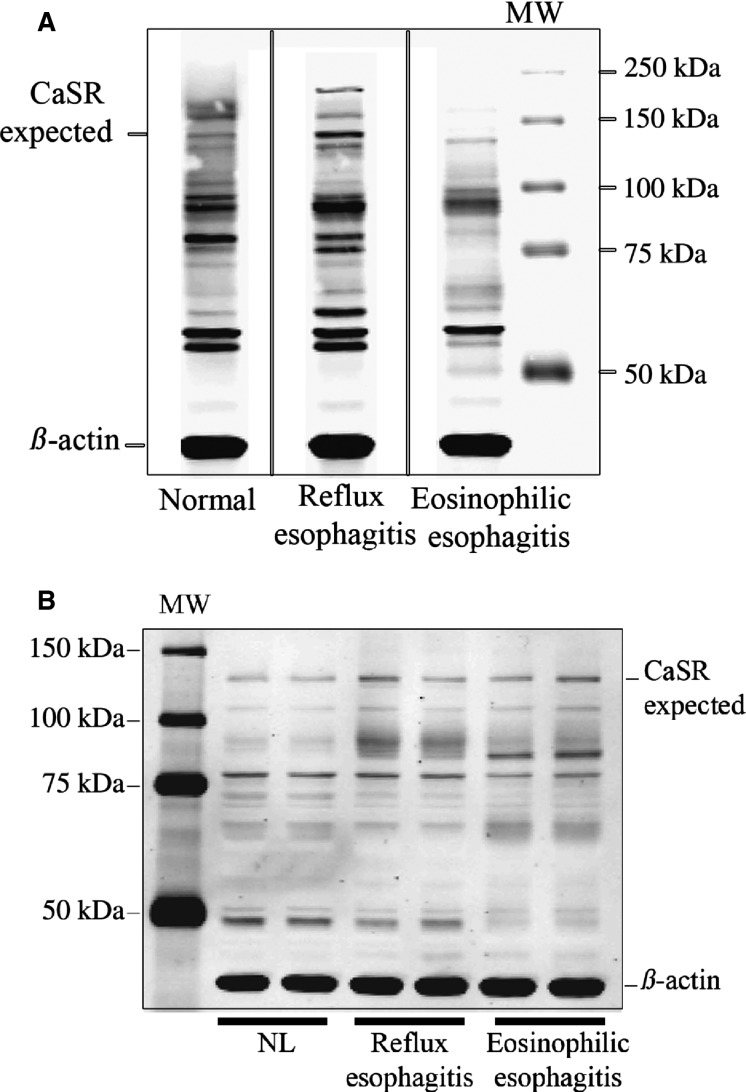
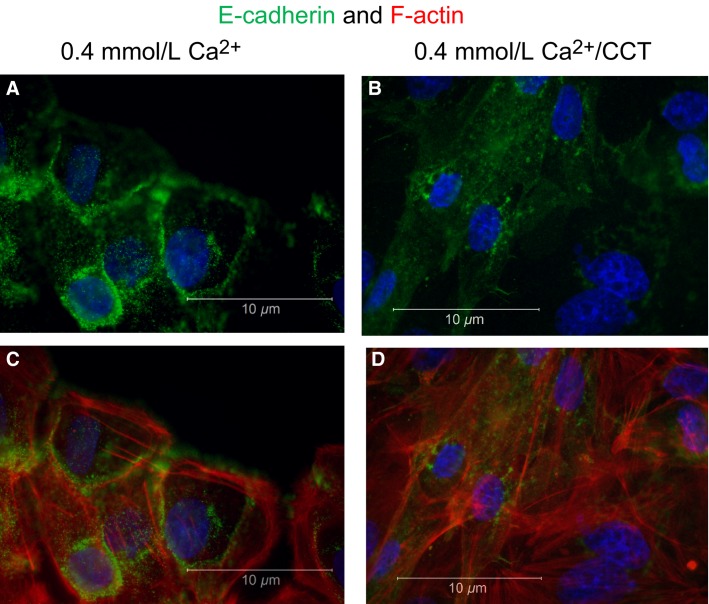
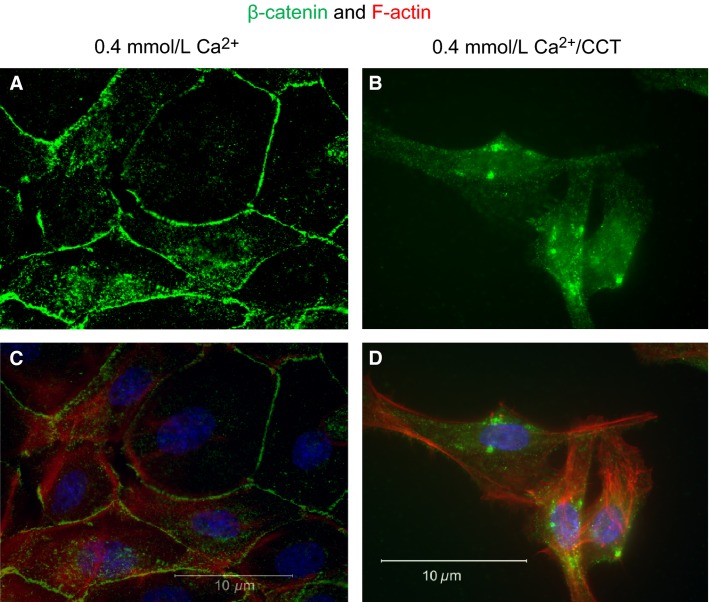
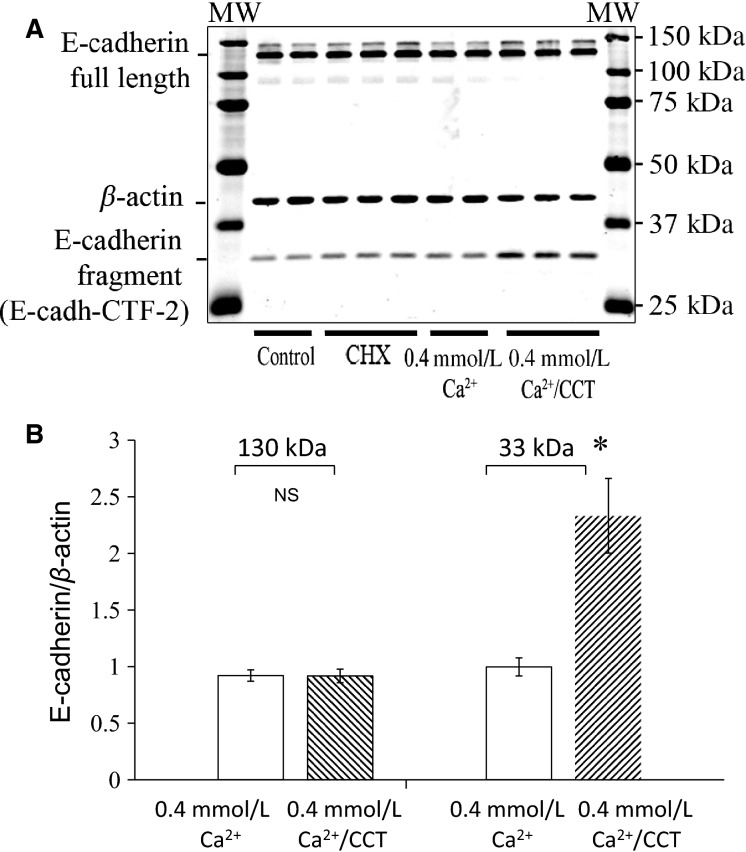
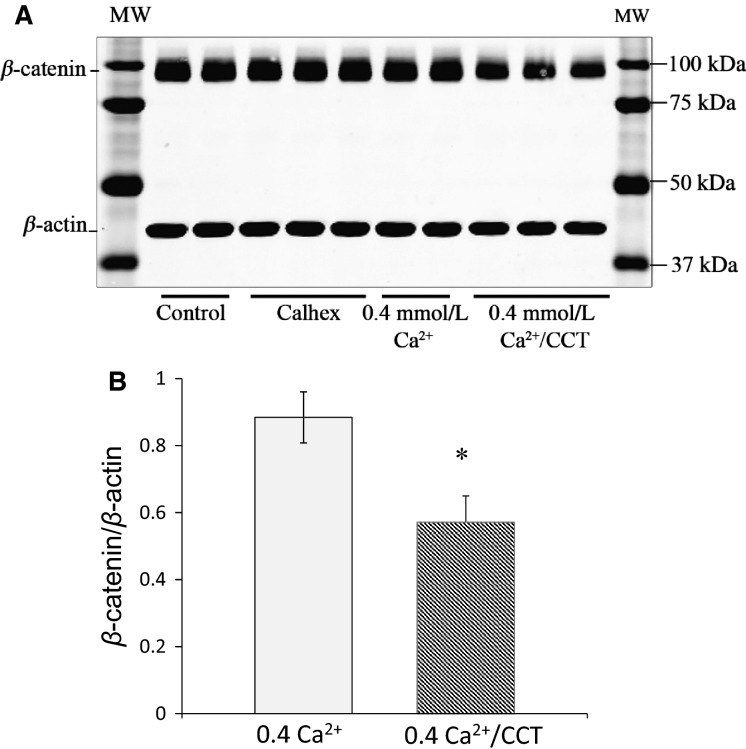
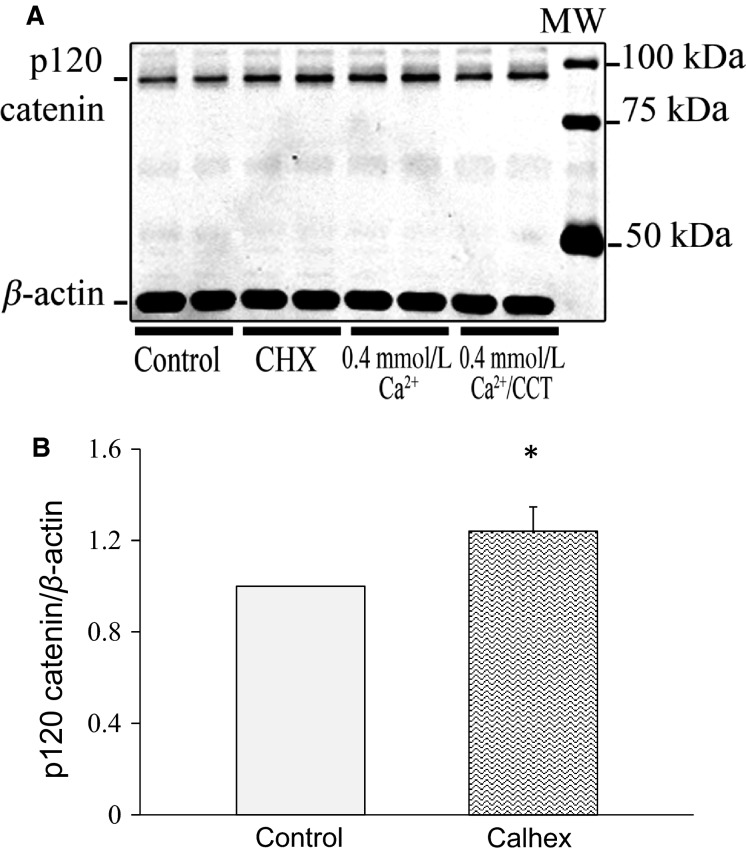
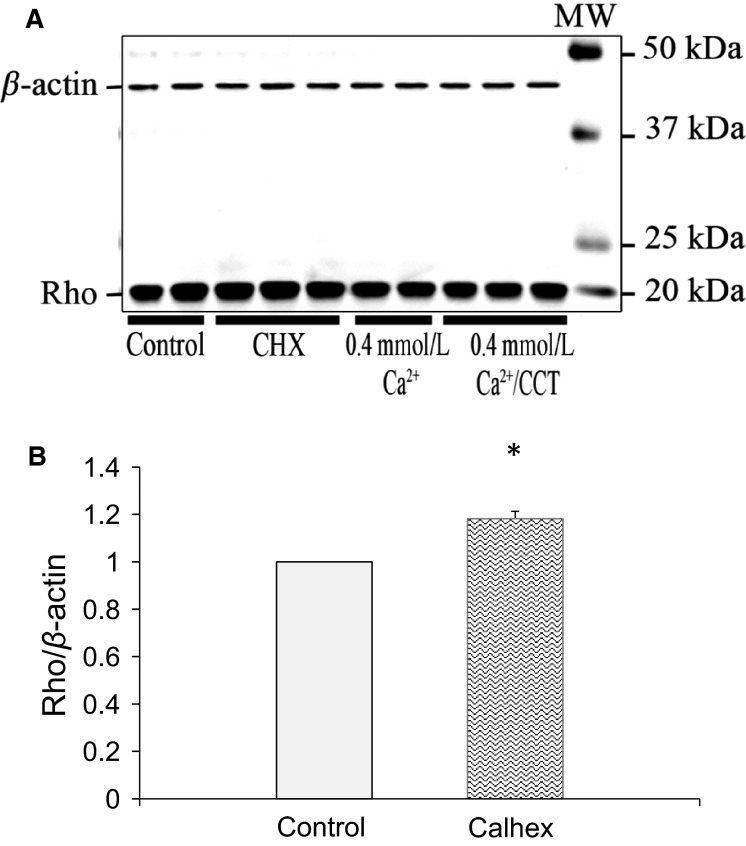
The calcium-sensing receptor (CaSR), a G-protein-coupled receptor, plays a role in glandular and fluid secretion in the gastrointestinal tract, and regulates differentiation and proliferation of epithelial cells. We examined the expression of CaSR in normal and pathological conditions of human esophagus and investigated the effect of a CaSR agonist, cinacalcet (CCT), and antagonist, calhex (CHX), on cell growth and cell-cell junctional proteins in primary cultures of porcine stratified squamous esophageal epithelium. We used immunohistochemistry and Western analysis to monitor expression of CaSR and cell-cell adhesion molecules, and MTT assay to monitor cell proliferation in cultured esophageal cells. CCT treatment significantly reduced proliferation, changed the cell shape from polygonal to spindle-like, and caused redistribution of E-cadherin and β-catenin from the cell membrane to the cytoplasm. Furthermore, it reduced expression of β-catenin by 35% (P < 0.02) and increased expression of a proteolysis cleavage fragment of E-cadherin, Ecad/CFT2, by 2.3 folds (P < 0.01). On the other hand, CHX treatment enhanced cell proliferation by 27% (P < 0.01), increased the expression of p120-catenin by 24% (P < 0.04), and of Rho, a GTPase involved in cytoskeleton remodeling, by 18% (P < 0.03). In conclusion, CaSR is expressed in normal esophagus as well as in Barrett's, esophageal adenocarcinoma, squamous cell carcinoma, and eosinophilic esophagitis. Long-term activation of CaSR with CCT disrupted the cadherin-catenin complex, induced cytoskeletal remodeling, actin fiber formation, and redistribution of CaSR to the nuclear area. These changes indicate a significant and complex role of CaSR in epithelial remodeling and barrier function of esophageal cells.

Keywords: Adherens junction; E‐cad/CTF2; calcimimetics; esophagus; stratified squamous epithelium.


Figures

Figure 1
Figure 1
CaSR expression in human esophageal tissues. Positive staining for CaSR is indicated by brown deposits. (A) shows a section from a normal (NL) esophageal biopsy, (B) biopsy from eosinophilic esophagitis patient (EoE), (C) adenocarcinoma, (D) squamous cell carcinoma, (E) Barrett’s adenocarcinoma. All sections were positive for CaSR indicating the presence of the receptor in the esophageal tissues. (F) shows an esophageal section where the primary antibody was omitted from the staining procedure. The experiment was repeated three times using samples from two adenocarcinoma patients, two adenocarcinoma with Barrett’s patients, three squamous cell carcinoma patients, three eosinophilic esophagitis, and three normal patients.
Figure 2
Figure 2
Porcine esophageal histology and CaSR expression by immunohistochemistry (A) Cross section from orad region of the pig esophagus stained with H&E showing submucosal glands (SMG); SB (stratum basalis), SSP (stratum spinosum), SC (stratum corneum). (B), Cross section from caudad region devoid of glands. (C), Immunostaining of CaSR (brown deposits) in the stratified squamous epithelium. CaSR is distributed in the basal and suprabasal layers. (D), shows staining for CaSR in submucosal glands and strong expression in the ducts. The experiment was repeated three times using tissues from three different pigs. (E) shows a tissue section where the primary antibody was omitted from the staining procedure.
Figure 3
Figure 3
Characterization of the cells in culture. CK13 and CK 14 staining of esophageal section (A and C respectively) and of cultured squamous cells (B and D). Brown deposits indicate positive staining in basal and suprabasal layers of the epithelium. Cells in culture also stained positive for CK13 and Ck14 indicating their similarity to epithelial cells of the esophagus. Representative data from 3 different experiments. SB (stratum basalis), SSP (stratum spinosum), SC (stratum corneum). E) CaSR expression in cultured esophageal cells by IHC. (E), shows immunostaining of SSE cells grown in control 1.2 mmol/L Ca+2. SSE cells stained positive for CaSR (brown deposits). (F), negative control, the primary antibody to CaSR was omitted from immunostaining procedure. (G), RT-PCR amplification of CaSR products performed on extracted total RNA: lane 1, cultured cells from esophageal submucosal glands (SMG); lane 2, cultured cells from squamous epithelium, lane 3, native squamous esophageal tissue; lane 4, esophageal submucosal glands (SMG). Lane 5 is a negative control where all the reactants (as in lane 3) are present but Taq polymerase was omitted from the reaction. The first and last lanes are DNA ladder. A prominent band at the expected size of 170 bp confirmed the expression of CaSR in squamous esophageal tissue, SMG, and in cultures derived from these tissues. The sequences of the products are shown in Table2. Representative data are from four different experiments.
Figure 4
Figure 4
Effect of cinacalcet (CCT) and calhex (CHX) treatment on cultured squamous cells morphology. (A), the cells were maintained in normal pig media (1.2 mmol/L Ca+2) while in (B) they were maintained in media containing 0.06 mmol/L Ca+2. (C), cells maintained in 0.4 mmol/L Ca+2. (D), cells were treated for 24 h with 2.5 μmol/L CCT/0.4 mmol/L Ca+2. In (E), the cells were treated for 24 h with 5 μmol/L CCT/0.4 mmol/L Ca+2. The cells that were exposed to CCT lost their polygonal cobblestone appearance and became spindle shaped a transformation more pronounced at a higher concentration of CCT. (F), the cells were treated for 24 h with CHX and did not appear different from control (5 μmol/L). Representative data from five different experiments.
Figure 5
Figure 5
Effect of CaSR modulators on proliferation of squamous cells in culture. Cell proliferation was measured by MTT assay.(A), bar graphs showing proliferation in different treatment groups at 24 h. In CCT, the rate of proliferation was 87 ± 3% of control (P < 0.001), whereas the rate of proliferation in CHX-treated cells was 127 ± 13% (P < 0.007). Data are from four different experiments. (B), bar graphs showing cell proliferation at 24 h in media containing high Ca+2 (3.7 mmol/L) or Gd+3. In high Ca+2, the rate of proliferation was 78 ± 7% compared to control (P < 0.01). In 0.4 mmol/L Ca+2/Gd+3, cell proliferation was 86 ± 8% compared to control (P < 0.04). * indicates significant difference from control. Data are from five different experiments.
Figure 6
Figure 6
Effect of cinacalcet treatment on CaSR expression. (A) shows staining for CaSR (green) in cells maintained in 0.4 mmol/L Ca+2. (B), in cells treated for 48 h with 2.5 μmol/L CCT/0.4 mmol/L Ca+2 CaSR was localized to an area very close to the nucleus. (C) Western blot analysis of protein extracts from nontreated cells in 0.4 mmol/L Ca+2 and cells treated with CCT/0.4 mmol/L Ca+2 for 48 h. The blot was incubated with antibodies to CaSR and β-actin. CaSR was present at the expected MW of 130 kD in extracts from nontreated and CCT-treated cells. Other reactive bands were also present at ∼90, 80, and 60 kD possibly resulting from proteolytic degradation of the receptor. Representative data are from three different experiments.
Figure 7
Figure 7
Western analysis of lysates from human biopsies. (A) Immunoblot showing the distribution of CaSR in biopsies from normal (NL) esophagus, reflux esophagitis (RE), and eosinophilic esophagitis (EoE) tissues. The blot was stained with a mouse antibody (Sigma-Aldrich) raised against human CaSR (amino acid peptide sequence 15–29 at the extracellular N-terminus of human CaSR). A CaSR band was evident at the expected MW of 130 kD and at 160 kD (the glycosylated form). However, similar to the blot from pig squamous cells other reactive bands were also present at ∼90, 80, and 60 kD possibly resulting from proteolytic degradation of the receptor. Vertical solid lines indicate noncontiguous lanes of the same gel. B: Immunoblot from a different set of biopsies; normal, RE and EoE patients. The blot was stained this time with a polyclonal antibody to CaSR raised against the C-terminus of human CaSR (Millipore). The blot shows a band at the expected MW of 130 kD, but it also shows clusters of bands at smaller MWs.
Figure 8
Figure 8
Effect of cinacalcet on E-cadherin distribution. The figure shows staining for E-cadherin (green fluorescence), DAPI (blue) and F-actin (phalloidin, red) in SSE cells. (A) and (C) show nontreated cells grown in 0.4 mmol/L Ca+2. In (B) and (D) the cells were treated for 48 h with 2.5 μmol/L CCT/0.4 mmol/L Ca+2. Cells treated with CCT lost their polygonal shape, E-cadherin redistributed from the cell membrane to the cytoplasm and F-actin elongations were prominent. Representative figures are from three different experiments.
Figure 9
Figure 9
Effect of cinacalcet on β-catenin distribution. The figure shows staining for β-catenin (green fluorescence), DAPI (blue), and F-actin staining (phalloidin, red). (A) and (C) show nontreated cells grown in 0.4 mmol/L Ca+2. In (B) and (D), the cells were treated for 48 h with 2.5 μmol/L CCT/0.4 mmol/L Ca+2. Cells treated with CCT lost their polygonal shape, β-catenin redistributed from the cell membrane to the cytoplasm (green dots), and F-actin elongations were prominent. Representative figures are from three different experiments.
Figure 10
Figure 10
Effect of CaSR modulation on E-cadherin expression. (A), immunoblot analysis of lysates from control cells, cells treated with CHX, cells maintained in 0.4 mmol/L Ca+2 and cells treated with 2.5 μmol/L CCT/0.4 mmol/L Ca+2 for 48 h. The blot was stained for E-cadherin. Expression of E-cadherin fragment at 33 kD (E-cadh-CFT2) was significantly increased in CCT-treated cells. (B) is a bar graph showing that E-cadherin expression at the expected MW of 130 kD was not statistically different among the treatment groups. There was relative increase in expression of E-cadh-CFT2 in cells treated with CCT/0.4 mmol/L Ca+2 (2.3 folds, P < 0.01) as compared to nontreated cells. Data are from four different experiments. For each experiment, data from duplicates or triplicates were averaged for each sample to yield one data point (N = 4, *P < 0.02).
Figure 11
Figure 11
Effect of cinacalcet on β-catenin expression. (A), immunoblot analysis of lysates from control cells, cells treated with CHX, cells maintained in 0.4 mmol/L Ca+2 and cells treated with CCT/0.4 mmol/L Ca+2 for 48 h. The blot was stained for β-catenin. β-catenin expression at the expected MW of 100 kD was significantly decreased (by 35%) in CCT-treated cells. (B) is a bar graph showing relative expression of β-catenin in protein extracts from cells in 0.4 mmol/L Ca+2 and cells treated with CCT/0.4 mmol/L Ca+2 for 48 h. Data are from five different experiments. For each experiment, data from duplicates or triplicates were averaged for each sample to yield one data point (N = 5, * P < 0.02).
Figure 12
Figure 12
Effect of calhex on p120 catenin expression. (A), immunoblot analysis of lysates from control cells and cells treated with CHX. The blot was stained for p120 catenin. p120 catenin expression at the expected MW of 94 kD was higher (by 24%) in cells treated with CHX for 48 h. (B) is a bar graph showing relative expression of p120 catenin in control cells and cells treated with CHX. Data are from 6 different experiments. For each experiment, data from duplicates or triplicates were averaged for each sample to yield one data point (N = 6, *P < 0.05).
Figure 13
Figure 13
Rho expression in response to allosteric modulation of CaSR. (A), immunoblot analysis of lysates from control cells, cells treated with CHX, nontreated cells maintained in 0.4 mmol/L Ca+2 and cells treated with CCT/0.4 mmol/L Ca+2 for 48 h. The blot was stained for Rho. Rho expression at the expected MW of 20 kD was higher (by 18%) in cells treated with CHX. (B) is a bar graph showing relative increase in expression of Rho in cells treated with CHX as compared to nontreated control cells. Data are from three different experiments. For each experiment, data from duplicates or triplicates were averaged for each sample to yield one data point. (N = 3, *P < 0.03).

References

    1. Abdulnour-Nakhoul S, Nakhoul NL, Wheeler SA, Haque S, Wang P, Brown K, et al. Characterization of esophageal submucosal glands in pig tissue and cultures. Dig. Dis. Sci. 2007;52:3054–3065. - PubMed
    1. Abdulnour-Nakhoul S, Nakhoul HN, Kalliny MI, Gyftopoulos A, Rabon E, Doetjes R, et al. Ion transport mechanisms linked to bicarbonate secretion in the esophageal submucosal glands. Am. J. Physiol. Regul. Integr. Comp. Physiol. 2011;301:R83–R96. - PMC - PubMed
    1. Abdulnour-Nakhoul SM, Al-Tawil Y, Gyftopoulos AA, Brown KL, Hansen M, Butcher KF, et al. Alterations in junctional proteins, inflammatory mediators and extracellular matrix molecules in eosinophilic esophagitis. Clin. Immunol. 2013;148:265–278. - PubMed
    1. Alfadda TI, Saleh AM, Houillier P. Geibel JP. Calcium-sensing receptor 20 years later. Am. J. Physiol. Cell Physiol. 2014;307:28. - PMC - PubMed
    1. Anastasiadis PZ, Moon SY, Thoreson MA, Mariner DJ, Crawford HC, Zheng Y, et al. Inhibition of RhoA by p120 catenin. Nat. Cell Biol. 2000;2:637–644. - PubMed

LinkOut - more resources