. 2016 Jan;56(1):9-22.
doi: 10.1016/j.bcmd.2015.09.001. Epub 2015 Sep 16.

Diagnostic tool for red blood cell membrane disorders: Assessment of a new generation ektacytometer

Affiliations

Diagnostic tool for red blood cell membrane disorders: Assessment of a new generation ektacytometer

Lydie Da Costa et al. Blood Cells Mol Dis. 2016 Jan.

Abstract

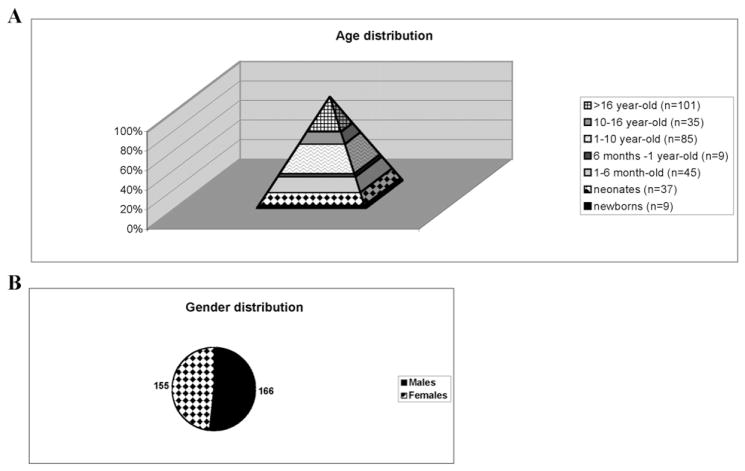
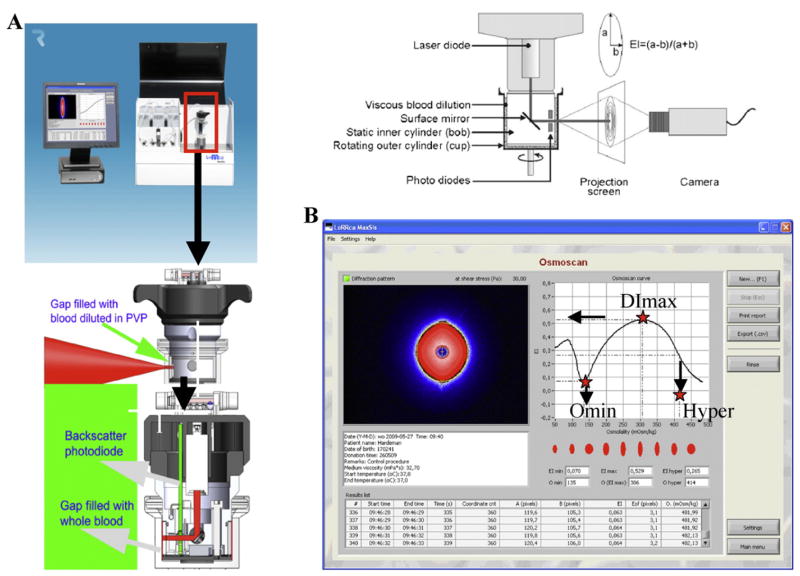
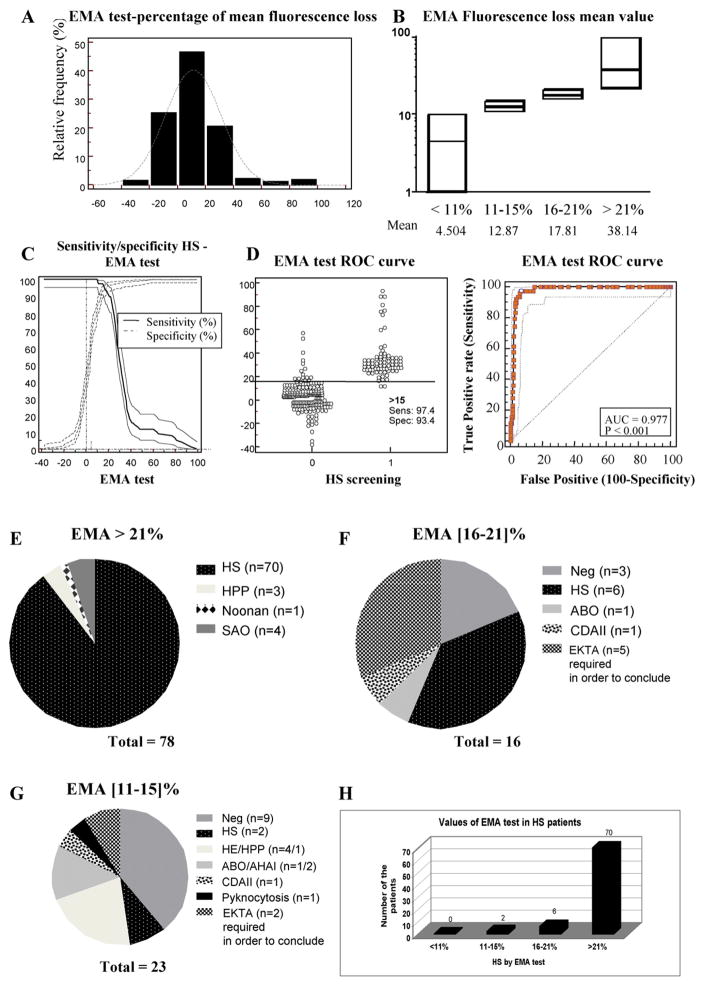
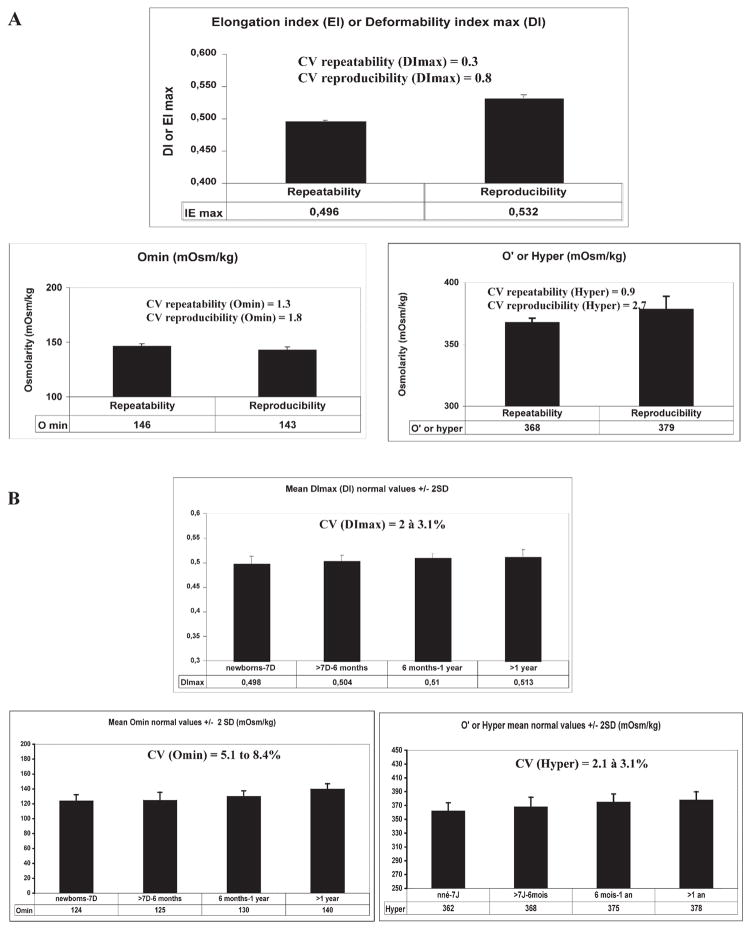
Inherited red blood cell (RBC) membrane disorders, such as hereditary spherocytosis, elliptocytosis and hereditary ovalocytosis, result from mutations in genes encoding various RBC membrane and skeletal proteins. The RBC membrane, a composite structure composed of a lipid bilayer linked to a spectrin/actin-based membrane skeleton, confers upon the RBC unique features of deformability and mechanical stability. The disease severity is primarily dependent on the extent of membrane surface area loss. RBC membrane disorders can be readily diagnosed by various laboratory approaches that include RBC cytology, flow cytometry, ektacytometry, electrophoresis of RBC membrane proteins and genetics. The reference technique for diagnosis of RBC membrane disorders is the osmotic gradient ektacytometry. However, in spite of its recognition as the reference technique, this technique is rarely used as a routine diagnosis tool for RBC membrane disorders due to its limited availability. This may soon change as a new generation of ektacytometer has been recently engineered. In this review, we describe the workflow of the samples shipped to our Hematology laboratory for RBC membrane disorder analysis and the data obtained for a large cohort of French patients presenting with RBC membrane disorders using a newly available version of the ektacytomer.

Keywords: EMA; Ektacytometer; LoRRca; Red blood cell membrane; Spherocytosis.


Conflict of interest statement

None of the authors have any conflicts of interest to declare.

Figures

Fig. 1
Fig. 1
Age distribution (A) and gender distribution (B) of the populations studied.
Fig. 2
Fig. 2
A. Principle of ektacytometry. A laser beam is scattered by a suspension of RBCs stressed between a static inner cylinder (bob) and a rotating outer cylinder (cup). The shape of the diffraction pattern, projected on a small screen, is a measure of the average RBC deformability and changes from circular at rest to elliptical at a high shear stress. The major (a) and minor (b) axes of the ellipse serve to calculate the elongation index, EI = (a − b)/(a + b). B. Deformability pattern obtained using the new generation ektacytometer and the derivation of the three ektacytometry derived parameters (DImax, Omin and Hyper points).
Fig. 3
Fig. 3
A. Percentage distribution of the mean fluorescence of RBCs labeled with the dye eosin-5′ maleimide (EMA) by flow cytometry in all the 321 samples studied. B. Values of the EMA-labeled RBC mean fluorescence percentage decrease in the different categories (below 11%, 11–15%, 16–21% and above 21% of mean fluorescence loss). The line represents the median value for each category. The mean value of the mean fluorescence loss is also indicated in each category. C. Sensitivity and specificity profiles and calculation of the cut-off of the EMA test for HS diagnosis. D. EMA test ROC curve. The cut-off of the EMA test for HS diagnosis for the 321 samples tested has been estimated at 15% (p < 0.001) with the highest sensitivity of 97.4% and a specificity of 93.4%. Only 2 out of 21 HS patients have been diagnosed below this 15% cut-off. E. Diagnosis of the patients based on EMA test with a setting of decrease in mean fluorescence of >21% (78 cases). There were 8 false positive cases including 3 HPP cases, 4 SAO cases and 1 Noonan syndrome affected patient. F. Diagnosis of the patients based on EMA test with a setting of decrease in mean fluorescence of between 16 and 21% (16 cases) including 6 HS cases, one case of ABO incompatibility and one CDAII-affected patient. In 3 patients, there was no hint for a RBC membrane disorder from complete family history, clinical assessment, RBC and reticulocyte indices, cytology and biochemistry data analyses. For 5 patients, the ektacytometer-based analysis was performed in order to confirm the presence of a RBC membrane disorder. G. Diagnosis of the patients based on EMA test with a setting of decrease in mean fluorescence between 11 and 15% (23 cases) including 2 HS cases, 4 HE cases, 1 HPP case, 3 immune hemolytic anemia cases, 1 CDAII case and 1 pyknocytosis case. In 9 patients RBC membrane disorder was ruled out with the same criteria as in (F). H. Number of patients with confirmed HS diagnosis in each category of the EMA test mean fluorescence loss percentage. No HS case was diagnosed below 11% of mean fluorescence decrease of EMA labeled RBCs, while 2 HS cases were diagnosed below the calculated 15% cut-off, 6 cases in the “gray zone” between 16% and 21% and 70 out of 78 cases were true positive HS cases with an EMA test up to 21%.
Fig. 4
Fig. 4
A. Values for the three ektacytometry derived parameters (DImax, Omin and Hyper points) obtained during validation of the new generation LoRRca MaxSis ektacytometer. The CV of the repeatability and reproducibility tests for each of the derived parameters was evaluated. B. Mean values and standard deviations (±2SD) and CV for each of the three ektacytometry derived parameters (DImax, Omin and Hyper points) in normal controls in different age categories (newborns to 7 day-old; 7 days to 6 month-old; 6 month-old to one year-old; and more than 1 year old).
Fig. 5
Fig. 5
Top panel: Final diagnosis of RBC membrane disorders for all the 313 samples studied. Other diagnoses included hemoglobinopathies as well as measurements of iron deficiency and enzymatic activity defects. “Negative” corresponds to patients with no RBC pathology. Bottom panel: Final diagnosis of RBC membrane disorders for the 199 samples analyzed both by EMA test-based flow cytometry and by LoRRca MaxSis ektacytometer. Other diagnoses included search for hemoglobinopathies as well as measurements of iron deficiency and enzymatic activity defects. “Negative” corresponds to patients with no RBC pathology.
Fig. 6
Fig. 6
RBC membrane disorders diagnosed by the LoRRca MaxSis ektacytometer: A. Hereditary spherocytosis ektacytometry curve and blood smear B. Dehydrated stomatocytosis ektacytometry curve and blood smear C. Hereditary elliptocytosis ektacytometry curve and blood smear D. Pyropoikilocytosis ektacytometry curve and blood smear E. South east Asian Ovalocytosis ektacytometry curve and blood smear.
Fig. 7
Fig. 7
Proposed work flow chart for laboratory diagnosis of HS and other RBC membrane disorders. * Depending on the Hematology analyzer

References

    1. Mohandas N, Gallagher PG. Red cell membrane: past, present, and future. Blood. 2008;112:3939–3948. - PMC - PubMed
    1. Mohandas N, Chasis JA, Shohet SB. The influence of membrane skeleton on red cell deformability, membrane material properties, and shape. Semin Hematol. 1983;20:225–242. - PubMed
    1. Mohandas N, Chasis JA. Red blood cell deformability, membrane material properties and shape: regulation by transmembrane, skeletal and cytosolic proteins and lipids. Semin Hematol. 1993;30:171–192. - PubMed
    1. Mohandas N, Evans E. Mechanical properties of the red cell membrane in relation to molecular structure and genetic defects. Annu Rev Biophys Biomol Struct. 1994;23:787–818. - PubMed
    1. Mohandas N, An X. New insights into function of red cell membrane proteins and their interaction with spectrin-based membrane skeleton. Transfus Clin Biol. 2006;13:29–30. - PubMed

Publication types

LinkOut - more resources