. 2015 Nov 16;25(22):2939-50.
doi: 10.1016/j.cub.2015.09.066. Epub 2015 Oct 22.

Uncertainty in the Timing of Origin of Animals and the Limits of Precision in Molecular Timescales

Uncertainty in the Timing of Origin of Animals and the Limits of Precision in Molecular Timescales

Mario dos Reis et al. Curr Biol. .

Abstract

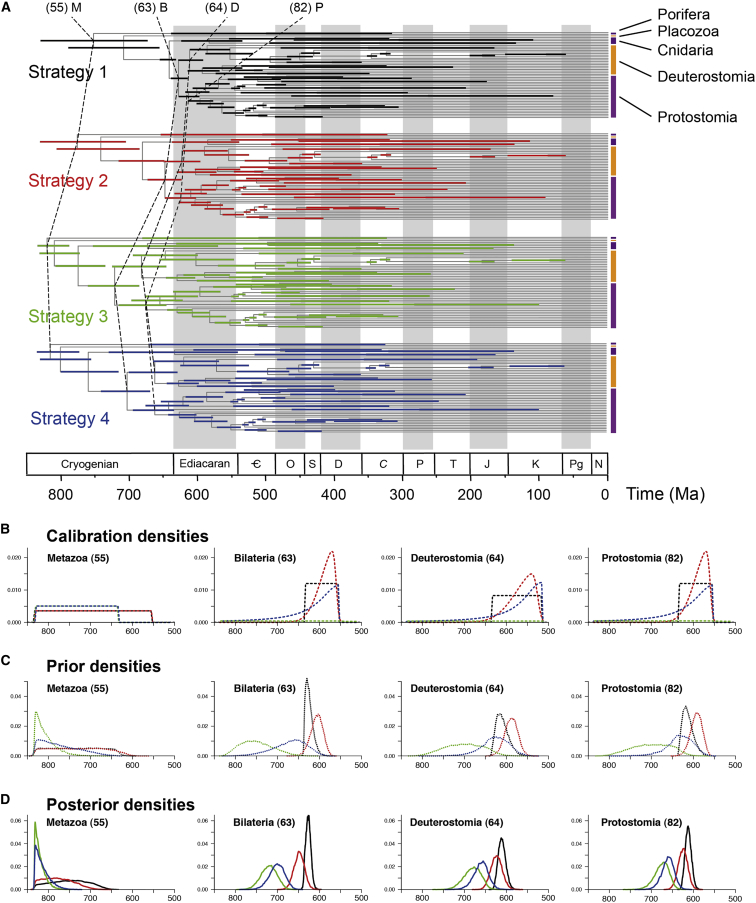
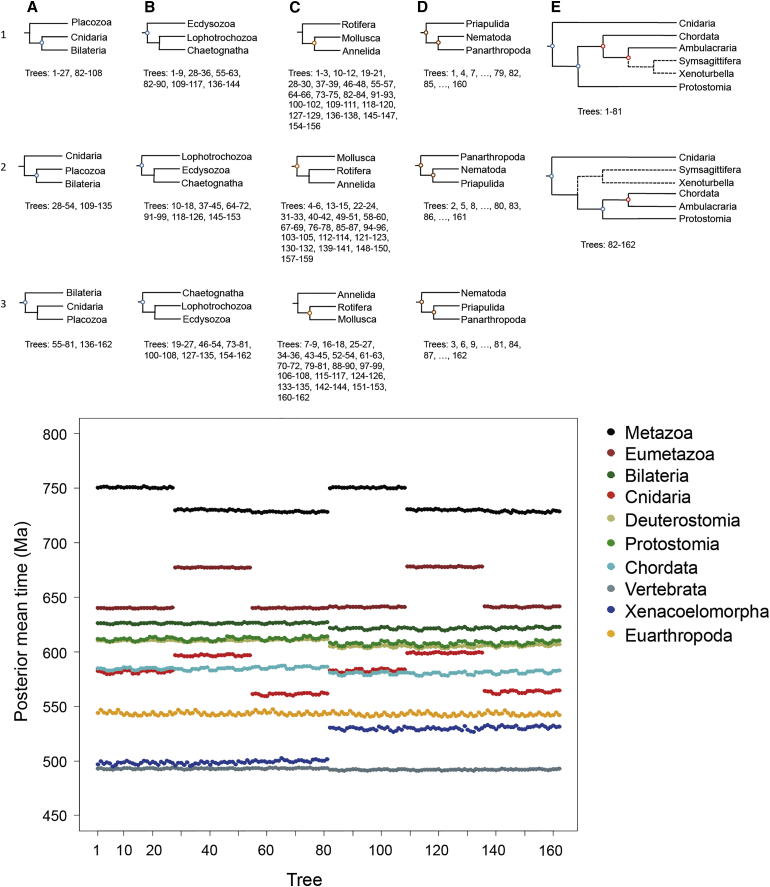
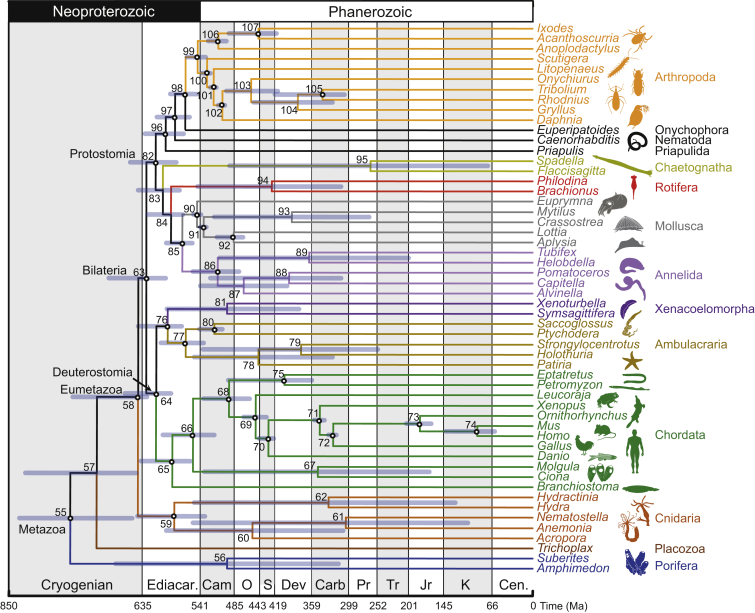
The timing of divergences among metazoan lineages is integral to understanding the processes of animal evolution, placing the biological events of species divergences into the correct geological timeframe. Recent fossil discoveries and molecular clock dating studies have suggested a divergence of bilaterian phyla >100 million years before the Cambrian, when the first definite crown-bilaterian fossils occur. Most previous molecular clock dating studies, however, have suffered from limited data and biases in methodologies, and virtually all have failed to acknowledge the large uncertainties associated with the fossil record of early animals, leading to inconsistent estimates among studies. Here we use an unprecedented amount of molecular data, combined with four fossil calibration strategies (reflecting disparate and controversial interpretations of the metazoan fossil record) to obtain Bayesian estimates of metazoan divergence times. Our results indicate that the uncertain nature of ancient fossils and violations of the molecular clock impose a limit on the precision that can be achieved in estimates of ancient molecular timescales. For example, although we can assert that crown Metazoa originated during the Cryogenian (with most crown-bilaterian phyla diversifying during the Ediacaran), it is not possible with current data to pinpoint the divergence events with sufficient accuracy to test for correlations between geological and biological events in the history of animals. Although a Cryogenian origin of crown Metazoa agrees with current geological interpretations, the divergence dates of the bilaterians remain controversial. Thus, attempts to build evolutionary narratives of early animal evolution based on molecular clock timescales appear to be premature.


Figures

Figure 1
Figure 1
The Effect of Fossil Calibrations on Posterior Divergence Time Estimates of Metazoans (A) Time trees showing posterior divergence time estimates for major metazoan groups. Nodes are drawn at the posterior means obtained and horizontal bars represent 95% HPD intervals. Estimates were obtained with MCMCTree using the LG + Γ4 + F model, IR, and with the 203 proteins concatenated into a super alignment. (B–D) Calibration, prior, and posterior densities for four ancient nodes in the metazoan phylogeny; coloring relates to the calibration strategy employed as in (A). (The phylogeny with species names is provided in Figure 6.)
Figure 2
Figure 2
Sensitivity of Time Estimates to Fossil Calibrations, Rate Model, and Number of Partitions The posterior mean times estimated under calibration strategy 1, independent rates (IR) model, and a single partition are plotted against (A) estimates using strategy 2, (B) estimates under the autocorrelated rates (AR) model, and (C) estimates obtained when the 203 gene alignments are divided into ten partitions according to substitution rate. The bars indicate the 95% HPDs.
Figure 3
Figure 3
Explosive Relaxation of Molecular Rates during Metazoan Evolution In the AR model, the rates at the tips of a star phylogeny are log-normally distributed with mean rA (the ancestral rate at the root) and log-variance of the rate σ2 = . For the metazoan phylogeny, the posterior mean of rA is 0.089 s/s/100 million years and of v is 0.468/100 million years. In (A)–(F), the evolution of the rate of molecular evolution is shown through 500 million years of metazoan history assuming the AR model to be correct. The numbers in brackets are the 95% equal-tail range of the distribution of the rate for the given time. As the star phylogeny evolves, the variance of the rates increases exponentially. After 500 million years of evolution, the 95% equal-tail range encompasses two orders of magnitude. Note that in case of the IR model with μ = 0.089/100 million years and σ2 = 0.468/100 million years, the shape of the log-normal distribution is the same as that for 100 million years for the AR at any time point. Note that here the timescale is given in million years from the root (i.e., 0 million years is the root, and 500 million years is present time).
Figure 4
Figure 4
Infinite-Sites Plots The 95% HPD width is plotted against the mean of the divergence times estimated without molecular data (prior) and with the 203 gene alignments divided into one, two, four, five, and ten partitions. This plot indicates how much of the uncertainty in the posterior time estimates is due to the uncertain fossil calibrations and how much is due to the limited amount of sequence data. Thus, the low correlations indicate that the limited amount of sequence data contributes substantially to posterior uncertainty and the regression coefficients also indicate that the fossil calibrations involve much uncertainty.
Figure 5
Figure 5
Effect of Uncertainty in Tree Topology on Divergence Time Estimates of the Metazoa Four nodes (A–D) can be rearranged in three different ways (1–3), and a fifth node (E) can be rearranged in two ways, resulting in a total of 162 tree topologies reflecting the uncertain relationships around these five nodes. Divergence times were estimated using strategy 1, the IR model, and a single partition using each tree (bottom panel). Some phylogenetic hypothesis had a strong effect on posterior mean times; for example, placing the Placozoa as the most basal with respect to Cnidaria and Bilateria (A) leads to substantially older divergence times for the Metazoa (bottom panel), whereas placing Cnidaria as the most basal leads to substantially older times for the divergence of Eumetazoa.
Figure 6
Figure 6
The Timetree of the Metazoa Encompassing Major Sources of Uncertainty in Time Estimates Node ages are plotted at the posterior mean for the calibration strategy 1, one partition, IR, and LG + Γ analysis. The node bars are composites extending from the minimum 2.5% HPD limit to the maximum 97.5% limit across all analyses (excluding results from calibration strategies 3 and 4 and from alternative topologies). Cen, Cenozoic; K, Cretaceous; Jr, Jurassic; Tr, Triassic; Pr, Permian; Carb, Carboniferous; Dev, Devonian; S, Silurian; O, Ordovician; Cam, Cambrian; Ediacar, Ediacaran.

Comment in

References

    1. Signor P.W., Lipps J.H. Origin and early radiation of the Metazoa. In: Signor P.W., Lipps J.H., editors. Origin and Early Evolution of the Metazoa. Springer; 1992. pp. 3–23.
    1. Sebé-Pedrós A., de Mendoza A., Lang B.F., Degnan B.M., Ruiz-Trillo I. Unexpected repertoire of metazoan transcription factors in the unicellular holozoan Capsaspora owczarzaki. Mol. Biol. Evol. 2011;28:1241–1254. - PMC - PubMed
    1. Planavsky N.J., Reinhard C.T., Wang X., Thomson D., McGoldrick P., Rainbird R.H., Johnson T., Fischer W.W., Lyons T.W. Earth history. Low mid-Proterozoic atmospheric oxygen levels and the delayed rise of animals. Science. 2014;346:635–638. - PubMed
    1. Knoll A.H., Carroll S.B. Early animal evolution: emerging views from comparative biology and geology. Science. 1999;284:2129–2137. - PubMed
    1. Hoffman P.F., Schrag D.P. The snowball Earth hypothesis: testing the limits of global change. Terra Nova. 2002;14:129–155.

Publication types

LinkOut - more resources