. 2016 Feb 18;127(7):858-68.
doi: 10.1182/blood-2015-05-645069. Epub 2015 Nov 24.

Combinatorial targeting of nuclear export and translation of RNA inhibits aggressive B-cell lymphomas

Affiliations

Combinatorial targeting of nuclear export and translation of RNA inhibits aggressive B-cell lymphomas

Biljana Culjkovic-Kraljacic et al. Blood. .

Abstract

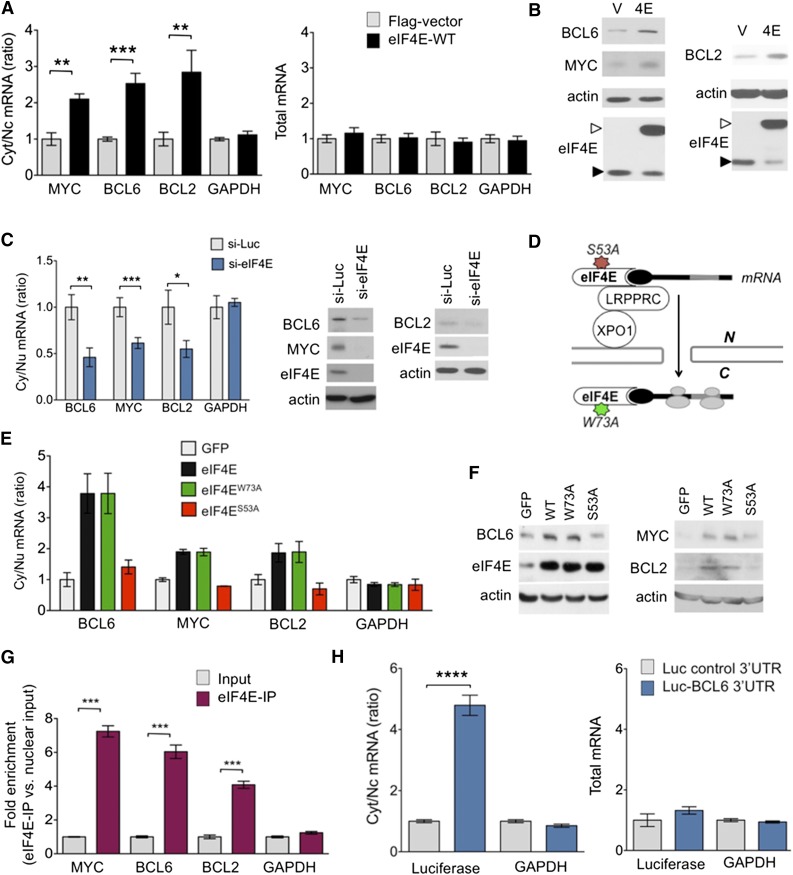
Aggressive double- and triple-hit (DH/TH) diffuse large B-cell lymphomas (DLBCLs) feature activation of Hsp90 stress pathways. Herein, we show that Hsp90 controls posttranscriptional dynamics of key messenger RNA (mRNA) species including those encoding BCL6, MYC, and BCL2. Using a proteomics approach, we found that Hsp90 binds to and maintains activity of eIF4E. eIF4E drives nuclear export and translation of BCL6, MYC, and BCL2 mRNA. eIF4E RNA-immunoprecipitation sequencing in DLBCL suggests that nuclear eIF4E controls an extended program that includes B-cell receptor signaling, cellular metabolism, and epigenetic regulation. Accordingly, eIF4E was required for survival of DLBCL including the most aggressive subtypes, DH/TH lymphomas. Indeed, eIF4E inhibition induces tumor regression in cell line and patient-derived tumorgrafts of TH-DLBCL, even in the presence of elevated Hsp90 activity. Targeting Hsp90 is typically limited by counterregulatory elevation of Hsp70B, which induces resistance to Hsp90 inhibitors. Surprisingly, we identify Hsp70 mRNA as an eIF4E target. In this way, eIF4E inhibition can overcome drug resistance to Hsp90 inhibitors. Accordingly, rational combinatorial inhibition of eIF4E and Hsp90 inhibitors resulted in cooperative antilymphoma activity in DH/TH DLBCL in vitro and in vivo.


Figures

Figure 1
Figure 1
eIF4E is expressed in DH/TH DLBCL. (A) Representative image of BCL2, BCL6, and MYC FISH assay carried out in OCI-Ly1, SU-DHL6, and DoHH2 cell lines. Summary of FISH findings for MYC, BCL2, and/or BCL6 in 6 DLBCL cell lines harboring >1 of such chromosomal abnormalities. (B) Scatter plot for PU-H71 GI50 (growth inhibitory concentration 50%) in DH/TH cell lines (n = 6) vs non-DH/TH DLBCL cell lines (n = 29). (C) eIF4E expression by immunohistochemistry from 111 DLBCL cases. Number of positive cells (over total cells) is represented by color scale. All the DH/TH cases in the cohort (n = 6) presented the highest levels of eIF4E staining (n = 10). (D) Affinity purification of eIF4E and TEHsp90 from DH/TH cell lines nuclear lysates using PU-H71-beads vs chemical control beads.
Figure 2
Figure 2
MYC, BCL2, and BCL6 are eIF4E targets. (A) Cytosolic/nuclear ratio (left) and total mRNA (right) of BCL6, BCL2, MYC, and glyceraldehyde-3-phosphate dehydrogenase (GAPDH; as control) transcripts in U2OS cells transfected with eIF4E plasmid (eIF4E-WT) or flag-vector as control. (B) Protein levels of BCL6, BCL2, MYC, actin (as control), and eIF4E in U2OS cells transfected with eIF4E plasmid (4E) or flag-vector (V). Endogenous eIF4E is marked with closed arrowhead and flagged eIF4E is marked with an open arrowhead. (C) Cytosolic/nuclear ratio of BCL6, BCL2, MYC, and GAPDH (as control) transcripts in U2OS cells transfected with siRNA for luciferase (as control) or siRNA for eIF4E. Protein levels of BCL6, BCL2, MYC, and eIF4E from the experiments are shown on the right. (D) Cartoon depicting loss of function caused by each mutant eIF4E construct used in subsequent experiment. (E) Cytosolic/nuclear ratio of BCL6, MYC, and BCL2 transcripts (GAPDH transcripts are shown as a control) and total transcript expression (right) of UOS2 cells transfected with green fluorescent protein (GFP) (as a vector control), wild-type eIF4E, and mutant eIF4E constructs eIF4EW73A and eIF4ES53A. (F) BCL6, MYC, BCL2, and eIF4E protein expression for cells shown in panel E. (G) eIF4E RIP fold enrichment of MYC, BCL2, BCL6, and GAPDH (negative control) mRNAs over input in U2OS cells. (H) Cytosolic/nuclear ratio of luciferase and GAPDH (as negative control) in U2OS cells transfected with luciferase gene with or without BCL6 3′UTR sequence. Total mRNA for the same conditions is shown on the right. ****P < .0001.
Figure 3
Figure 3
Nuclear eIF4E regulates the export of lymphomagenic transcripts. (A) Protein levels of BCL6, BCL2, MYC, and eIF4E in the DH/TH DoHH2 cells transfected with siRNA for luciferase (as control) or siRNA for eIF4E. Protein quantification is shown on the right for triplicate experiments as mean ± standard error of the mean (SEM). (B) eI4FE mRNA immunoprecipitation for BCL6, MYC, BCL2, and GAPDH (as control) in DoHH2, SU-DHL6, and OCI-Ly1 nuclear fractions. Results expressed as fold enrichment over nuclear input. ***P < .001 and **P < .05 (Student t test for triplicates). (C) eI4FE RIP sequencing (RIP-seq) in OCI-Ly1 cells (vs nuclear input). Selected transcripts and pathways differentially enriched in eIF4E RIPs are shown on the right. (D) eIF4E nuclear targets that sustain BCL6, MYC, and BCL2 activity in lymphoma cells depicted as “networks” from Search Tool for the Retrieval of Interacting Genes/Proteins analysis. Transcripts identified in this eIF4E RIP-seq are shown in red circles. (E) Effect of ribavirin (RBV) on the mRNA nuclear export (determined by mRNA cytosolic/nuclear ratio) of BCL6, MYC, BCL2, and GAPDH (as control) in SU-DHL6, OCI-Ly1, and DoHH2 cells.
Figure 4
Figure 4
Ribavirin is active a TH DLBCL patient-derived xenograft (PDX) model. (A) Polysomal profiling of BCL6, BCL2, MYC, and GAPDH (as control) transcripts in OCI-Ly1, DoHH2, and SU-DHL6 cells treated with vehicle (black dotted line) vs ribavirin (RBV). Each profiling is normalized to the respective vehicle represented with a dotted central line. Points localized above and below the line represent polysome fractions enriched and depleted in RBV-treated cells. (B) Total polysomal profiling of DoHH2, OCI-Ly1, and SU-DHL6 cells treated with vehicle (black line) vs ribavirin (red line). (C) Total protein levels in OCI-Ly1 cells treated with vehicle (V) and ribavirin (R). Previously synthesized protein is marked as old and newly synthesized protein is marked as new. Actin was used as control. (D) Protein levels of BCL6, BCL2, MYC, eIF4E, and actin (as control) in SU-DHL6 cells treated with vehicle (V) vs ribavirin (R) for 48 hours. Densitometry analysis is shown on the right for replicates experiments as mean ± SEM conducted in SU-DHL6, OCI-Ly1, and DoHH2 cell lines. (E) In vivo effect of ribavirin (blue dots) vs vehicle (green dots) in the PDX-4 mice. (F-G) Gene Set Enrichment Analysis of decreased transcripts upon ribavirin treatment in PDX-4 mice and eIF4E nuclear targets from RIP-seq experiments. (H) Cytosolic vs nuclear distribution of BCL6, BCL2, MYC, and GAPDH (as control) mRNAs from the PDX-4 after ribavirin treatment of 3 hours or 6 hours. FDR, false discovery rate; NES, normalized enrichment score.
Figure 5
Figure 5
Antilymphoma effect of combined inhibition of eIF4E and TEHsp90. (A) Effect on BCL6, BCL2, MYC, Hsp70, Hsp90, and actin (as control) protein abundance of vehicle, ribavirin (RBV), PU-H71, and their combination (combo) in SU-DHL6 (SU6), DoHH2 (Do2), and OCI-Ly1 (Ly1) cells. Densitometry analysis is shown on the right for triplicate experiments as mean ± SEM. C, combination; P, PU-H71; R, ribavirin; V, vehicle. (B) BCL6, MYC, BCL2, and GAPDH polysomal profiling of OCI-Ly1, DoHH2, and SU-DHL6 cells treated with vehicle (black dotted line) or the TEHsp90 inhibitor PU-H71. Each profiling is normalized to its respective vehicle represented with a dotted central line. Points localized below the line represent polysome fractions depleted in PU-H71-treated cells. (C-D) Tumor growth (in AUC from day 1 to day 10) of OCI-Ly1 and SU-DHL6 xenografted mice. P values are shown on top for each group for the comparison with vehicle-treated mice. (E) Tumor growth (in AUC from day 1 to day 20) of TH DLBCL PDX xenografted mice. P values are shown on top for each group for the comparison with vehicle-treated mice. (F) Body weight at day 21 of mice from panel E.
Figure 6
Figure 6
Ribavirin decreases TEHsp90 inhibition–induced Hsp70 upregulation. (A) Effect of ribavirin on the mRNA nuclear export (determined by mRNA cytosolic/nuclear ratio) of HSP70B (HSPA6) and GAPDH (as control) in OCI-Ly1, SU-DHL6, and DoHH2 cells. The effect on total mRNA is sown on the right with PU-H71 effect as control. (B) eI4FE mRNA immunoprecipitation for HSP70B and GAPDH (as control) in OCI-Ly1, SU-DHL6, and DoHH2 nuclear fractions. Results expressed as fold enrichment over nuclear input. (C) Polysomal profiling of HSP70B transcript in OCI-Ly1 cells treated with vehicle vs ribavirin (RBV). (D) Effect on Hsp70 and actin (as control) protein abundance in ribavirin- and vehicle-treated SU-DHL6, OCI-Ly1, and DoHH2 cells. Immunoblots from 50 μg of cell lysates were exposed for optimal time to visualize Hsp70 at baseline. Hsp70 protein quantification (to actin) is shown at the bottom for quadruplicate experiments as mean ± SEM.

Comment in

References

    1. Larouche JF, Berger F, Chassagne-Clément C, et al. Lymphoma recurrence 5 years or later following diffuse large B-cell lymphoma: clinical characteristics and outcome. J Clin Oncol. 2010;28(12):2094–2100. - PubMed
    1. Sehn LH, Connors JM. Treatment of aggressive non-Hodgkin’s lymphoma: a North American perspective. Oncology (Williston Park) 2005;19(4, suppl 1):26–34. - PubMed
    1. Barrans S, Crouch S, Smith A, et al. Rearrangement of MYC is associated with poor prognosis in patients with diffuse large B-cell lymphoma treated in the era of rituximab. J Clin Oncol. 2010;28(20):3360–3365. - PubMed
    1. Savage KJ, Johnson NA, Ben-Neriah S, et al. MYC gene rearrangements are associated with a poor prognosis in diffuse large B-cell lymphoma patients treated with R-CHOP chemotherapy. Blood. 2009;114(17):3533–3537. - PubMed
    1. Johnson NA, Savage KJ, Ludkovski O, et al. Lymphomas with concurrent BCL2 and MYC translocations: the critical factors associated with survival. Blood. 2009;114(11):2273–2279. - PMC - PubMed

Publication types

MeSH terms