. 2015 Nov 10;5(5):763-775.
doi: 10.1016/j.stemcr.2015.09.016.

A Systematic Approach to Identify Candidate Transcription Factors that Control Cell Identity

Affiliations

A Systematic Approach to Identify Candidate Transcription Factors that Control Cell Identity

Ana C D'Alessio et al. Stem Cell Reports. .

Abstract

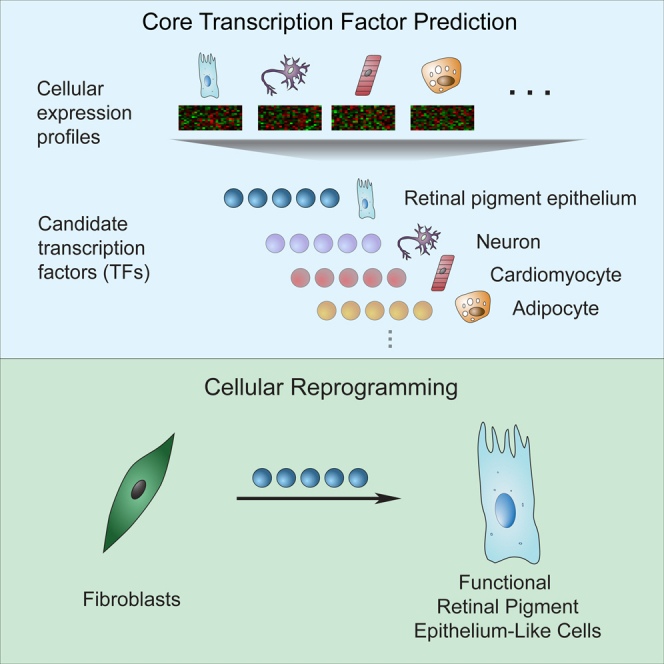
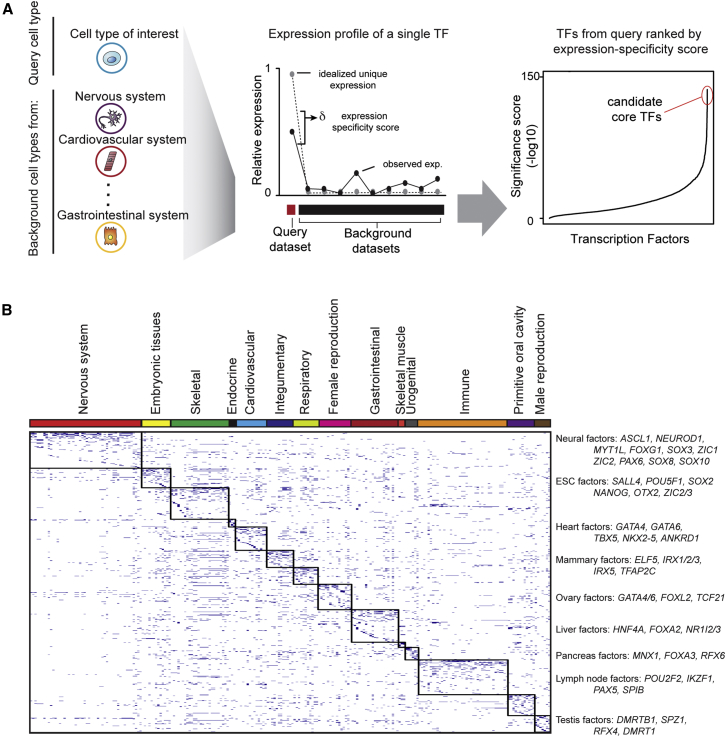
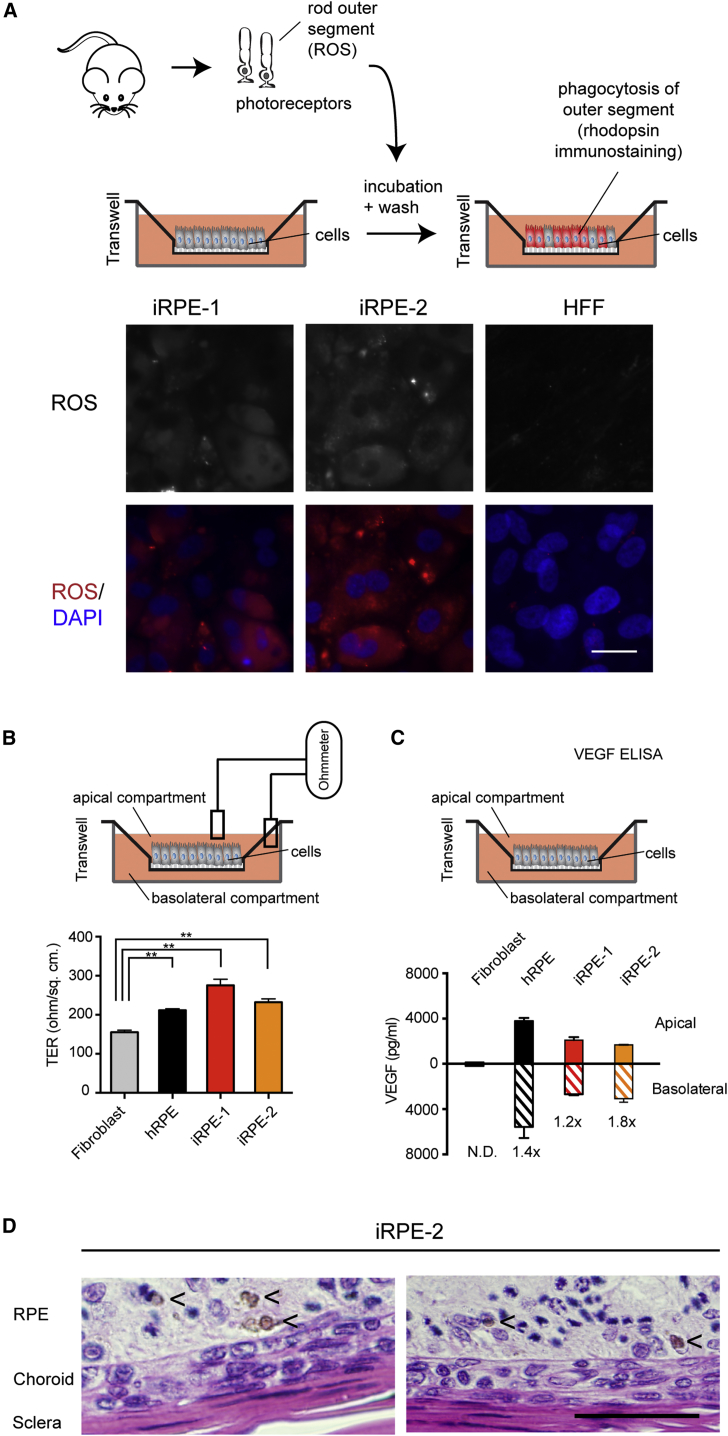
Hundreds of transcription factors (TFs) are expressed in each cell type, but cell identity can be induced through the activity of just a small number of core TFs. Systematic identification of these core TFs for a wide variety of cell types is currently lacking and would establish a foundation for understanding the transcriptional control of cell identity in development, disease, and cell-based therapy. Here, we describe a computational approach that generates an atlas of candidate core TFs for a broad spectrum of human cells. The potential impact of the atlas was demonstrated via cellular reprogramming efforts where candidate core TFs proved capable of converting human fibroblasts to retinal pigment epithelial-like cells. These results suggest that candidate core TFs from the atlas will prove a useful starting point for studying transcriptional control of cell identity and reprogramming in many human cell types.


Figures

None
Graphical abstract
Figure 1
Figure 1
A General Approach to Identify Candidate Core TFs in Human Cells (A) Computational approach used to identify candidate core TFs in human cells. Left panel: collection of gene expression profiles of a query cell type and representative cell types from the Human Body Index collection of expression data. Middle panel: expression profile of a single TF across a query dataset and a range of background datasets. The idealized case of expression level of a TF (gray circle, dashed line) is compared to the observed data to calculate the expression-specificity score of the TF. Right panel: plot depicting the distribution of significance scores of expression specificity for all TFs. Factors are arranged on the x axis in order of significance scores. Significance scores are indicated on the y axis. The highest scoring TFs are considered the best candidate core TFs and highlighted in the red circle. (B) Representation of the collection of candidate core TFs for 233 tissue and cell types. Tissue and cell types are arranged on the x axis and ordered according to anatomical groups, represented by the colored bar at the top. Genes are arranged on the y axis. Blue dashes represent candidate core TFs in a cell type. Clusters of candidate core TFs in cell types representing an anatomical group are boxed. Representative genes are listed on the side.
Figure 2
Figure 2
Candidate Core TFs for 233 Tissue and Cell Types Tissue and cell types were grouped into categories corresponding to different anatomical systems in the human body. Within each category, tissue and cell types were ordered using hierarchical clustering. The distance matrix was calculated by first rank-ordering the specificity scores for all TFs in each tissue and cell type within a category and then finding the Kendall tau correlation coefficient for each pairwise comparison of tissue and cell types within the category. For each individual tissue or cell type, the ten top-scoring candidate core TFs are listed.
Figure 2
Figure 2
Candidate Core TFs for 233 Tissue and Cell Types Tissue and cell types were grouped into categories corresponding to different anatomical systems in the human body. Within each category, tissue and cell types were ordered using hierarchical clustering. The distance matrix was calculated by first rank-ordering the specificity scores for all TFs in each tissue and cell type within a category and then finding the Kendall tau correlation coefficient for each pairwise comparison of tissue and cell types within the category. For each individual tissue or cell type, the ten top-scoring candidate core TFs are listed.
Figure 3
Figure 3
Characterization of Candidate Core TFs (A) Box plots depicting the expression levels of candidate core TFs and non-core TFs. The significance of the difference between two groups was determined using a two-tailed Mann-Whitney test. For each plot, the top and bottom box edges mark the first and third quartiles, while the solid black line within the box marks the median. The top whisker line marks the largest data point that is within 1.5-fold of the interquartile range from the third quartile. The bottom whisker line marks the smallest data point that is within 1.5-fold of the interquartile range from the first quartile. Candidate core TFs are shown in gold. Non-core-TFs are shown in gray. (B) Pie chart depicting the number of cell types in which a TF is considered as a candidate core TF. (C) Bar chart representing the percentage of candidate core TFs and non-core TFs that are associated with different classes of DNA binding domains. The significance of the difference in distribution between candidate core TFs and non-core TFs across these categories is p < 0.003 and was determined using a chi-square test. The gray oval indicates the percentage of all TFs that are associated with the class of DNA binding domains as a point of comparison. Abbreviations for protein domains are: HOX, homeodomain; HLH, helix-loop-helix; BRLZ, basic region leucine zipper; HOLI, ligand binding domain of hormone receptor; ZnF_C4, c4 zinc finger in nuclear hormone receptors; HMG, high mobility group; ETS, erythroblast transformation specific; FH, forkhead; TBOX, T-box; POU, Pit-Oct-Unc; ZnF_GATA, zinc finger binding to DNA consensus sequence [AT]GATA[AG]; DWB, domain B in dwarfin family proteins; SANT, SWI3-ADA2-N-CoR-TFIIB DNA-binding domain; SCAN, SCAN domain; KRAB, Krueppel-associated box; ZnF_C2H2, zinc finger C2H2. (D) Heatmap depicting the presence (blue) or absence (white) of orthologous genes in a species for each candidate core TF. The candidate core TFs are arranged as rows, and species are shown as columns. Species labels are colored using the following scheme: blue (primate), orange (mammal), purple (vertebrates), green (metazoa), and black (eukaryote). In the image, rows are clustered according to k-means clustering (k = 3). (E) GSEA enrichment plots depicting the relationship between super-enhancer associated genes and high expression-specificity scores. Top panel: GSEA plot for genes associated with super-enhancers in CD4+ naive T cells and expression-specificity score. Enrichment score is plotted on the y axis. The x axis represents genes ordered by specificity score. The relationship when ordered by the expression specificity scores from CD4+ naive T cells is shown in blue. The relationship when ordered by the expression specificity scores from a non-matching cell type (embryonic stem cells) is shown in gray for comparison. p values for each are shown. Subsequent panels show similar relationships in different cell types. For each panel, the cell type is indicated. Super-enhancer associated genes are from that cell type. Blue curves represent the relationship when ordered by expression-specificity scores for that cell type. Gray curves represent the relationship when ordered by expression-specificity scores for a non-matching cell type (embryonic stem cells). p values for each are shown. E.S., enrichment score.
Figure 4
Figure 4
Ectopic Expression of RPE Candidate Core TFs Is Sufficient to Drive the Morphology and Gene Expression Program of Fibroblasts toward an RPE-like State (A) Schematic outlining the ectopic expression of candidate core TFs in HFF. Lentiviral constructs were induced to express candidate core TFs with doxycycline (Dox). Scale bar, 50 μm. (B) PCR and gel analysis of transgene integration for iRPE lines. Positive control (DNA of the constructs used to generate lentivirus) and negative control reactions are shown. Six different iRPE lines, labeled 1–6 are shown. Genes are indicated on the side. (C) Immunostaining of iRPE-1 and iRPE-2 cells. Cells were immunostained with TJP1 (ZO-1). Scale bar 50 μm. (D) Immunostaining imaging of RPE, iRPE-1, and iRPE-2 cells. Cells were immunostained for RPE cell markers CRALBP (green) and RPE65 (red) and with DAPI (blue). Scale bar, 50 μm. (E) PCA comparing the gene expression profiles of iRPE cells to gene expression profiles of other cell types. Principal components (PC1–PC3) are shown on the x, y, and z axes. The expression profiles of HFF (black), iRPE cells (blue), RPE cells (light green), induced pluripotent stem (iPS)-RPE cells (green), iPS cells (red), and ES cells (orange red), and 106 additional cell types (gray) are shown. (F) GSEA enrichment score of a previously published RPE signature gene set (Strunnikova et al., 2010) compared with genes differentially expressed between iRPE and fibroblasts. Genes are ranked along the x axis based on differential expression in iRPE cells versus fibroblasts, with more expressed in iRPE (red) to more expressed in fibroblasts (blue). Black tick marks indicate a gene from the RPE signature set. Enrichment score is shown on the y axis.
Figure 5
Figure 5
RPE-like Cells Have Functional Characteristics (A) Schematic of the phagocytosis of ROS assay for iRPE function. Immunostaining for rhodopsin and DAPI are shown. The top row of images shows immunostaining for rhodopsin. The lower row of images shows the same fields with rhodopsin indicated in red and DAPI staining for DNA shown in blue. Scale bar, 25 μm. (B) Schematic and results of TER assay for iRPE-1, iRPE-2, and hRPE cells (Salero et al., 2012). TER values for fibroblasts (gray), hRPE cells (black), iRPE-1 cells (red), and iRPE-2 cells (gold) are 155.2 ± 5 Ω/cm2, 211.4 ± 4 Ω/cm2, 275.6 ± 15 Ω/cm2, and 232.2 ± 8 Ω/cm2, respectively. TER was assayed in at least five biological replicates and is displayed as mean ± SD. (C) Schematic and results for polarized release of VEGF assayed by ELISA. Values are shown for fibroblasts (nearly undetectable) and for hRPE (black), iRPE-1 (red), and iRPE-2 (gold), with the apical secretion values indicated with solid colors and the basolateral secretion values indicated with striped colors. The ratio of VEGF release (basolateral/apical) is shown below each bar. N.D., non detectable. ELISA was assayed in biological duplicates and is displayed as mean ± SD. (D) Xenotransplant subretinal transplantations of wild-type albino Sprague-Dawley rats. H&E staining show pigmented donor cells iRPE-2 visible in the RPE layer. Single pigmented cells were identified in the host RPE layer in the doxycycline-treated group but not in the control iRPE group that did not receive doxycycline (data not shown). Pigmented cells are indicated with a “<” sign. Scale bar, 50 μm.

References

    1. Benayoun B.A., Pollina E.A., Ucar D., Mahmoudi S., Karra K., Wong E.D., Devarajan K., Daugherty A.C., Kundaje A.B., Mancini E. H3K4me3 breadth is linked to cell identity and transcriptional consistency. Cell. 2014;158:673–688. - PMC - PubMed
    1. Bok D. The retinal pigment epithelium: a versatile partner in vision. J. Cell Sci. Suppl. 1993;17:189–195. - PubMed
    1. Breitling R., Armengaud P., Amtmann A., Herzyk P. Rank products: a simple, yet powerful, new method to detect differentially regulated genes in replicated microarray experiments. FEBS Lett. 2004;573:83–92. - PubMed
    1. Buganim Y., Itskovich E., Hu Y.C., Cheng A.W., Ganz K., Sarkar S., Fu D., Welstead G.G., Page D.C., Jaenisch R. Direct reprogramming of fibroblasts into embryonic Sertoli-like cells by defined factors. Cell Stem Cell. 2012;11:373–386. - PMC - PubMed
    1. Buganim Y., Faddah D.A., Jaenisch R. Mechanisms and models of somatic cell reprogramming. Nat. Rev. Genet. 2013;14:427–439. - PMC - PubMed

Publication types

Substances