. 2015 Dec 15;112(50):E6983-92.
doi: 10.1073/pnas.1517045112. Epub 2015 Nov 24.

PSD-95 family MAGUKs are essential for anchoring AMPA and NMDA receptor complexes at the postsynaptic density

Affiliations

PSD-95 family MAGUKs are essential for anchoring AMPA and NMDA receptor complexes at the postsynaptic density

Xiaobing Chen et al. Proc Natl Acad Sci U S A. .

Abstract

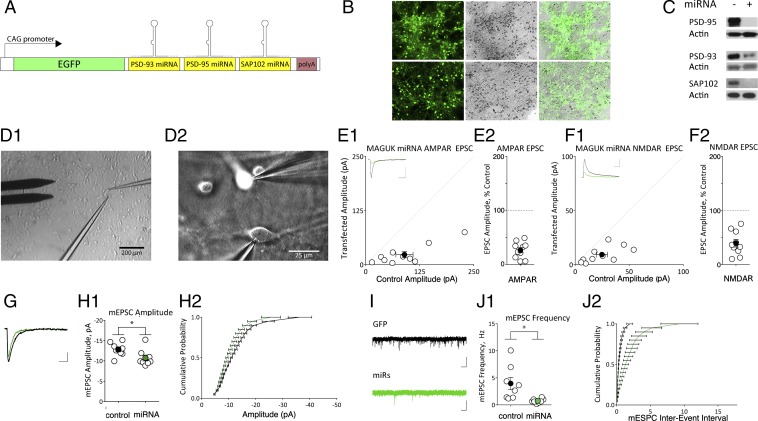
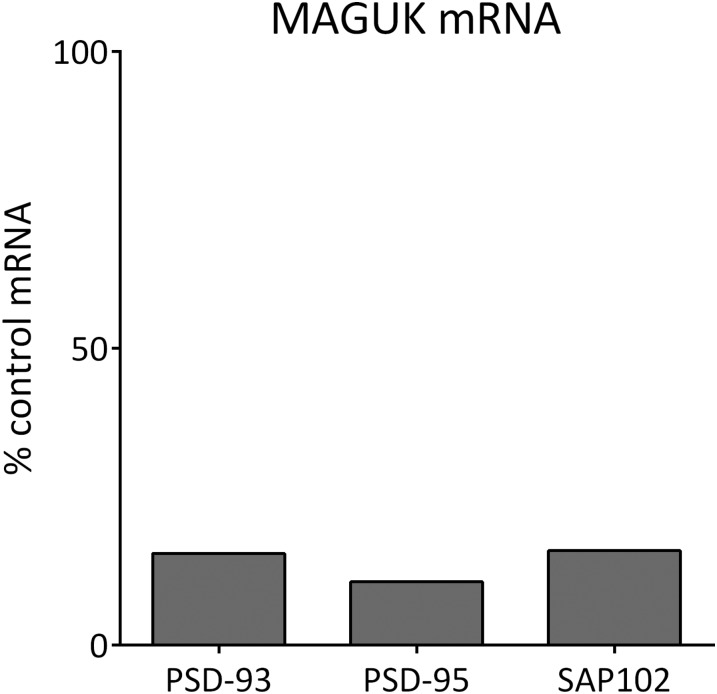
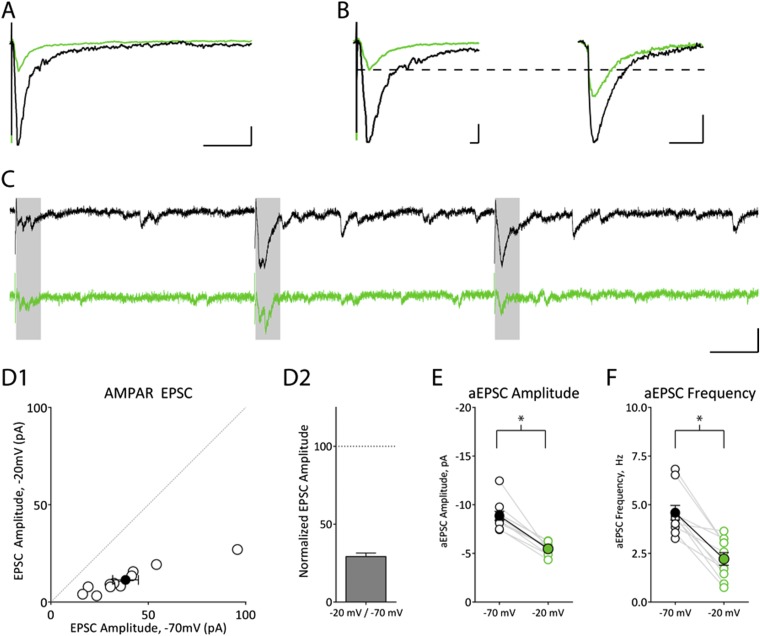
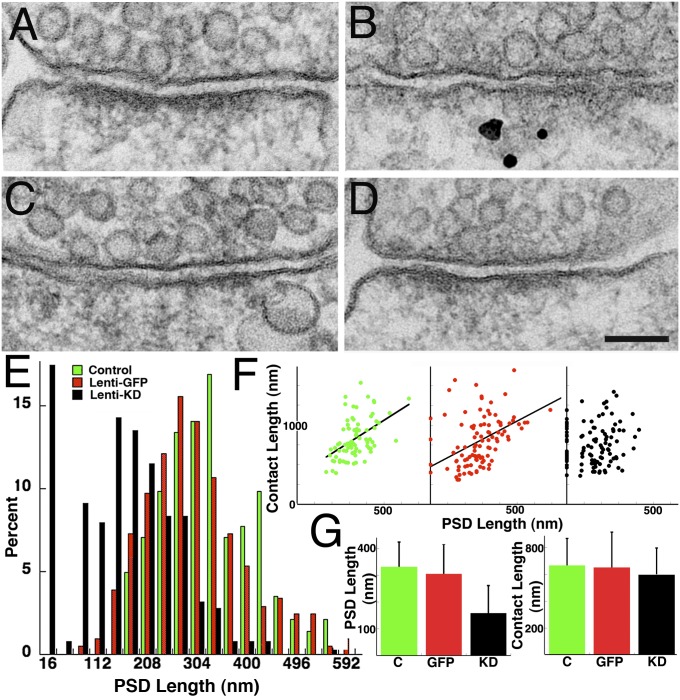
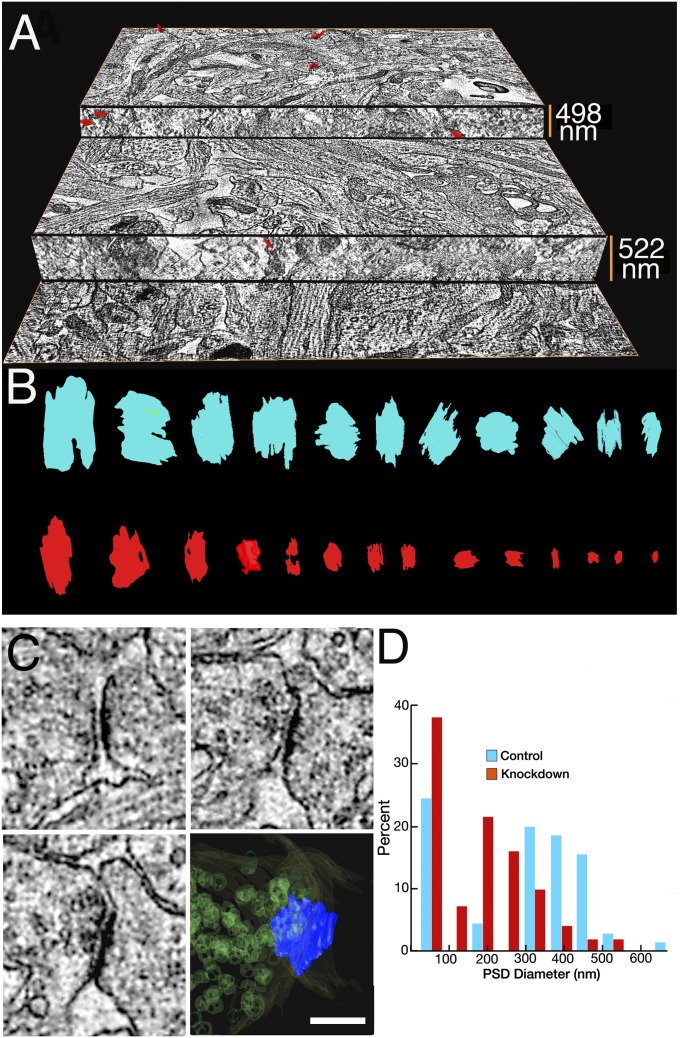
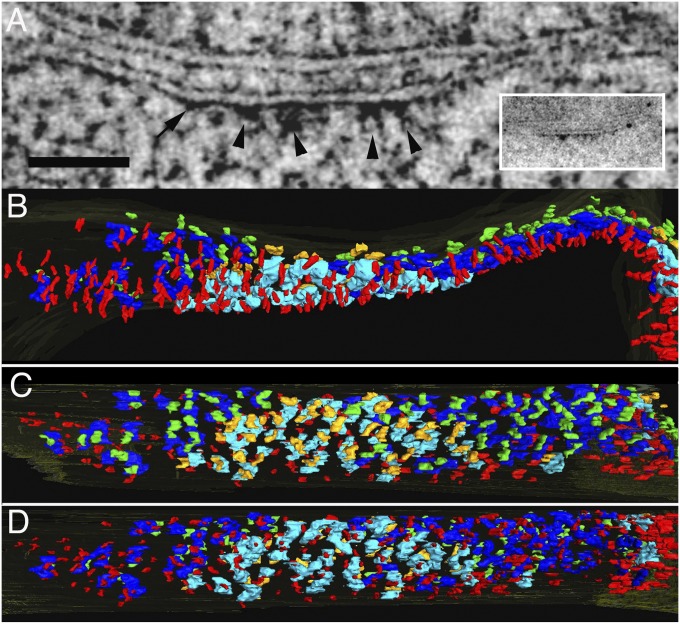
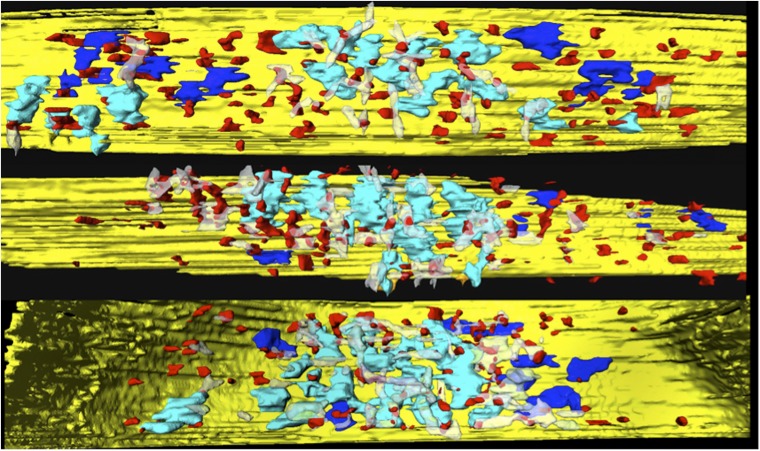
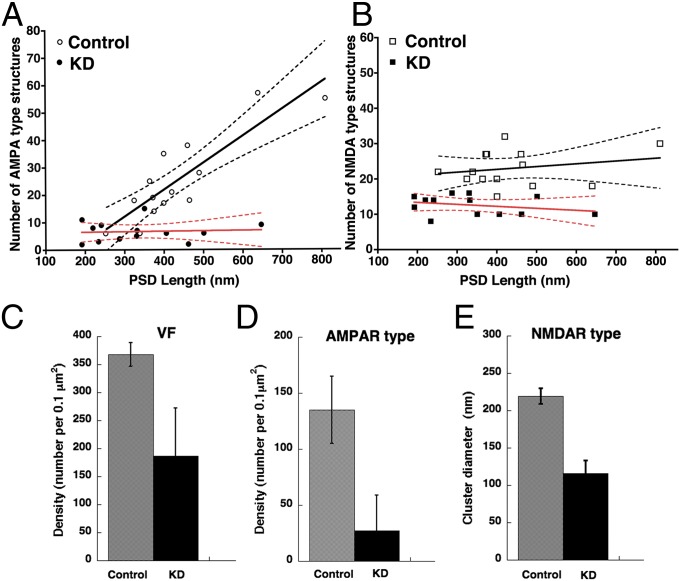
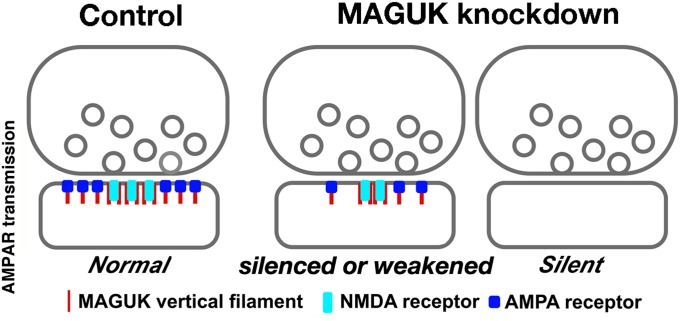
The postsynaptic density (PSD)-95 family of membrane-associated guanylate kinases (MAGUKs) are major scaffolding proteins at the PSD in glutamatergic excitatory synapses, where they maintain and modulate synaptic strength. How MAGUKs underlie synaptic strength at the molecular level is still not well understood. Here, we explore the structural and functional roles of MAGUKs at hippocampal excitatory synapses by simultaneous knocking down PSD-95, PSD-93, and synapse-associated protein (SAP)102 and combining electrophysiology and transmission electron microscopic (TEM) tomography imaging to analyze the resulting changes. Acute MAGUK knockdown greatly reduces synaptic transmission mediated by α-amino-3-hydroxyl-5-methyl-4-isoxazole-propionate receptors (AMPARs) and N-methyl-d-aspartate receptors (NMDARs). This knockdown leads to a significant rise in the number of silent synapses, diminishes the size of PSDs without changes in pre- or postsynaptic membrane, and depletes the number of membrane-associated PSD-95-like vertical filaments and transmembrane structures, identified as AMPARs and NMDARs by EM tomography. The differential distribution of these receptor-like structures and dependence of their abundance on PSD size matches that of AMPARs and NMDARs in the hippocampal synapses. The loss of these structures following MAGUK knockdown tracks the reduction in postsynaptic AMPAR and NMDAR transmission, confirming the structural identities of these two types of receptors. These results demonstrate that MAGUKs are required for anchoring both types of glutamate receptors at the PSD and are consistent with a structural model where MAGUKs, corresponding to membrane-associated vertical filaments, are the essential structural proteins that anchor and organize both types of glutamate receptors and govern the overall molecular organization of the PSD.

Keywords: AMPAR; EM tomography; MAGUKs; NMDAR; knockdown.


Conflict of interest statement

The authors declare no conflict of interest.

Figures

Fig. 1.
Fig. 1.
Triple knockdown of PSD MAGUKs. (A) CAG hybrid promoter drives EGFP with a synthetic 3′ UTR containing miRNA sequences targeting PSD-93, PSD-95, and SAP102. (B) Efficient transduction of miRNA by lentivirus in dissociated hippocampal neurons. (B, Upper) Confocal image of hippocampal cultures infected with control Lenti-GFP (Left), DIC image of the same field showing the prominent cell bodies of neurons appearing as dark dots (Center), and overlay showing that essentially all cell bodies in field are infected (Right). (B, Lower) Hippocampal cultures infected with lentivirus miRNA that knocks down PSD-95, PSD-93 and SAP102 (triple-MAGUK knockdown) (Left), DIC image of the same field showing the cell bodies of neurons (Center), and overlay showing that essentially all cells are infected (Right). (C) Infection of dissociated hippocampal neurons with lentivirus expressing the MAGUK miRNA construct substantially reduces the amount of PSD-95, PSD-93, and SAP102 protein. (D1) Simultaneous recording setup with two recording electrodes and stimulation electrode. (D2) High-resolution depiction of recording setup showing simultaneous recording of a transfected fluorescent neuron and a neighboring control neuron. (E1 and E2) Scatter plots showing reductions in AMPAR EPSCs in MAGUK miRNA-transfected neurons compared with untransfected controls. The scatter plots of EPSCs show single pairs (open circles) and mean ± SEM (filled circle) (AMPAR, 26.6 ± 4.8% control, P < 0.01, n = 10). (F1 and F2) Scatter plots showing reductions in NMDAR EPSCs in MAGUK miRNA-transfected neurons compared with untransfected controls (NMDAR, 39.3 ± 7.0% control, P < 0.01, n = 10). The scatter plots of EPSCs show single pairs (open circles) and mean ± SEM (filled circle). (G) Representative average mEPSC traces showing control (black) and experimental (green) mEPSCs. (H1) mEPSC amplitude in neurons expressing MAGUK miRNA. The plot shows single pairs (open circles) and means ± SEM (filled circles). mEPSC amplitude is significantly reduced in neurons expressing MAGUK miRNA (control, −12.86 ± 0.58 pA; miRNA, −10.75 ± 0.72 pA, n = 8, P < 0.05). (H2) The cumulative distribution of mEPSC amplitude. Control is shown in black, and experimental is in green. The cumulative distribution functions show no irregularities. (I) Representative sample traces of mEPSC frequency recorded in the presence of 0.5 µM TTX. (J1 and J2) mEPSC frequency plot showing single pairs (open circles) and means ± SEM (filled circles). mEPSC frequency is significantly reduced in neurons expressing MAGUK miRNA (control, 3.96 ± 1.12 Hz; miRNA, 0.75 ± 0.14 Hz, n = 8, P < 0.05). The cumulative distribution plot shows no irregularities.
Fig. S1.
Fig. S1.
RT-PCR shows that infection of dissociated hippocampal neurons with lentivirus expressing MAGUK miRNA significantly reduces PSD-93, PSD-95, and SAP102 mRNA levels (SI Materials and Methods).
Fig. S2.
Fig. S2.
Detection threshold causes underestimate of quantal size decrease. (A) Average traces from single neurons recorded in the presence of Sr2+ sequentially at −70 mV (black) and subsequently at −20 mV (green). Synchronous response occurs immediately after stimulation. Asynchronous responses do not occur at fixed intervals and therefore do not appear in the average trace (C). (Scale bars: 100 ms and 20 pA.) (B) Comparison of synchronous responses replotted from A (Left), with average aEPSCs obtained from asynchronous responses recorded at −70 mV (black) or −20 mV (green) (Right). (Scale bars: Left, 10ms and 20pA; Right, 10 ms and 3 pA.) The dotted line is drawn from the peak of synchronous response to illustrate expected aEPSC amplitude with no detection threshold. (C) Representative sample traces of aEPSCs recorded in the presence of Sr2+ at −70 mV (black) or −20 mV (green); 50 ms following stimulation (gray box) was excluded from aEPSC analysis. (Scale bars: 100 ms and 20 pA.) (D1) Scatter plot shows a reduction in AMPAR EPSC following membrane potential change from −70 to −20 mV (P = 0.001, n = 11). The scatter plot shows sequential recordings performed in individual neurons (open circles) and mean ± SEM (filled circle). (D2) Summary graph showing average EPSC reduction of 70.77%. (E) aEPSC amplitude is reduced following membrane potential change from −70 to −20 mV (P < 0.0001, n = 10). The plot shows single pairs (open circles) and means ± SEM (filled circles). (F) Apparent aEPSC frequency is significantly reduced (P = 0.002, n = 10) following membrane potential change from −70 to −20 mV. The plot shows single pairs (open circles) and means ± SEM (filled circles).
Fig. 2.
Fig. 2.
Triple-MAGUK knockdown reduces PSD length. (A) Electron micrograph of a spine synapse from a control showing typical continuous electron-dense PSD. (BD) PSDs appear as several shorter segments after knockdown. Knocked down synapses (B) are initially identified by the immunogold label for the GFP reporter. (E) Normalized distributions of PSD lengths in control (no virus control, green; GFP control, red) and in triple-MAGUK knockdown (black). (F) PSD length correlates with the length of the spine contact with the presynaptic terminal in controls (green: no virus control, n = 77, P < 0.001; red: Lenti-GFP control, n = 101, P < 0.001) but not after triple-MAGUK knockdown (black, n = 113, 0.1 < P < 0.2). (G) PSD length, but not contact of the spine with the presynaptic terminal, is reduced by ∼50% by triple-MAGUK knockdown. (Scale bar: 100 nm.)
Fig. 3.
Fig. 3.
Effect of triple-MAGUK knockdown on PSD length analyzed by STEM tomography. STEM tomography of micrometer thick plastic sections through hippocampal cultures allows entire PSDs to be rendered in 3D. (A) Exploded view of a tomogram with an 8.4 × 8.4 × 1.2 μm volume (8.2 nm per pixel; 1,024 × 1,024 × 147 voxel data volume) from a plastic section through a hippocampal culture after triple-MAGUK knockdown. Numbers on the right designate sizes of arbitrary steps cut out of the tomogram to illustrate its 3D character. Individual PSDs in reconstruction are surface-rendered in red. (B) En face projections of entire PSDs from control (cyan) and triple-MAGUK knockdown (red). (C) Virtual sections from three different levels of a STEM tomogram of a spine synapse with clearly identifiable electron-dense PSD material contained in the reconstructed 3D volume. Section numbers are as follows: 96 (C, Upper Left), 81 (C, Lower Left), and 73 (C, Upper Right) (8.2 nm/pixel). (C, Lower Right) Surface rendering of the same synapse: pre- and postsynaptic membrane (translucent yellow), presynaptic vesicle (translucent green), and PSD (solid blue). (Scale bar: 200 nm.) (D) Histogram comparing the distributions of PSD diameters in control and triple-MAGUK knockdown synapses. PSDdiameter=4×PSDareaπ.
Fig. 4.
Fig. 4.
Transmission electron tomography of the core structure of a PSD derived from ∼100-nm-thick section through a control hippocampal culture. (A) Single virtual section derived from tomogram; arrows point to slender AMPAR-type structure; arrowheads indicate cytoplasmic aspects of larger NMDAR-type structures. Inset shows appearance of PSD in ∼100-nm-thick section in a transmission EM (TEM) image. (Scale bars: 100 nm.) (B) Surface rendering of core elements of PSDs viewed in near cross-section. Red, vertical filaments on the inside surface of PSD; cyan, putative NMDA receptors; blue, putative AMPA receptors. (C) PSD rotated to show the outer surface in en face view; outer parts of the putative NMDA receptors are orange, and outer parts of the putative AMPA receptor are green. The membrane has been rendered as transparent, so the inner parts of the core structure can be shown. (D) PSD rotated, mirror-imaged to align with C and to show its inner surface en face; color coding is the same as described for B and C. Some of the gold and green on the outer aspects of the receptors shows through the transparent membrane.
Fig. 5.
Fig. 5.
A PSD from a spine synapse after triple-MAGUK knockdown shows marked depletion of vertical filaments and putative AMPAR-type structures (arrows) in the same set of views as in Fig. 4. (A) Inset shows TEM image of PSD in an ∼100-nm section. (BD) The putative NMDAR-type structures (arrowheads), in contrast to markedly depleted putative AMPAR-type structures, are still present in a centrally located cluster, albeit with much smaller cluster size than control in Fig. 4. (Scale bars: 100 nm.)
Fig. S3.
Fig. S3.
Three examples of surface-rendered core PSD structures, viewed from the cytoplasmic side of the PSD, after triple-MAGUK knockdown. Vertical filaments and putative AMPAR structures are depleted to variable extents. Yellow, postsynaptic membrane; red, vertical filaments; cyan, cytoplasmic sides of putative NMDAR-type structures; blue, AMPAR-type structures; semitransparent, other structures associated with the core elements.
Fig. 6.
Fig. 6.
Measurements of the triple-MAGUK knockdown effects on core structures in ∼100-nm-thick sections of PSDs reconstructed by EM tomography. (A) Relationship between the number of AMPAR-type structures and maximum PSD length (PSD diameter) under control (open dots) and knockdown (dark dots) conditions. The control data fit to y = 17.19 + 0.098x [solid black line; r = 0.87 (critical value, r = 0.53), P < 0.001] with the intercept of 176 nm in PSD diameter and is plotted with its 95% confidence interval (CI) lines (black dash lines). The AMPAR-type structure number is not correlated with PSD diameter following knockdown [n = 13, r = 0.047 (critical value, r = 0.55), P > 0.5], and the best-fit line (solid red line) is plotted with its 95% CI lines (dash red lines). (B) The number of NMDAR-type structures is independent of maximum PSD length (PSD diameter). Open squares represent control [n = 14, r = 0.22 (critical value, r = 0.53), 0.2 < P < 0.5; the best-fit line and its 95% CI lines are black lines], and black squares represent knockdown [n = 13, r = 0.28 (critical value, r = 0.55), 0.2 < P < 0.5; the best-fit line and its 95% CI lines are red lines]. The near-constant NMDAR number is 23 ± 5 (n = 12, control) and 12 ± 3 (n = 12, knockdown; P < 0.0001). NMDAR number is significantly reduced by knockdown. (C–E) Histograms comparing changes in density of vertical filaments at the reconstructed slabs of PSDs (C) and AMPAR-type structures (D) and sizes of clusters of NMDA-type structures (E) in control and triple-MAGUK knockdowns. VF designates vertical filaments, AMPA type designates AMPAR-type structures, and NMDA type designates NMDAR-type structures. All error bars are SDs.
Fig. 7.
Fig. 7.
MAGUK knockdown decimates the core structure at the PSD. The schematic illustrates the consequences of MAGUK knockdown, based on combined data from electrophysiology and TEM and STEM tomography.

Similar articles

Cited by

References

    1. Palay SL. Synapses in the central nervous system. J Biophys Biochem Cytol. 1956;2(4 Suppl):193–202. - PMC - PubMed
    1. Kennedy MB. Signal-processing machines at the postsynaptic density. Science. 2000;290(5492):750–754. - PubMed
    1. Chen X, et al. Organization of the core structure of the postsynaptic density. Proc Natl Acad Sci USA. 2008;105(11):4453–4458. - PMC - PubMed
    1. Chen X, et al. Nanoscale Imaging of Protein Molecules at the Postsynaptic Density. Springer Science+Business Media; New York: 2014.
    1. Sheng M, Kim E. The postsynaptic organization of synapses. Cold Spring Harb Perspect Biol. 2011;3(12):a005678. - PMC - PubMed

Publication types

MeSH terms

Substances