. 2015 Sep;10(9):1433-40.
doi: 10.4103/1673-5374.165511.

Oxygen-glucose deprivation regulates BACE1 expression through induction of autophagy in Neuro-2a/APP695 cells

Affiliations

Oxygen-glucose deprivation regulates BACE1 expression through induction of autophagy in Neuro-2a/APP695 cells

Rong-Fu Chen et al. Neural Regen Res. 2015 Sep.

Abstract

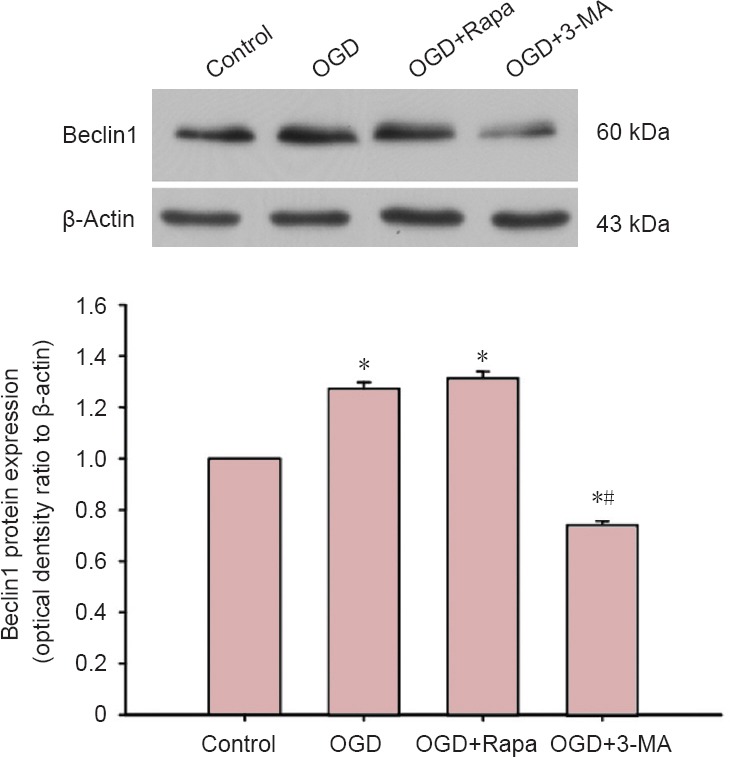
Our previous findings have demonstrated that autophagy regulation can alleviate the decline of learning and memory by eliminating deposition of extracellular beta-amyloid peptide (Aβ) in the brain after stroke, but the exact mechanism is unclear. It is presumed that the regulation of beta-site APP-cleaving enzyme 1 (BACE1), the rate-limiting enzyme in metabolism of Aβ, would be a key site. Neuro-2a/amyloid precursor protein 695 (APP695) cell models of cerebral ischemia were established by oxygen-glucose deprivation to investigate the effects of Rapamycin (an autophagy inducer) or 3-methyladenine (an autophagy inhibitor) on the expression of BACE1. Either oxygen-glucose deprivation or Rapamycin down-regulated the expression of BACE1 while 3-methyladenine up-regulated BACE1 expression. These results confirm that oxygen-glucose deprivation down-regulates BACE1 expression in Neuro-2a/APP695 cells through the introduction of autophagy.

Keywords: 3-methyladenine (3-MA); Rapamycin; autophagy; beta-amyloid peptide; beta-site APP-cleaving enzyme 1 (BACE1); brain Injury; cerebral ischemia; nerve regeneration; neural regeneration; oxygen-glucose deprivation; stroke.


Conflict of interest statement

Conflicts of interest: None declared.

Figures

Figure 1
Figure 1
Effects of autophagy regulation and oxygen-glucose deprivation (OGD) on proliferation rate in Neuro-2a/ amyloid precursor protein 695 cells (cell counting kit-8 assay). Control group: Untreated; OGD group: OGD for 1 hour; OGD + Rapa group: pretreated with Rapamycin (200 ng/mL) for 1 hour followed by OGD for 1 hour in the presence of Rapamycin (200 ng/mL); OGD + 3-MA group: pretreated with 3-methyladenine (5 mM) for 1 hour followed by OGD in the presence of 3-methyladenine (5 mM). *P < 0.05, vs. control group (mean ± SD, one-way analysis of variance followed by the least significance difference post hoc test). The experiment was replicated three times, and there were at least triplicate wells for each trial.
Figure 2
Figure 2
Effects of autophagy regulation and oxygen-glucose deprivation (OGD) on apoptosis ratio in Neuro-2a/amyloid precursor protein 695 cells (flow cytometry). Control group: Untreated; OGD group: OGD for 1 hour; OGD + Rapa group: pretreated with Rapamycin (200 ng/mL) for 1 hour followed by OGD for 1 hour in the presence of Rapamycin (200 ng/mL); OGD + 3-MA group: pretreated with 3-methyladenine (5 mM) for 1 hour followed by OGD in the presence of 3-methyladenine (5 mM). In cell clustering of flow cytometer, Q1 represents live cells, Q2 represents necrotic or late apoptotic cells, Q3 represents cells with mechanical injury, and Q4 represents early apoptotic cells. *P < 0.05, vs. control group (mean ± SD, one-way analysis of variance followed by the least significance difference post hoc test). The experiment was replicated three times.
Figure 3
Figure 3
Effects of autophagy regulation and oxygen-glucose deprivation (OGD) on microtubule-associated protein 1 light chain 3 (LC3) expression in Neuro-2a/amyloid precursor protein 695 cells (western blot assay). Control group: Untreated; OGD group: OGD for 1 hour; OGD + Rapa group: pretreated with Rapamycin (200 ng/mL) for 1 hour followed by OGD for 1 hour in the presence of Rapamycin (200 ng/mL); OGD + 3-MA group: pretreated with 3-methyladenine (5 mM) for 1 hour followed by OGD in the presence of 3-MA (5 mM). *P < 0.05, vs. control group (mean ± SD, one-way analysis of variance followed by the least significance difference post hoc test). The experiment was replicated three times.
Figure 4
Figure 4
Effects of autophagy regulation and oxygen-glucose deprivation (OGD) on Beclin1 expression in Neuro-2a/amyloid precursor protein 695 cells (western blot assay). Control group: Untreated; OGD group: OGD for 1 hour; OGD + Rapa group: pretreated with Rapamycin (200 ng/mL) for 1 hour followed by OGD for 1 hour in the presence of Rapamycin (200 ng/mL); OGD + 3-MA group: pretreated with 3-methyladenine (5 mM) for 1 hour followed by OGD in the presence of 3-methyladenine (5 mM). *P < 0.05, vs. control group; #P < 0.05, vs. OGD + Rapa group (mean ± SD, one-way analysis of variance followed by the least significance difference post hoc test). The experiment was replicated three times.
Figure 5
Figure 5
Effects of autophagy regulation and oxygen-glucose deprivation (OGD) on BACE1 expression in Neuro-2a/amyloid precursor protein 695 cells (western blot assay). Control group: Untreated; OGD group: OGD for 1 hour; OGD + Rapa group: pretreated with Rapamycin (200 ng/mL) for 1 hour followed by OGD for 1 hour in the presence of Rapamycin (200 ng/mL); OGD + 3-MA group: pretreated with 3-methyladenine (5 mM) for 1 hour followed by OGD in the presence of 3-methyladenine (5 mM). *P < 0.05, vs. OGD group; #P < 0.05, vs. OGD + Rapa group (mean ± SD, one-way analysis of variance followed by the least significance difference post hoc test). The experiment was replicated three times. BACE1: Beta-site APP-cleaving enzyme 1.
Figure 6
Figure 6
Effects of autophagy regulation and oxygen-glucose deprivation (OGD) on the morphology and ultrastructure of Neuro-2a/amyloid precursor protein 695 cells (transmission electron microscopy). Control group: Untreated; (B) OGD group: OGD for 1 hour; (C) OGD + Rapa group: pretreated with Rapa (200 ng/mL) for 1 hour followed by OGD for 1 hour in the presence of Rapamycin (200 ng/mL); (D) OGD + 3-MA group: pretreated with 3-methyladenine (5 mM) for 1 hour followed by OGD in presence of 3-methyladenine (5 mM). In B, red arrows indicate autolyosomes. In C, red arrows indicate autophagosomes that are in the process of formation. Blue arrows in every plot mark mitochondria. Scale bars: 500 nm. N: Nucleus; M: mitochondria; AL: autolyosome; AP: autophagosome; 3-MA: 3-methyladenine.

References

    1. Boland B, Kumar A, Lee S, Platt FM, Wegiel J, Yu WH, Nixon RA. Autophagy induction and autophagosome clearance in neurons: relationship to autophagic pathology in Alzheimer's disease. J Neurosci. 2008;28:6926–6937. - PMC - PubMed
    1. Bulbarelli A, Lonati E, Brambilla A, Orlando A, Cazzaniga E, Piazza F, Ferrarese C, Masserini M, Sancini G. Abeta42 production in brain capillary endothelial cells after oxygen and glucose deprivation. Mol Cell Neurosci. 2012;49:415–422. - PubMed
    1. Chetelat G, Villemagne VL, Villain N, Jones G, Ellis KA, Ames D, Martins RN, Masters CL, Rowe CC, Group AR. Accelerated cortical atrophy in cognitively normal elderly with high beta-amyloid deposition. Neurology. 2012;78:477–484. - PubMed
    1. Cole SL, Vassar R. The Alzheimer's disease beta-secretase enzyme, BACE1. Mol Neurodegener. 2007;2:22. - PMC - PubMed
    1. Dirnagl U, Iadecola C, Moskowitz MA. Pathobiology of ischaemic stroke: an integrated view. Trends Neurosci. 1999;22:391–397. - PubMed

LinkOut - more resources