. 2015 Dec 10;528(7581):225-30.
doi: 10.1038/nature16169. Epub 2015 Nov 25.

Immune homeostasis enforced by co-localized effector and regulatory T cells

Affiliations

Immune homeostasis enforced by co-localized effector and regulatory T cells

Zhiduo Liu et al. Nature. .

Abstract

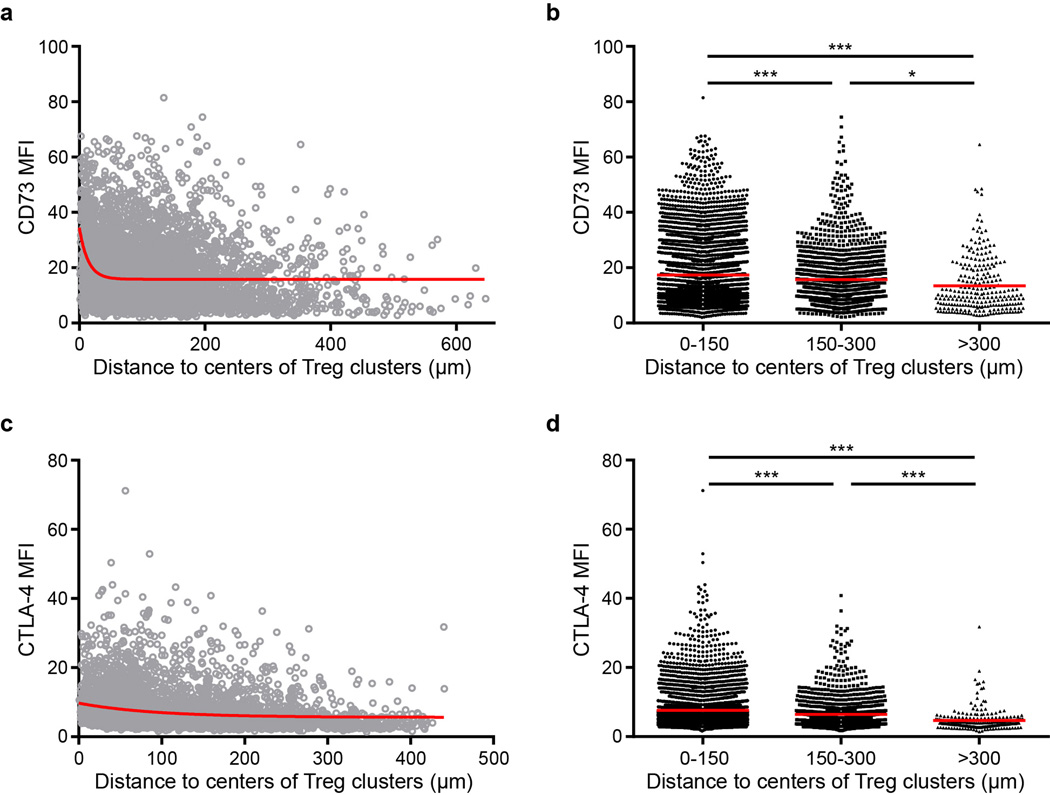
FOXP3(+) regulatory T cells (Treg cells) prevent autoimmunity by limiting the effector activity of T cells that have escaped thymic negative selection or peripheral inactivation. Despite the information available about molecular factors mediating the suppressive function of Treg cells, the relevant cellular events in intact tissues remain largely unexplored, and whether Treg cells prevent activation of self-specific T cells or primarily limit damage from such cells has not been determined. Here we use multiplex, quantitative imaging in mice to show that, within secondary lymphoid tissues, highly suppressive Treg cells expressing phosphorylated STAT5 exist in discrete clusters with rare IL-2-positive T cells that are activated by self-antigens. This local IL-2 induction of STAT5 phosphorylation in Treg cells is part of a feedback circuit that limits further autoimmune responses. Inducible ablation of T cell receptor expression by Treg cells reduces their regulatory capacity and disrupts their localization in clusters, resulting in uncontrolled effector T cell responses. Our data thus reveal that autoreactive T cells are activated to cytokine production on a regular basis, with physically co-clustering T cell receptor-stimulated Treg cells responding in a negative feedback manner to suppress incipient autoimmunity and maintain immune homeostasis.


Figures

Extended Data Figure 1
Extended Data Figure 1. Role of IL-2 in induction of pSTAT5 in Tregs
a, Representative flow data showing pSTAT5 staining of Tregs from lymphoid organs as indicated after treatment with isotype Ab or IL-2 neutralizing Ab (1 mg per mouse) for 24 hours. The numbers in the quadrants indicate the percentages of cells in each quadrant. pLN, Popliteal LN; iLN, inguinal LN; mLN, mesenteric LN. b, Quantification of pSTAT5+ Tregs. Results are representative of two independent experiments. c, Detection of pSTAT5+ Tregs in WT, IL-2 KO and IL-15 KO mice. The numbers in the quadrants indicate the percentages of cells in each quadrant. Results are representative of two independent experiments. ***p<0.001 as calculated by two-tailed Student’s t test.
Extended Data Figure 2
Extended Data Figure 2. Spatial correlation between IL-2+ cells and pSTAT5+ Treg clusters
a, A positive control showing immunofluorescence staining of IL-2 in situ, and the comparison of IL-2 detection sensitivity between flow cytometry and Histo-cytometry. OVA323-339 peptide loaded splenic DCs (cyan) were stained with CMTMR and injected into the footpad, and RAG2−/− TCR transgenic OT-II CD4+ T cells (green) stained with CMFDA were transferred 18 hours post-transfer of DCs. For each recipient, 16 hours after T cell transfer, one draining popliteal LN was isolated for IL-2 (red) immunofluorescence staining, while the contralateral one for intracellular IL-2 staining ex vivo. Each dot in the middle panel of the upper row indicates a LN. *p < 0.05 as calculated by two-tailed Student’s t test. b, Immunofluorescence staining of IL-2 and pSTAT5 in LN from EGFP-Foxp3 reporter mice. Upper row indicates an IL-2+ cell associated with clustered Tregs among a group of pSTAT5+ Tregs. Lower row indicates an unassociated IL-2+ cell surrounded by a group of pSTAT5+ Tregs. c, Quantification of IL-2+ cells associated or unassociated with Treg clusters. Data are pooled from 7 LN.
Extended Data Figure 3
Extended Data Figure 3. Phenotypic characterization of IL-2-producing cells in the steady state in IL-2WT/GFP heterozygous mice
a, Representative flow data showing the phenotypes of cells from inguinal LN of WT or IL-2WT/GFP heterozygous mice. b, Quantification of the percentages of CD4+ and CD8+ cells within GFP+CD3+ population from different lymphoid organs (n=3, mean+/−s.e.m.). iLN, inguinal LN; mLN, mesenteric LN.
Extended Data Figure 4
Extended Data Figure 4. Histo-cytometry analysis of DC subsets associated with Treg clusters
a, Immunofluorescence staining of an inguinal LN section from Foxp3-EGFP mice (upper row) and Histo-cytometry analysis of DC subsets (lower row). Surfaces for each identified DC subset are shown in Fig. 2b. Briefly, DC surfaces were created based on a new channel (DC = CD11c + MHC-II -CD3/B220), and DC surface markers (CD11c, MHC-II, CD11b and CD8) were gated within CD11c+MHC-II+CD3B220 voxels to exclude non-DCs. b, Gating strategy for the phenotypic characterization of DC subsets associated with pSTAT5+ or pSTAT5 Treg clusters.
Extended Data Figure 5
Extended Data Figure 5. CD86 expression on DCs associated with Treg clusters
a, Representative images showing immunofluorescence staining of CD86 in LN from EGFP-Foxp3 reporter mice. b, Histo-cytometry analysis of CD11c, MHC-II, and CD86 expression for DCs associated or unassociated with Treg clusters. c-d, Quantification of percentages of CD86high (c) and CD86 MFI (d) in different DC subsets. Each dot indicates a section. 6 sections from 3 inguinal LN. ***p<0.001 in (c) as calculated by two-tailed Student’s t test. ***p<0.001 and ns in (d) as calculated by One-way ANOVA with Tukey’s post-test.
Extended Data Figure 6
Extended Data Figure 6. The correlation between CD73/CTLA-4 expression on Tregs and their distance to the center of Treg clusters
Regression analysis of CD73 (a, b) and CTLA-4 (c, d) based on images shown in Fig. 3e, g. Each circle in (a, c) or each dot in (b, d) indicates a Treg cell. The red lines in (a, c) indicate the trend lines. ***p < 0.001 and *p < 0.05 as calculated by One-way ANOVA with Tukey’s post-test.
Extended Data Figure 7
Extended Data Figure 7. Role of TCR signaling in high expression of CD73 and CTLA-4 in Tregs
Immunofluorescence staining of CD73 (a) and CTLA-4 (c) in mesenteric LN sections from TracWT/WTFoxp3eGFP-Cre-ERT2 and TracFL/FLFoxp3eGFP-Cre-ERT2 mice 7 days after tamoxifen treatment. CD73 and CTLA-4 signals were gated on EGFP+ Tregs. (b, d) Histo-cytometry analysis of CD73 and CTLA-4 MFI in indicated cell populations from the sections shown in (a, c). Error bars represent mean+/−SD. The dots in the yellow rectangles in the left panels indicate CD73high or CTLA-4high Tregs. The right panels in (b, d) show the distribution pattern of the gated WT CD73high and CTLA-4high Tregs (in left panels) in sections. Arrows indicate CD73high and CTLA-4high Tregs in representative clusters. ***p < 0.001 as calculated by One-way ANOVA with Tukey’s post-test.
Figure 1
Figure 1. pSTAT5+ Treg clusters in lymph nodes
a, Immunofluorescence staining of an inguinal LN section from SPF Foxp3-EGFP mice. Arrows indicate representative pSTAT5+ Treg clusters. b, Extraction of pSTAT5+ Treg profiles from images of sections and further transformation of these data into a contour plot. c, The correlation between pSTAT5 intensity in Tregs and their distance to the nearest center of a pSTAT5+ cluster. Each dot indicates a pSTAT5+ Treg cell in (b). d, Localization of an IL-2 producing cell within a pSTAT5+ Treg cluster. e, Flow cytometry analysis of pSTAT5+ Tregs in different lymphoid organs from SPF and germ-free mice. iLN, inguinal LN; mLN, mesenteric LN. Each dot indicates a single mouse. Results are pooled from three independent experiments. f, Immunofluorescence staining of an inguinal LN section from germ-free mice. Arrows indicate representative pSTAT5+ Treg clusters. **p<0.01 and ***p<0.001 in (c) as calculated by One-way ANOVA with Tukey’s post-test. ***p<0.001 in (e) as calculated by two-tailed Student’s t test.
Figure 2
Figure 2. Preferential role of migratory DC in Treg clustering
a, A representative image showing association of a Treg cluster with a CD11c+MHC-II+ DC (arrow). b, Distribution of Treg clusters and different DC subsets in an inguinal LN section from a Foxp3-EGFP mouse. Creation of surfaces for each cell type was performed based on immunofluorescence staining and subsequent Histo-cytometry analysis as shown in Fig. S4A. Treg clusters were determined by setting a threshold for the volume within Treg surfaces created in the EGFP channel without object splitting. c, Quantification of the percentages of migratory DCs associated with Treg clusters. Each dot indicates a section, with a total of 6 sections from 3 LN analyzed. d, Phenotypic characterization of DCs associated with pSTAT5+ and pSTAT5 Treg clusters (n=6, 6 LN from 6 mice, mean+/−s.e.m., pooled from 2 experiments). ***p<0.001 in (c) as calculated by two-tailed Student’s t test. *p < 0.05 in (d) as calculated by One-way ANOVA with Tukey’s post-test.
Figure 3
Figure 3. Highly suppressive phenotype of clustered Tregs
a, Immunofluorescence staining of CD73 in a popliteal LN section from a Foxp3-EGFP mouse. CD73 signals were gated on EGFP+ Tregs. Yellow dots indicate the distribution of CD73high Tregs. b, The correlation between CD73 intensity of Tregs and the distance of the Tregs to the center of LN. Each dot indicates a Treg cell shown in (a). c, Immunofluorescence staining of CTLA-4 in a popliteal LN section from a Foxp3-EGFP mouse. CTLA-4 signals were gated on EGFP+ Tregs. Yellow dots indicate the distribution of CTLA-4high Tregs. d, The correlation between CTLA-4 intensity of Tregs and the distance of these Tregs to the center of LN. Each dot indicates a Treg cell shown in (c). (E) Representative images showing CD73 staining in Treg clusters. Arrows indicate Treg clusters. f, Quantification of CD73 expression on Tregs inside or outside of clusters (n=4, 4 LN from 4 mice). Results are representative of two independent experiments. g, Representative images showing CTLA-4 staining in Treg clusters. Arrows indicate Treg clusters. h, Quantification of CTLA-4 expression on Tregs inside or outside of clusters (n=4, 4 LN from 4 mice). Results are representative of two independent experiments. ***p<0.001 in (b, d) as calculated by One-way ANOVA with Tukey’s post-test. **p<0.01 in (f, h) as calculated by two-tailed Student’s t test.
Figure 4
Figure 4. Role of Treg TCR expression in clustering and suppression
a, Detection of TCRa on CD4+ LN T cells from TracWT/WTFoxp3eGFP-Cre-ERT2 and TracFL/FLFoxp3eGFP-Cre-ERT2 mice 7 days after tamoxifen treatment. Numbers adjacent to outlined areas indicate the percentages of cells in each area. b, Immunofluorescence staining of mesenteric LN sections from TracWT/WTFoxp3eGFP-Cre-ERT2 (upper panel) and TracFL/FLFoxp3eGFP-Cre-ERT2 (lower panel) mice treated as in (a). Quantification of Treg density in T cell zone (c), percentage of Tregs forming clusters (d), Treg density in pSTAT5+ clusters (e), and percentage of pSTAT5+ Tregs (f). mLN, mesenteric LN; iLN, inguinal LN; panLN, pancreatic LN. Each dot indicates a section, and each type of LN includes 6 sections from 2 LN from 2 individual mice. **p<0.01 and ***p<0.001 as calculated by two-tailed Student’s t test.
Figure 5
Figure 5. Role of IL-2 feedback in Treg-mediated suppression
a, Quantification of percentages and absolute numbers of Tregs in IL-2WT/GFP reporter mice treated with isotype control Ab or IL-2 neutralizing Ab (1 mg per mouse daily) for 8 days. b, Left panel: representative flow data showing detection of GFP+CD4+ cells in different lymphoid organs from IL-2WT/GFP reporter mice treated as in (a); right panel: Quantification of percentages and absolute numbers of GFP+CD4+. Each dot in (a, b) indicates a single mouse. Results are representative of two independent experiments. c, Confocal imaging of popliteal LN 24 hours after transfer with PCC peptide loaded splenic DCs and WT or IL-2−/− 5C.C7 transgenic RAGII−/− T cells. d, Quantification of interaction time between DCs and WT or IL-2−/− 5C.C7 transgenic RAGII−/− T cells from 4 independent 2P intravital imaging experiments. To control experimental preparation and to permit data comparison between different experiments, polyclonal T cells were co-transferred with each type of 5C.C7 cells. See also Movie 2. e, Cellular interaction time for individual cells pooled from 4 experiments. ***p < 0.001, **p < 0.01, and *p < 0.05 in (a, b) as calculated by two-tailed Student’s t test. ***p<0.001 and ns in (d, e) as calculated by One-way ANOVA with Tukey’s post-test.

Comment in

References

    1. Benoist C, Mathis D. Treg cells, life history, and diversity. Cold Spring Harbor perspectives in biology. 2012;4:a007021. - PMC - PubMed
    1. Josefowicz SZ, Lu LF, Rudensky AY. Regulatory T cells: mechanisms of differentiation and function. Annual review of immunology. 2012;30:531–564. - PMC - PubMed
    1. Xing Y, Hogquist KA. T-cell tolerance: central and peripheral. Cold Spring Harbor perspectives in biology. 2012;4 - PMC - PubMed
    1. Vignali DA, Collison LW, Workman CJ. How regulatory T cells work. Nature reviews. Immunology. 2008;8:523–532. - PMC - PubMed
    1. Shevach EM. Mechanisms of foxp3+ T regulatory cell-mediated suppression. Immunity. 2009;30:636–645. - PubMed

Publication types

Substances