. 2015 Dec 10;528(7581):231-6.
doi: 10.1038/nature16143. Epub 2015 Nov 25.

Molecular structures of unbound and transcribing RNA polymerase III

Affiliations

Molecular structures of unbound and transcribing RNA polymerase III

Niklas A Hoffmann et al. Nature. .

Abstract

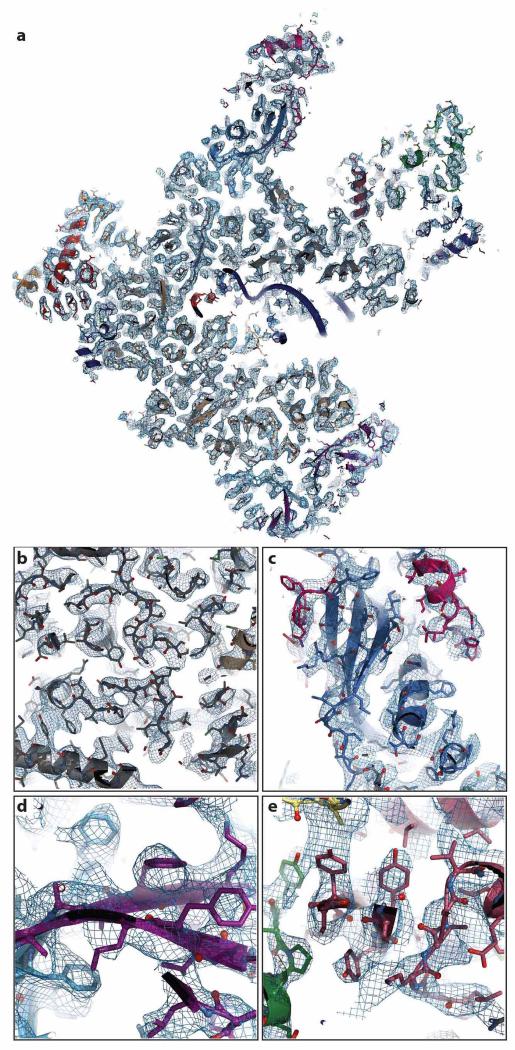
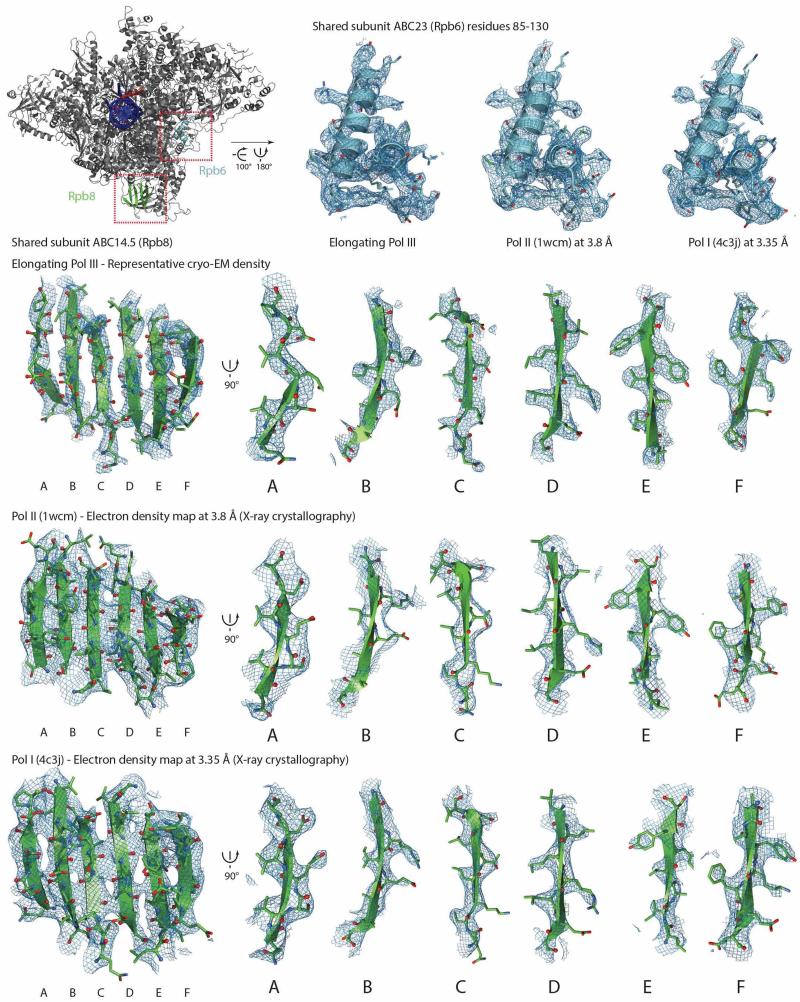
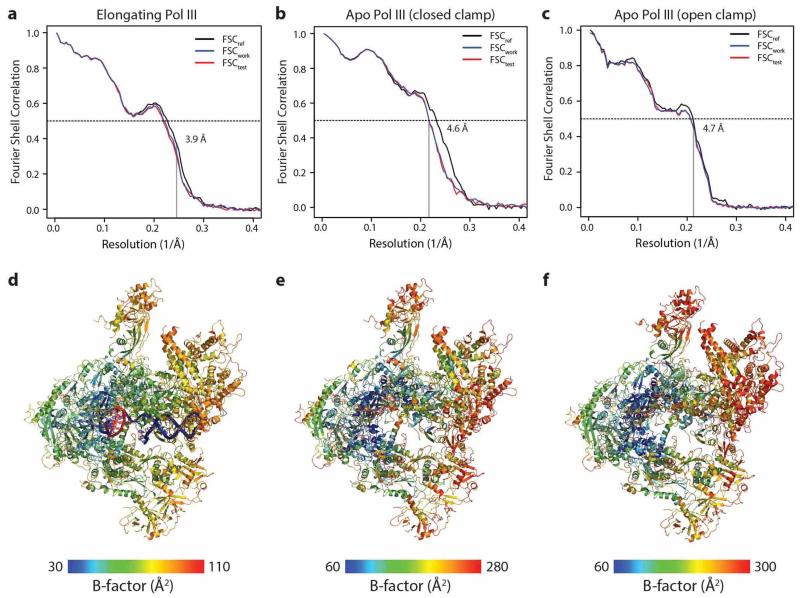
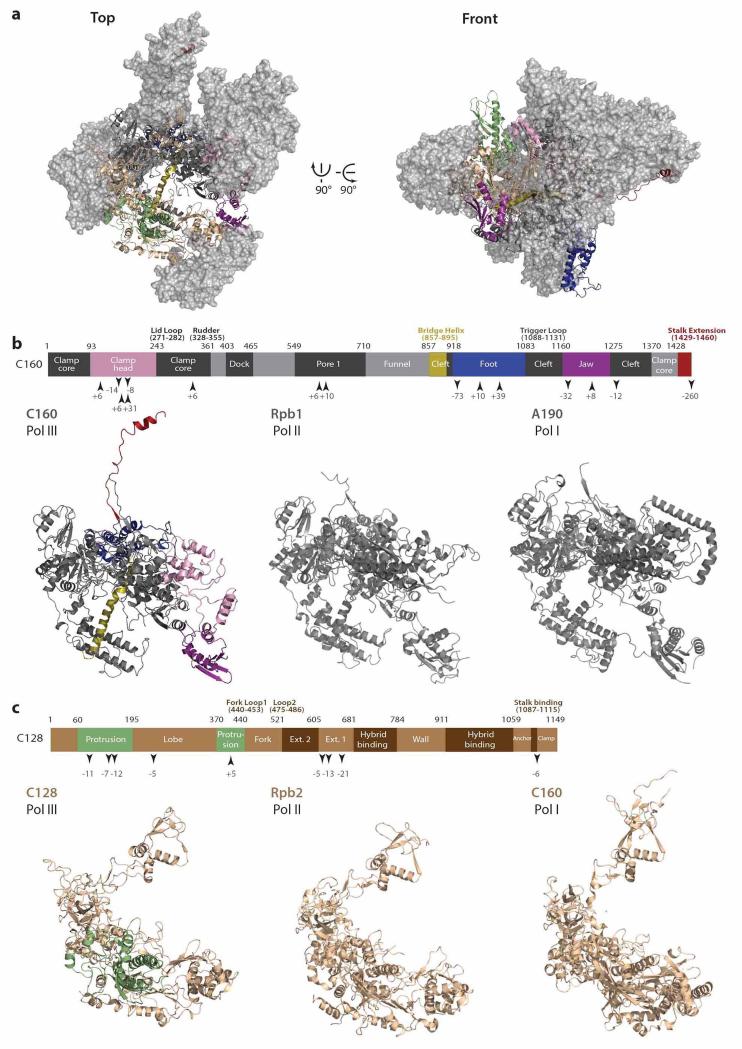
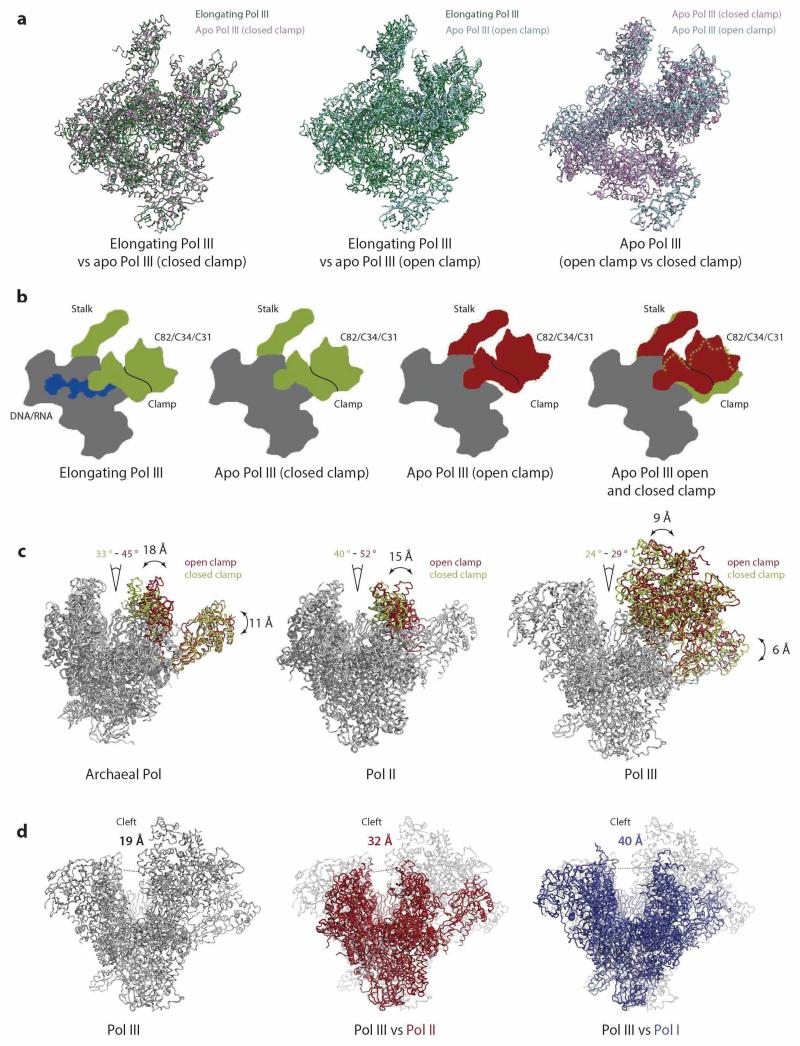
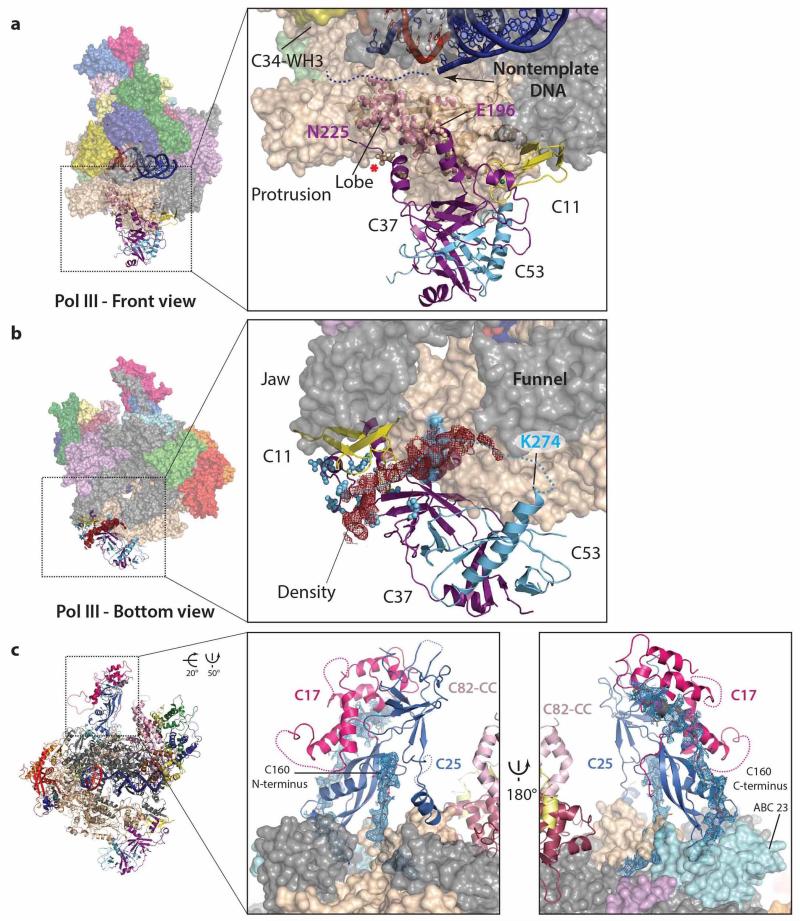
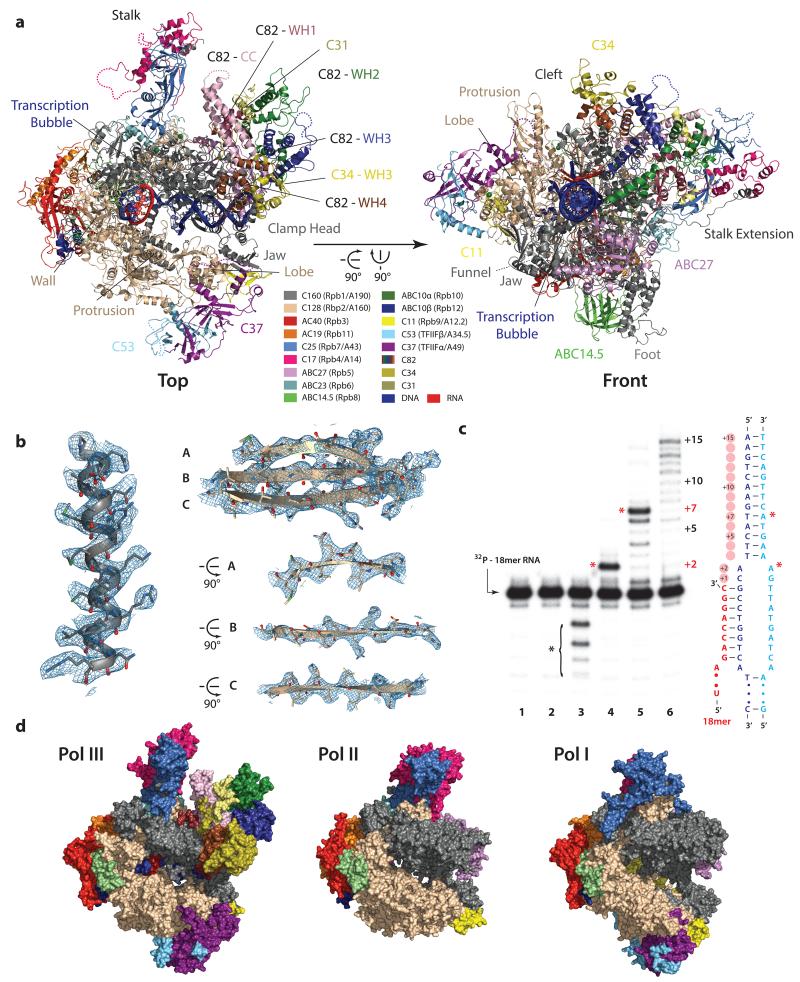
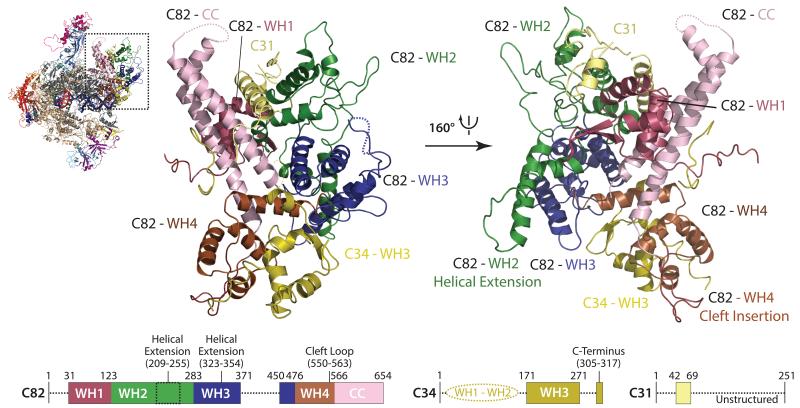
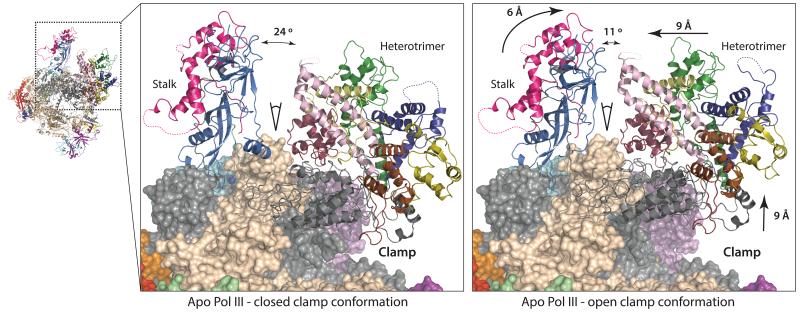
Transcription of genes encoding small structured RNAs such as transfer RNAs, spliceosomal U6 small nuclear RNA and ribosomal 5S RNA is carried out by RNA polymerase III (Pol III), the largest yet structurally least characterized eukaryotic RNA polymerase. Here we present the cryo-electron microscopy structures of the Saccharomyces cerevisiae Pol III elongating complex at 3.9 Å resolution and the apo Pol III enzyme in two different conformations at 4.6 and 4.7 Å resolution, respectively, which allow the building of a 17-subunit atomic model of Pol III. The reconstructions reveal the precise orientation of the C82-C34-C31 heterotrimer in close proximity to the stalk. The C53-C37 heterodimer positions residues involved in transcription termination close to the non-template DNA strand. In the apo Pol III structures, the stalk adopts different orientations coupled with closed and open conformations of the clamp. Our results provide novel insights into Pol III-specific transcription and the adaptation of Pol III towards its small transcriptional targets.


Figures

Extended Data Figure 1
Extended Data Figure 1. Pol III processing pipeline, Fourier-shell correlation (FSC) curves and local resolution assessment
a, Exemplary micrograph section of elongating Pol III. All micrographs were low-pass filtered for particle picking. b, General processing pipeline. The orange boxes display micrograph number and particles for elongating Pol III (left) and apo Pol III (right). The middle panel shows the general workflow that was followed for both datasets. For elongating Pol III (bottom left), a local classification step yielded one class with 49 k particles (purple) that was subsequently refined and post-processed. For apo Pol III (bottom right), local classification diverged into two classes (purple) with 69 k particles and 52 k particles that were subsequently refined and post-processed. c, Fourier-shell correlation (FSC) and local resolution assessment with RESMAP. All FSC calculations were performed with two independent half maps using RELION’s masking procedure. The resolution for the elongating Pol III cryo-EM map (top panel) is 3.9 Å according to the FSC 0.143 criterion, indicated by the black dashed line. The two apo Pol III cryo-EM reconstructions have a resolution of 4.6 Å (closed clamp Pol III, middle panel) and 4.7 Å (open clamp Pol III, bottom panel) according to the FSC 0.143 criterion. Local resolution is displayed on the post-processed full maps (first image column on the right) and a cross-section representation (second image column on the right). In both apo Pol III reconstructions, the peripheral subcomplexes show a strong decay in resolution compared to the core. In the elongating Pol III reconstruction, the resolution is more uniformly distributed indicating stabilization of peripheral subunits.
Extended Data Figure 2
Extended Data Figure 2. Representative sections of the cryo-EM density for elongating Pol III
a, Cross-section of elongating Pol III in ribbon and stick representation, embedded in the experimental density at 3.9 Å, displayed in tungsten. b, Section displaying the core subunits C160 (grey) and C128 (wheat) shown in stick and ribbon representation. The experimental density of the core (tungsten) is well defined and has been filtered at 3.5 Å resolution for display. c, Section of stalk subunits C25 (blue) and C17 (pink). The estimated local resolution in this part is lower compared to the core (Extended Data Table 2). In panel c, d and e, the cryo-EM density is shown at 3.9 Å resolution. d, Section showing subunits C53 (purple) and C37 (lanthanum). e, Close-up view of C82-WH1 (brown), C82–WH2 (green) and C31 (yellow) interface.
Extended Data Figure 3
Extended Data Figure 3. Comparison of electron microscopy densities with X-ray electron densities for shared subunits ABC23 (Rpb6) and ABC14.5 (Rpb8)
Top left shows Pol III in front view, a stretch in ABC23 (cyan) and ABC14.5 (green) is colored. The red boxes indicate the regions that are enlarged in the neighboring panels. Corresponding density is displayed in tungsten. Models of Pol II and Pol I at nominally higher resolution are available, but for better comparison models in a similar resolution range are shown. For the 2Fo-Fc electron density maps obtained by X-ray crystallography a threshold of 1σ was used for display. The top right shows three close-up views of the shared subunit ABC23 from elongating Pol III, Pol II (PDB 1wcm) and Pol I (PDB 4c3j). The bottom panels show 6 strands of shared subunit ABC14.5. Front view of the β- sheet and orthogonal views of individual strands in elongating Pol III, Pol II (PDB 1wcm) and Pol I (PDB 4c3j).
Extended Data Figure 4
Extended Data Figure 4. Model validation and temperature factor distribution of atomic models
a–c, Fourier shell correlation (FSC) curves calculated between the refined atomic model and the half map used in refinement (FSCwork) are shown in blue, those calculated between the refined atomic model and the second half map not used for refinement (FSCtest) in red. Vertical lines mark the regular FSC 0.143 cutoff and the resolution target used in refinement as shown. Close agreement between FSCwork and FSCtest and the absence of a sharp drop beyond the refinement target resolution indicate that no overfitting took place. The respective FSC between the refined atomic model and the map obtained from 3D reconstruction using the entire dataset (FSCref) is also shown (black). d–e, Atomic B-factor distributions mapped on ribbon representations of elongating and apo Pol III. The overall distribution and relative differences between core and peripheral subunits for the different models correlate well with the distribution of local resolution (Extended Data Fig. 1).
Extended Data Figure 5
Extended Data Figure 5. Pol III-specific features of subunits C160 and C128 and comparison to the homologous Pol II and Pol I subunits
a, Top (left) and front (right) view of Pol III, with subunits C160 and C128 displayed in ribbon representation and the other subunits in surface representation (grey). Colored stretches highlight characteristic features denoted in b. b, Bar diagram shows the domain organization of Pol III C160. Arrows and corresponding numbers below the bar diagram indicate insertions and deletions of five or more residues in Pol III relative to Pol II subunit Rpb1 as indicated by structure-based alignment. Colored regions are also shown in Pol III subunit C160 (lower panel, left) and in a. Lower panel middle and right show Pol II Rpb1 and Pol I A190 subunits, respectively. c, Same as in b for Pol III subunit C128. Insertions and deletions compared to Pol II subunit Rpb2 are displayed in the box diagram.
Extended Data Figure 6
Extended Data Figure 6. Open and closed clamp conformation in Pol III compared to other RNA polymerases
a, Top view of aligned elongating Pol III and apo Pol III (closed clamp - left panel; open clamp – middle panel) and both ’closed clamp‘ and ’open clamp‘ apo Pol III conformations (right panel). RMSD values (core-heterodimer:all) for elongating Pol III – apo Pol III (closed clamp) (0.43 Å3490 CA:0.43 Å4813 CA), elongating Pol III – apo Pol III (open clamp) (0.71 Å3496 CA:2.73 Å4795 CA) and both apo Pol III open and closed clamp (0.71 Å3540 CA:2.71 Å4829 CA) demonstrate the similarity between ’closed clamp‘ apo Pol III and elongating Pol III conformations. b, Schematic representation of Pol III in top view showing the conformational changes of clamp head, heterotrimer and stalk. The closed clamp conformation (elongating Pol III and ’closed clamp‘ apo Pol III) is displayed in red, the open clamp conformation (‘open clamp‘ apo Pol III) in green. The DNA/RNA duplex is shown in blue, the core and heterodimer in grey. c, Front view on open and closed clamp conformations in other RNA polymerases. The closed clamp state (green) and open clamp state (red) is indicated for archaeal polymerase (left panel, PDB 4ayb and 4qiw), for Pol II (middle panel, PDB 1wcm and 1twf) and for Pol III (right panel). Green and red angles describe the cleft opening in the closed and open clamp conformations. Black arrows and corresponding values indicate the relative distance of the subunits between the two conformations. d, Front view of apo Pol III closed cleft (left panel), apo Pol III closed cleft vs apo Pol II (middle panel, Pol II (PDB 1wcm) in red) and apo Pol III closed cleft vs apo Pol I (right panel, Pol I (PDB 4c3i) in blue). The cleft opening is indicated by a dashed line and the Cα-Cα distance across the cleft (black for Pol III, red for Pol II and blue for Pol I). However, some of the observed differences in cleft width between Pol I, Pol II and Pol III might also reflect differences between conditions of cryo-EM and crystal structures as well as different packing contacts in the crystals.
Extended Data Figure 7
Extended Data Figure 7. Pol III-specific subunits C82, C31 and C11
a, Left panel: Overall surface representation of Pol III with the C82/C34/C31 heterotrimer in ribbon representation. Right panels: Two enlarged and orthogonal views of the region marked with a dotted black square. In subunit C82 WH4 inserts in the DNA binding cleft passing through a canyon in the clamp head. WH2 and WH3 extensions reach over the clamp head and are positioned in close proximity to downstream DNA. b, Ribbon model of Pol III fitted into the EM density of the ‘open clamp’ apo Pol III filtered at 6 Å resolution. For C31, additional density is visible in the cavity between the stalk and the heterotrimer, as shown in the top right panel. The described densities are also present in the ‘closed clamp‘ apo Pol III and the elongating Pol III reconstructions. No attempts were made to fit atomic models into these densities. c, EM density of the C11 TFIIS-like domain at 6 Å resolution as observed in the ‘open clamp’ apo Pol III reconstruction. The left panel shows a side view of Pol III, the middle and right panels show close-ups at two different density thresholds.
Extended Data Figure 8
Extended Data Figure 8. C53/C37 heterodimer and stalk subunits C17/C25
a, Visualization of the photo-crosslinks between C53/C37 heterodimer and subunit C128. Pol III is shown in surface, C53/C37 and C11 in ribbon representation. In addition, the C128 lobe is shown in cartoon representation (small inset). Purple spheres on the lobe indicate residues that photo-crosslink to C37, beige spheres on C37 indicate residues that photo-crosslink to C128. The dashed line marks the tentative path of the non-template DNA strand. The experimental photo-crosslinks fit well to the cryo-EM structure. The C37 loop is disordered between Glu196 and Asn225, although photo-crosslinks indicate that this region is in close proximity to the lobe and the non-template DNA strand. b, Bottom view of Pol III in surface representation, with C53/C37 and C11 shown in ribbon representation. The black dotted square indicates the enlarged area in the center of the image (small inset). The red density (shown at 4.5 Å) was not of sufficient quality to build an atomic model. However, photo-crosslinks from C37 and C128 to C53 (blue spheres on C37 ribbon and C128 surface mark crosslink positions) indicate that C53 N-terminal residues are located in this region. c, Stalk anchoring with C160 extensions. Top view (left panel) and bottom view (right panel) of the stalk subunits C17 (magenta), C25 (blue) and the C160 extensions (grey). EM density corresponding to the C160 N- and C-terminal extensions is shown in tungsten blue. Individual entities and subunits are labeled.
Figure 1
Figure 1. Cryo-EM structure of RNA polymerase III
a, Top and front view of Pol III, individual elements and domains are labeled. Dotted lines indicate regions that are not included in the model. The color code is presented in the corresponding boxes. b, Representative densities of the Pol III core with the fitted model demonstrate the high detail visible in the final cryo-EM structure. c, RNA extension assay demonstrates RNA elongation and cleavage activity of Pol III. The transcription bubble used for the activity assays and for the cryo-EM structure determination is depicted at the right (see also Methods). Lane 1: annealed transcription bubble with 32P labeled RNA (18mer). Lane 2: with NTP mix. Lane 3: with Pol III but without NTPs showing the intrinsic RNA cleavage activity of Pol III, cleavage products are denoted by a black asterisk. Lanes 4 and 5: with Pol III and NTPs excluding ATP (Lane 4) or CTP (Lane 5) showing nucleotide-specificity and elongation arrest at +2 (no ATP) or +7 (no CTP) denoted by red asterisks. Lane 6: with Pol III and NTPs, the +15 run-off shows full-length extension. d, Surface view of the elongating Pol III structure (this study) compared to Pol I (PDB 4c3i) and Pol II (PDB 1wcm). Homologous subunits in Pol I and Pol II are colored based on Pol III and as indicated in a.
Figure 2
Figure 2. Transcription of Pol III and association with DNA/RNA duplex
a, The left panel shows an elongating Pol III ribbon model with the segmented density of the transcription bubble displayed at 4.5 Å for better visibility. DNA and RNA densities are shown in blue and red, respectively. The transcription bubble is shown in stick representation. The downstream DNA duplex is embedded in the cleft, an eight basepair DNA/RNA hybrid was built based on the density. The two right panels show close-ups at two orthogonal views. b, The downstream DNA duplex is tightly bound between the jaw (grey), the clamp head (grey), subunit ABC27 (pink) and two C82 WH domains (WH2 - green and WH3 - blue). c, Cross-section of the elongating Pol III density at 3.9 Å with colored density corresponding to the transcription bubble. The density for the downstream DNA duplex exceeds even beyond bp +15 in the map, although it is much weaker compared to DNA density in the cleft, thus likely corresponding to an unstably stacked second DNA duplex. d, Close-up view of the active site of Pol III (left) and Pol II (right, PDB 1y1w). An extended rudder that points towards a stretch of the protrusion (residues 390-400) and a buried fork loop 1 suggest that the DNA/RNA hybrid in the Pol III core is less tightly bound compared to Pol II (right panel), where fork loop 1 protrudes into the core and together with the rudder and the wall forms a barrier. Similar as in Pol II, the trigger loop is unstructured in Pol III.
Figure 3
Figure 3. Architecture of the Pol III-specific heterotrimer
The panel shows the C82/C34/C31 heterotrimer as ribbon representation in top (left) and bottom (right) view. Schematic representations of C82 (left), C34 (middle) and C31 (right) depict domain boundaries. Structured and disordered regions are marked with solid and dotted lines, respectively.
Figure 4
Figure 4. Architecture and Pol III-specific function of the C53/C37 heterodimer and C11
a, Model of the Pol III C53/C37 heterodimer shown in ribbon representation bound to the Pol III core (left), Pol II homologue TFIIFα/β bound to the Pol II core (center, PDB 4v1n) and Pol I homologue A49/A34.5 bound to the Pol I core (right, PDB 4c3i). The red asterisk (left panel) marks the position of the five residues that upon deletion lead to a terminator read-through phenotype. Schematic representations of C53 and C37 show the domain boundaries of the dimerization domain (DD) and additional elements. Dotted lines indicate unstructured regions. b, Conformation of subunit C11 in Pol III (left), subunit Rpb9 in Pol II (middle), and subunit A12.2 in Pol I. Subunits C11, Rpb9 and A12.2 are depicted with yellow surface rendering; C53/C37, TFIIFα/β and A49/A34.5 are depicted in ribbon representation, all other subunits are colored in grey. Arrows indicate the potential movement of the C11 C-terminal TFIIS domain, the red dotted circle indicates the linker that connects the C11 N- and C-terminal domains.
Figure 5
Figure 5. Conformational changes in apo Pol III
‘Closed clamp’ (left) and ‘open clamp’ (right) conformations of apo Pol III. The C82/C34/C31 heterotrimer, the stalk and the clamp are shown in ribbon representation, the core in surface representation. Arrows in the right panel and corresponding values indicate movements of the stalk, the heterotrimer and the clamp head relative to the closed clamp state.

Comment in

References

    1. Dieci G, Fiorino G, Castelnuovo M, Teichmann M, Pagano A. The expanding RNA polymerase III transcriptome. Trends Genet. 2007;23:614–622. - PubMed
    1. White RJ. RNA polymerases I and III, non-coding RNAs and cancer. Trends Genet. 2008;24:622–629. - PubMed
    1. Vannini A, Cramer P. Conservation between the RNA polymerase I, II, and III transcription initiation machineries. Mol Cell. 2012;45:439–446. - PubMed
    1. Arimbasseri AG, Maraia RJ. Mechanism of Transcription Termination by RNA Polymerase III Utilizes a Non-template Strand Sequence-Specific Signal Element. Mol Cell. 2015 - PMC - PubMed
    1. Chedin S, Riva M, Schultz P, Sentenac A, Carles C. The RNA cleavage activity of RNA polymerase III is mediated by an essential TFIIS-like subunit and is important for transcription termination. Genes Dev. 1998;12:3857–3871. - PMC - PubMed

Publication types

MeSH terms

Substances