

A Method to Estimate the Size and Characteristics of HIV-positive Populations Using an Individual-based Stochastic Simulation Model
- PMID: 26605814
- PMCID: PMC4733816
- DOI: 10.1097/EDE.0000000000000423
A Method to Estimate the Size and Characteristics of HIV-positive Populations Using an Individual-based Stochastic Simulation Model
Erratum in
-
A Method to Estimate the Size and Characteristics of HIV-positive Populations Using an Individual-based Stochastic Simulation Model: Erratum.Epidemiology. 2016 May;27(3):e24. doi: 10.1097/EDE.0000000000000474. Epidemiology. 2016. PMID: 27043876 Free PMC article. No abstract available.
Abstract
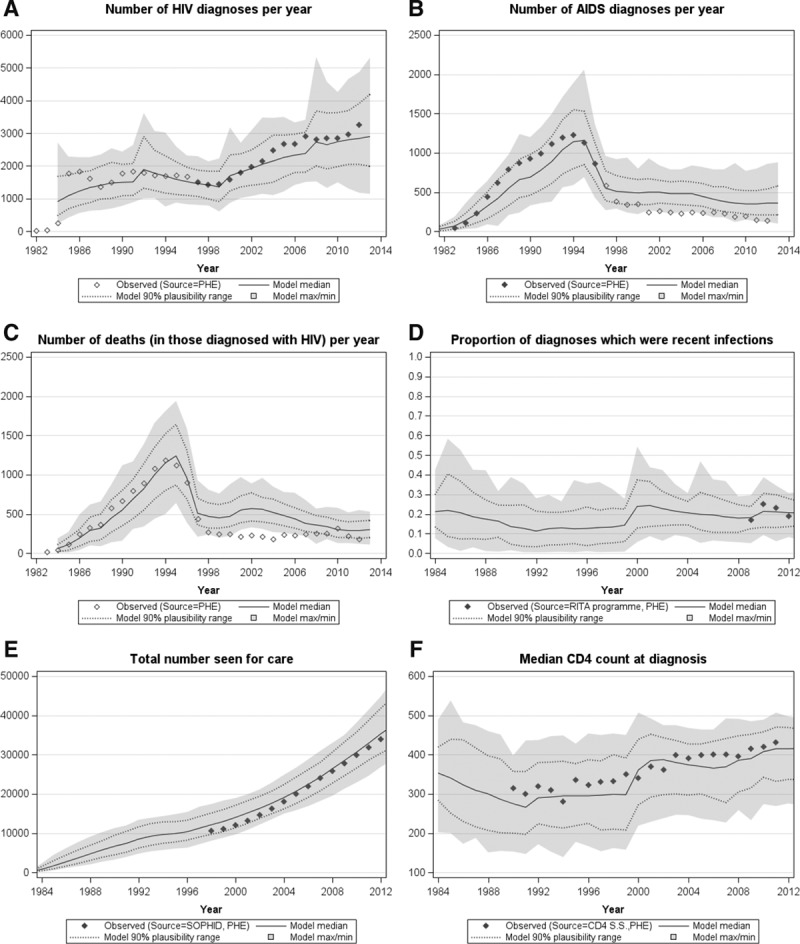
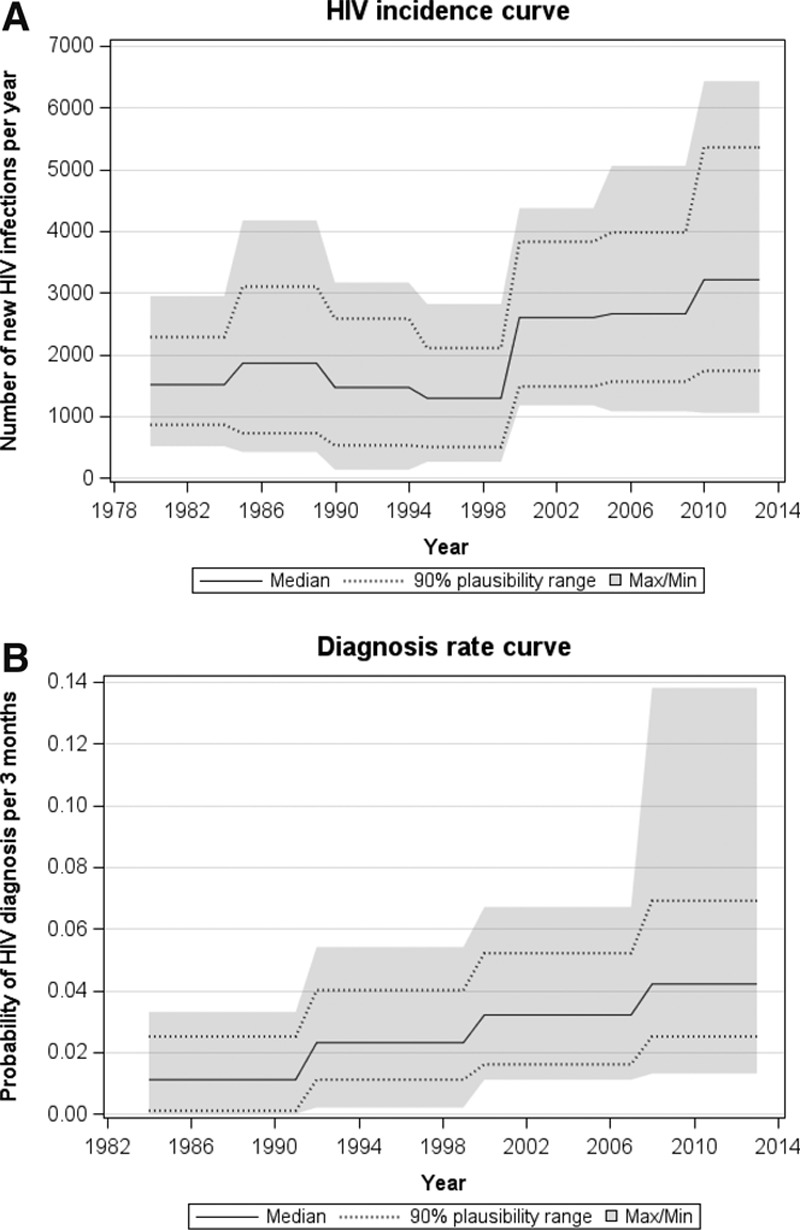
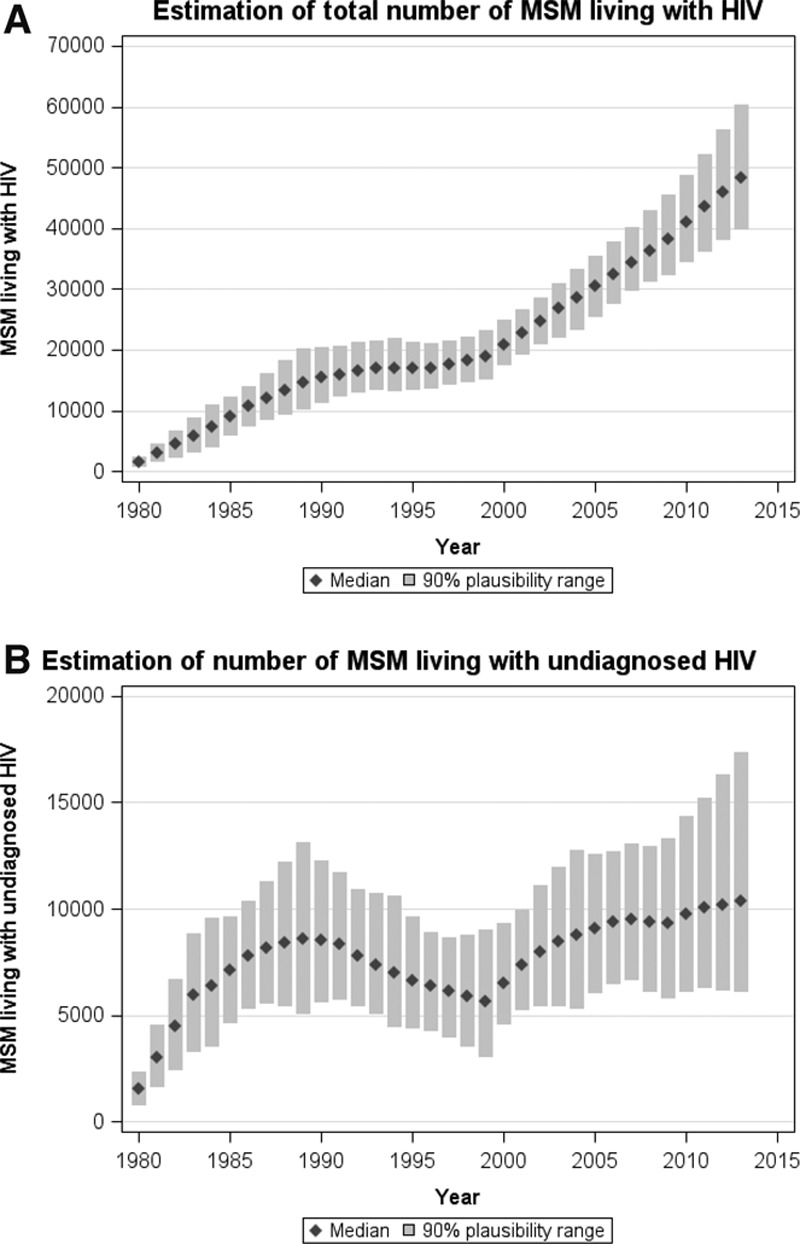
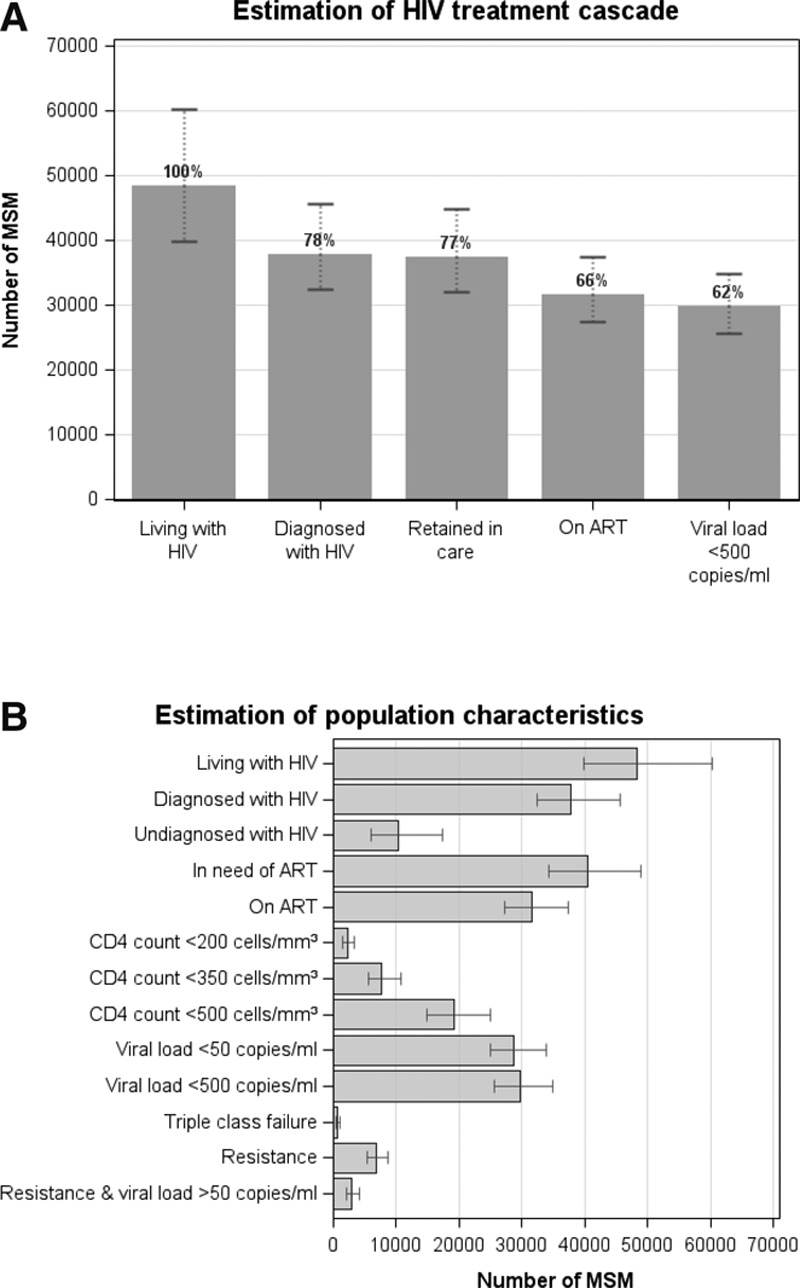
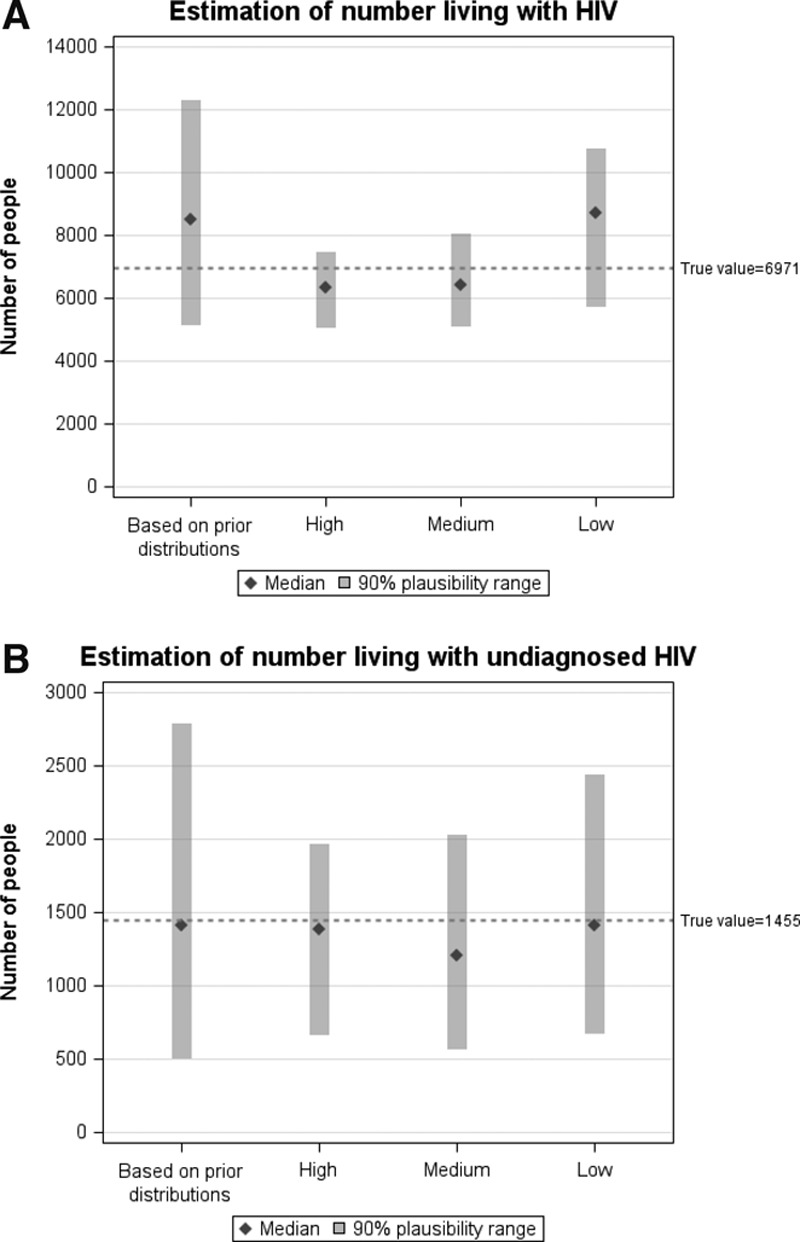
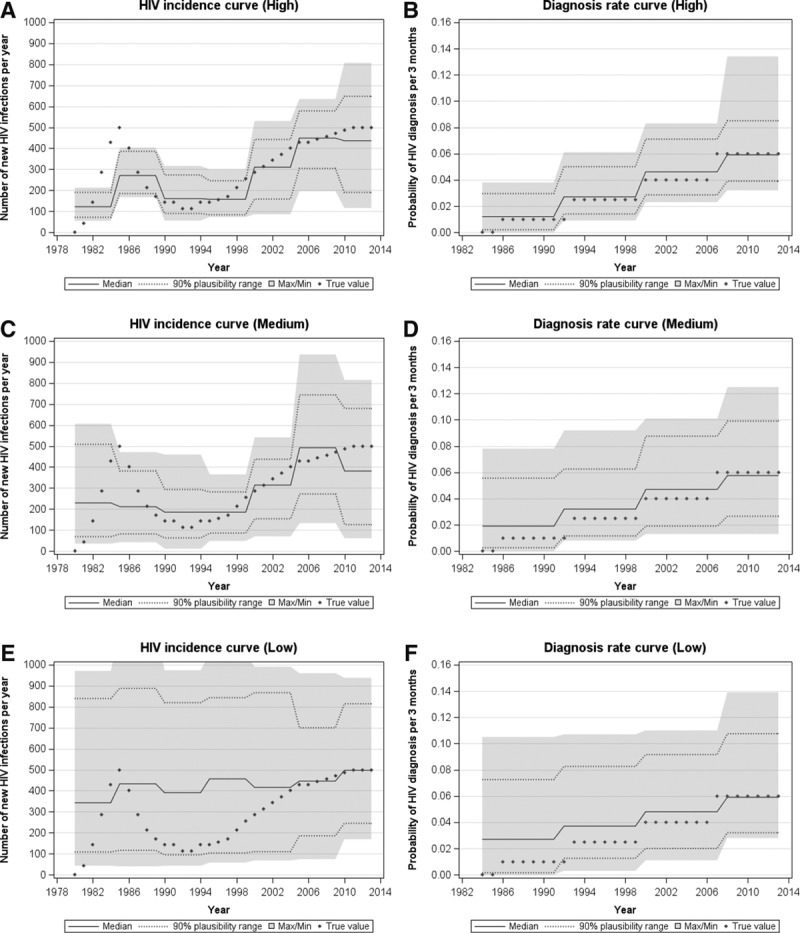
It is important not only to collect epidemiologic data on HIV but to also fully utilize such information to understand the epidemic over time and to help inform and monitor the impact of policies and interventions. We describe and apply a novel method to estimate the size and characteristics of HIV-positive populations. The method was applied to data on men who have sex with men living in the UK and to a pseudo dataset to assess performance for different data availability. The individual-based simulation model was calibrated using an approximate Bayesian computation-based approach. In 2013, 48,310 (90% plausibility range: 39,900-45,560) men who have sex with men were estimated to be living with HIV in the UK, of whom 10,400 (6,160-17,350) were undiagnosed. There were an estimated 3,210 (1,730-5,350) infections per year on average between 2010 and 2013. Sixty-two percent of the total HIV-positive population are thought to have viral load <500 copies/ml. In the pseudo-epidemic example, HIV estimates have narrower plausibility ranges and are closer to the true number, the greater the data availability to calibrate the model. We demonstrate that our method can be applied to settings with less data, however plausibility ranges for estimates will be wider to reflect greater uncertainty of the data used to fit the model.
Conflict of interest statement
The research leading to these results has received funding from the European Union Seventh Framework Programme (FP7/2007–2013) under EuroCoord Grant Agreement No 260694. OR is supported by the Wellcome Trust (fellowship WR092311MF).
The authors report no conflicts of interest.
Figures
References
-
- UNAIDS. Global report: UNAIDS report on the global AIDS epidemic 2013. Joint United Nations Programme on HIV/AIDS (UNAIDS) 2013.
-
- Donoghoe M. The HIV cascade of care in Georgia: implications for countries in Eastern Europe and Central Asia (EECA). HIV Med. 2015;16:1–2. - PubMed
-
- Working Group on Estimation of HIV Prevalence in Europe. HIV in hiding: methods and data requirements for the estimation of the number of people living with undiagnosed HIV AIDS. 2011;25:1017–1023. - PubMed
-
- Brookmeyer R. Measuring the HIV/AIDS epidemic: approaches and challenges. Epidemiol Rev. 2010;32:26–37. - PubMed
