. 2015 Nov 25;10(11):e0143753.
doi: 10.1371/journal.pone.0143753. eCollection 2015.

Spatio-Temporal Regulation of Rac1 Mobility by Actin Islands

Affiliations

Spatio-Temporal Regulation of Rac1 Mobility by Actin Islands

Vinal V Lakhani et al. PLoS One. .

Abstract

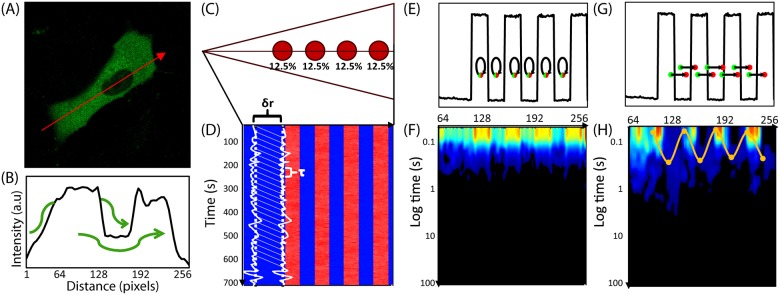
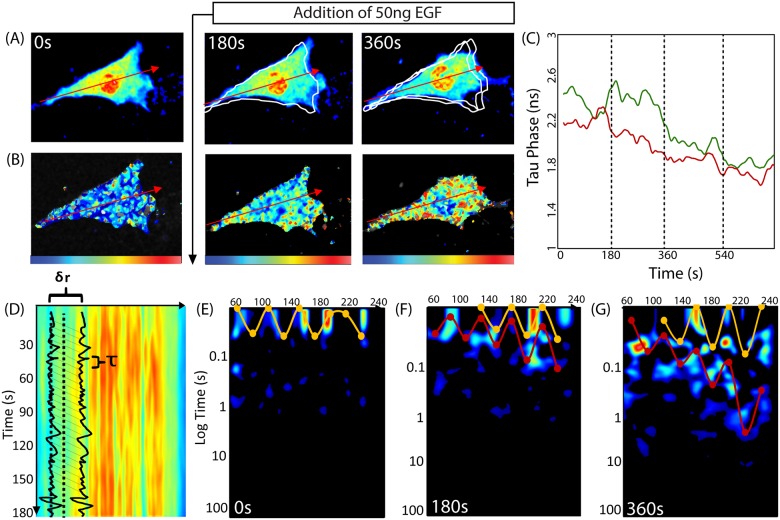
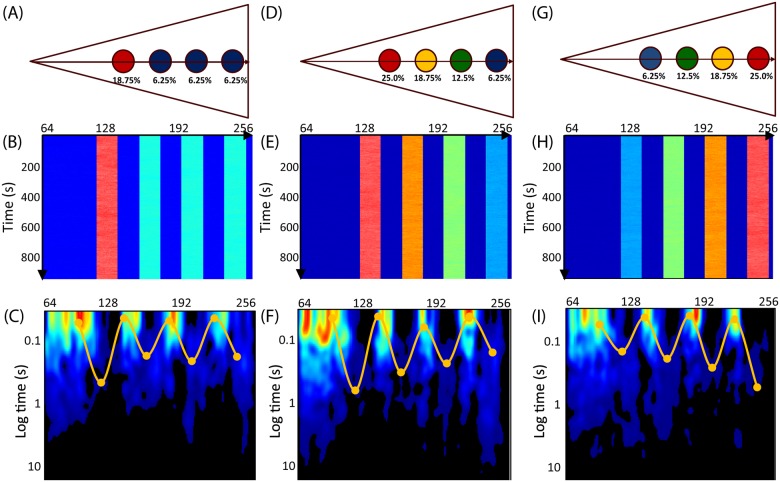
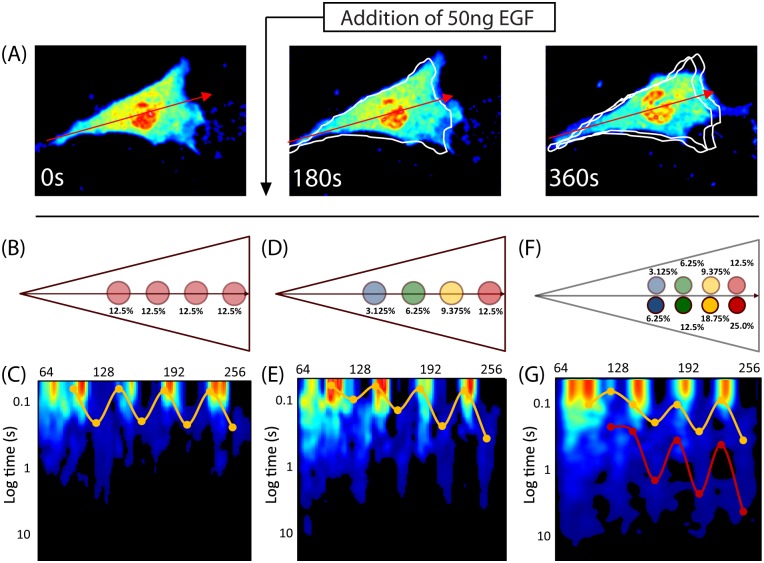
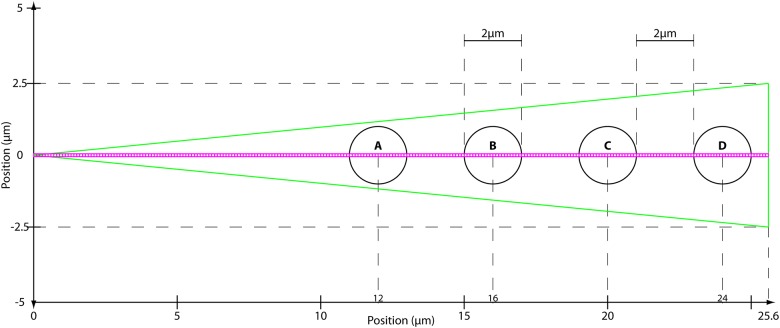
Rho GTPases play important roles in many aspects of cell migration, including polarity establishment and organizing actin cytoskeleton. In particular, the Rho GTPase Rac1 has been associated with the generation of protrusions at leading edge of migrating cells. Previously we showed the mobility of Rac1 molecules is not uniform throughout a migrating cell (Hinde E et. al. PNAS 2013). Specifically, the closer a Rac1 molecule is to the leading edge, the slower the molecule diffuses. Because actin-bound Rac1 diffuses slower than unbound Rac1, we hypothesized that regions of high actin concentration, called "actin islands", act as diffusive traps and are responsible for the non-uniform diffusion observed in vivo. Here, in silico model simulations demonstrate that equally spaced actin islands can regulate the time scale for Rac1 diffusion in a manner consistent with data from live-cell imaging experiments. Additionally, we find this mechanism is robust; different patterns of Rac1 mobility can be achieved by changing the actin islands' positions or their affinity for Rac1.


Conflict of interest statement

Competing Interests: The authors have declared that no competing interests exist.

Figures

Fig 1
Fig 1. Pair correlation analysis of a fluorescent protein’s diffusive route reveals how the cell’s architecture directs intracellular traffic.
(A) Intensity image of cell expressing 5-EGFP. Fluorescence data along the arrow is summarized in the next panel. (B) Intensity profile of 5-EGFP across axis of cell shows 5-EGFP exclusion from the nucleus and therefore an obstacle to 5-EGFP free diffusion. Green arrows demonstrate the molecules must diffuse around instead of through the obstacle. (C) Model for the simulation of Rac1 diffusion in a triangular shaped cell (25.6μm by 5μm) with four, circular traps (2μm wide). Each trap captures, on average, 12.5% of the total Rac1 population. Line scans are taken along the center axis of the cell, as shown by the horizontal line. Each pixel is measured in succession, and one line scan is completed when all 256 pixels have been measured. (D) Many (47000) line scans are combined into an intensity carpet. For this simulation, the intensity carpet shows accumulation of Rac1 colocalized with the four traps. A cartoon of two intensity profiles (intensity vs time) in white is overlaid on the intensity carpet. (E) A representative line scan (intensity vs pixel). The arrows indicate which two pixels are being pair-correlated, from green to red, for the pCF analysis in the next panel. In this case, each pixel is pair-correlated with itself, which is equivalent to an autocorrelation calculation. (F) The pCF(0) carpet reveals that pixels within the traps have higher autocorrelation values for short delay times (τ ≈ 0s) than pixels outside the traps. These values indicate the traps have a higher concentration of Rac1 than elsewhere in the cell. (G) The same representative line scan (intensity vs pixel) as in (E). Here the arrows indicate each pixel (green dot) is pair-correlated with a pixel (red dot) 0.5μm to the right (δr = 5 pixels). (H) The pCF(5) carpet reveals diffusion in and around the traps is slower than elsewhere in the cell. We average the data from every 20 pixels (columns) and smooth this average profile using a Gaussian filter; lastly, we extract the peak time for every 20 columns. We plot a point at each of these peak times. Hence, the yellow highlighted data displays the average time Rac1 takes to diffuse 0.5μm to the right. It takes about 0.3s to diffuse 0.5μm inside the islands but less than 0.1s to diffuse the same distance elsewhere in the cell.
Fig 2
Fig 2. Pair correlation analysis of a Rac1 FRET biosensor reveals Rac1 activity to be spatiotemporally regulated by a dynamic gradient of protein mobility.
(A) Intensity image of a NIH3T3 cell expressing the Rac1 dual chain FRET biosensor in the donor channel before and after stimulation with epidermal growth factor (EGF). The white traces outline the cell’s position(s) from the previous panel(s). (B) Same cell as in (A) pseudo-colored according to donor lifetime. The blue to red color range corresponds to a change in lifetime from 2 to 3ns and therefore low to high Rac1 activity. The tau phase (in ns) is derived from phasor analysis of the fluorescence decay, as in [3]. Shorter tau-phase times correspond to higher FRET activity. (C) Average lifetime analysis of the first 10 pixels (back of the cell, green time series) and the last 10 pixels (front of the cell, red time series). This comparison reveals that after EGF stimulation Rac1 is activated earlier at the front than the back of the cell. (D) The intensity carpet that is derived from line scans acquired across the axis of the cell in (A). (E) Pair correlation analysis of the intensity carpet acquired before EGF stimulation. The highlighted data shows Rac1 molecular flow is uniform: it takes about 0.03s to traverse 0.8μm (pCF(8)). (F) Pair correlation analysis of the intensity carpet acquired 180s after EGF stimulation. The highlighted shows Rac1 molecular flow is non-uniform. At the back of the cell, traversing 0.8μm takes about 0.03s; this time becomes gradually longer towards the front of the cell. The second set of highlighted data (yellow curve) is not significantly different from the first (red curve). (G) Pair correlation analysis of data acquired 360s after EGF stimulation. The mobility gradient is steeper (red curve); the delay time ranges from 0.05s at the back to 1.2s at the front. A second gradient emerges (yellow curve); the delay times range from 0.03s to 0.08s.
Fig 3
Fig 3. Simulations with islands of varying binding affinity.
(A) A simulation set-up showing the rear (leftmost) island binds on average 18.75% of all Rac1, and each of the other three bind 6.25% on average. Unbound Rac1 diffuses with D = 10μm2/s. If bound, Rac1 diffuses with D = 1μm2/s. (B) The resulting intensity carpet shows the highest accumulation at the rear island. (C) The pCF carpet (yellow curve) reveals four arc features, which indicate regions of slow molecular flow, across each island. The time needed to flow 0.5μm to the right (pCF(5)) is longer near the island with the highest affinity (0.6s) than the other islands (0.2s). (D) A simulation wherein the islands form a gradient of binding affinities. The affinities range from 37.5–6.25% from the rear to the front of the cell. (E) The resulting intensity carpet shows a gradient of accumulation of Rac1. (F) The pCF carpet reveals a gradient of arc features whose position corresponds to the position of the islands and whose length correlates with the affinity of the islands. The time scale for molecular flow near the islands ranges from 1s, 0.8s, 0.5s and 0.2s (back to front). (G) Simulation of a cell with actin islands forming a gradient of binding affinities. The affinities range from 6.25–37.5% from the back to the front of the cell. (H) The resulting intensity carpet shows a gradient of accumulation of Rac1. (I) The pCF carpet reveals a gradient of arc features whose position corresponds to the position of the islands and whose length correlates with the affinity of the islands. The pair correlation pattern is opposite of the previous simulation (F). The time scale for molecular flow near the islands ranges from 0.2s, 0.5s, 0.8s and 1s (back to front). This gradient is analogous to the gradient calculated for 3min after EGF stimulation (Fig 2F).
Fig 4
Fig 4. Investigating the cellular substructure during three stages of EGF stimulation by comparing pCF carpets.
(A) Three snapshots of FLIM data before, 3 minutes after and 6 minutes after EGF stimulation. We aim to replicate features in the pCF carpets from the in vivo data (Fig 2E–2G) using our in silico simulations. (B—C) Uniform actin islands, as shown in Fig 1C and 1H. (D) Actin islands across the axis of the cell bind Rac1 with different affinities. These affinities range from 3.12% to 12.15% from the back to the front, which is less than the simulation in Fig 3G. This arrangement of islands is similar to what we expect is present in vivo. (E) pCF analysis reveals four arc features of differing lengths, co-localized with the actin islands. Rac1 mobility is slower towards the front of the cell. (F) Modeling two populations of Rac1 by the superposition of two actin island gradients: one with twice the affinity (Fig 3G) as the other (Fig 4D). We combine the intensity carpets of the two simulations and perform pCF analysis. Although the two sets of islands are superimposed, here, we separate them for illustrative purposes. (G) The resulting pCF carpet for a cell with two populations of Rac1. We find two distinct gradients as highlighted by the curves: one for each population. The red curve corresponds to the Rac1 population with the higher actin affinity.
Fig 5
Fig 5. Simulation Geometry.
The cell boundary is shown in green as an isosceles triangle 25.6μm wide and 5μm tall. The actin islands are shown as black circles with 1μm radii. As discussed in the text, unbound Rac1 molecules are free to diffuse throughout the cell and reflect off the cell boundary. Bound Rac1 molecules diffuse slower and are restricted to the inside of the island in which they are bound. We can individually set the KD of each island thereby setting, on average, the percent of the total Rac1 population bound to each island. The 256 magenta boxes represent the (0.1μm)2 bins used to generate the intensity carpet; these bins do not affect the behavior of the molecules.

Similar articles

Cited by

References

    1. Burridge K, Wennerberg K (2004) Rho and Rac Take Center Stage. Cell 116: 167–179. - PubMed
    1. Machacek M, Hodgson L, Welch C, Elliott H, Pertz O, et al. (2009) Coordination of Rho GTPase activities during cell protrusion. Nature 461: 99–103. 10.1038/nature08242 - DOI - PMC - PubMed
    1. Hinde E, Digman MA, Hahn KM, Gratton E (2013) Millisecond spatiotemporal dynamics of FRET biosensors by the pair correlation function and the phasor approach to FLIM. Proc Natl Acad Sci U S A 110: 135–140. 10.1073/pnas.1211882110 - DOI - PMC - PubMed
    1. Katsuki T, Joshi R, Ailani D, Hiromi Y (2011) Compartmentalization within neurites: its mechanisms and implications. Dev Neurobiol 71: 458–473. 10.1002/dneu.20859 - DOI - PubMed
    1. Digman MA, Gratton E (2009) Imaging barriers to diffusion by pair correlation functions. Biophys J 97: 665–673. 10.1016/j.bpj.2009.04.048 - DOI - PMC - PubMed

Publication types