. 2016 Jan:77:186-97.
doi: 10.1016/j.biomaterials.2015.11.018. Epub 2015 Nov 10.

Poly(ethylene glycol) hydrogels with cell cleavable groups for autonomous cell delivery

Affiliations

Poly(ethylene glycol) hydrogels with cell cleavable groups for autonomous cell delivery

Mrityunjoy Kar et al. Biomaterials. 2016 Jan.

Abstract

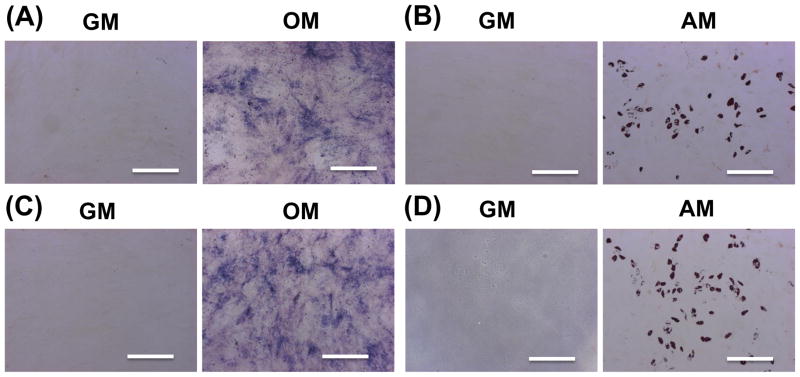
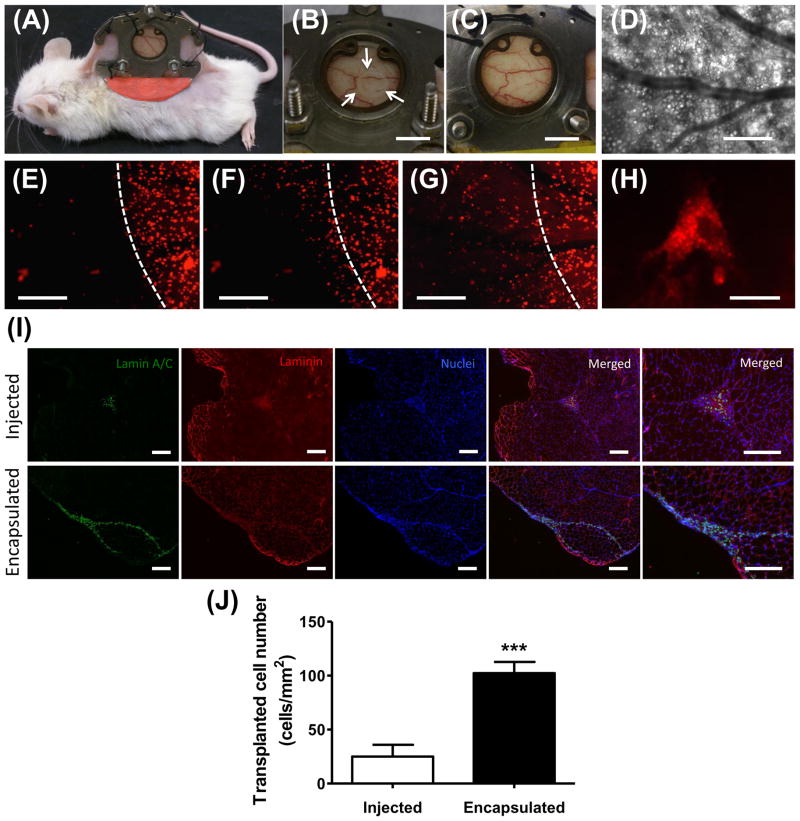
Cell-responsive hydrogels hold tremendous potential as cell delivery devices in regenerative medicine. In this study, we developed a hydrogel-based cell delivery vehicle, in which the encapsulated cell cargo control its own release from the vehicle in a protease-independent manner. Specifically, we have synthesized a modified poly(ethylene glycol) (PEG) hydrogel that undergoes degradation responding to cell-secreted molecules by incorporating disulfide moieties onto the backbone of the hydrogel precursor. Our results show the disulfide-modified PEG hydrogels disintegrate seamlessly into solution in presence of cells without any external stimuli. The rate of hydrogel degradation, which ranges from hours to months, is found to be dependent upon the type of encapsulated cells, cell number, and fraction of disulfide moieties present in the hydrogel backbone. The differentiation potential of human mesenchymal stem cells released from the hydrogels is maintained in vitro. The in vivo analysis of these cell-laden hydrogels, through a dorsal window chamber and intramuscular implantation, demonstrated autonomous release of cells to the host environment. The hydrogel-mediated implantation of cells resulted in higher cell retention within the host tissue when compared to that without a biomaterial support. Biomaterials that function as a shield to protect cell cargos and assist their delivery in response to signals from the encapsulated cells could have a wide utility in cell transplantation and could improve the therapeutic outcomes of cell-based therapies.

Keywords: Cell delivery; Cell-responsive biomaterial degradation; Hydrogel; Stem cells.


Conflict of interest statement

Conflict of interest

Authors declare no conflict of interest.

Figures

Figure 1
Figure 1
Reaction scheme for the synthesis of (A) disulfide-modified poly(ethylene glycol) diacrylate (dPEGDA), (B) poly(ethylene glycol) diaminoethanol diacrylate (PEGDEDA), and (C) poly(ethylene glycol) diacrylate (PEGDA). Refer to Materials and methods section for individual molecules.
Figure 2
Figure 2
1H-NMR spectra of (A) monoacrylate PEG and (B) dPEGDA molecules.
Figure 3
Figure 3
Degradation of disulfide PEG diacrylate (dPEGDA) hydrogels. (A) Schematic representation of the molecular structure of disulfide PEG diacrylate (dPEGDA) oligomers and the hydrogel network before and after their degradation. The green triangles represent the disulfide units and the blue triangles represent the acrylate moieties. The degradation of the hydrogel scaffold occurs at the disulfide cleavage site (green) by either thiol-disulfide interchange or reduction of disulfide in the presence of various reducing agents. (B) Swelling ratio of dPEGDA hydrogels synthesized from precursor concentrations of 10–20-wt %. (C) Degradation of 10-wt% dPEGDA hydrogels in presence of 0.5 mM and 1 mM concentrations of cysteine (Cys) and reduced glutathione (GSH). (D) Degradation of 10-wt% dPEGDA hydrogels in 0.5 mM and 1 mM of dithiothreitol (DTT) and tris-(2-carboxyethyl)phosphine, hydrochloride (TCEP). (E) Degradation of 10-wt% dPEGDA hydrogels in pH 5, 7.4, and 9 buffers.
Figure 4
Figure 4
Cell-mediated degradation of dPEGDA hydrogels. (A) Bright-field images of the release of hMSCs from a 10-wt% cell-laden dPEGDA hydrogel, containing 2 × 10⁵ hMSCs, as a function of time (0 – 48 hours). The inset shows the gross image of the corresponding cell-laden hydrogel. Scale bar: 200 μm. (B) Degradation profile of 10-wt% dPEGDA hydrogels containing different numbers (0 – 4 × 10⁵) of hMSCs. (C) Number of hMSCs released from dPEGDA hydrogels containing varying numbers of encapsulated hMSCs. (D) Degradation profile of 10 and 15-wt% dPEGDA hydrogels encapsulating 2 × 10⁵ hMSCs. (E) Degradation profile of 10-wt% copolymer hydrogels, encapsulated with 2 × 10⁵ hMSCs, containing varying ratios of dPEGDA and PEGDA.
Figure 5
Figure 5
Differentiation of hMSCs released from dPEGDA hydrogels. (A) Alkaline phosphatase staining and (B) oil red O staining of control (unencapsulated hMSCs) after 14 days of osteogenic and adipogenic differentiation, respectively. hMSCs that were encapsulated and released from hydrogels were stained for (C) alkaline phosphatase and (D) oil red O after 14 days of osteogenic and adipogenic differentiation, respectively. Scale bar: 200 μm. GM: growth medium. OM: osteogenic medium. AM: adipogenic medium.
Figure 6
Figure 6
In vivo analysis of cell release from cell-laden dPEGDA hydrogels. (A) Animal implanted with the dorsal window chamber. B) White arrows depict the circular hMSC-laden 10-wt% dPEGDA within the window chamber. (C) Same view of Fig. 5B depicting visual absence of hMSC-laden hydrogel after 4 days of implantation. Scale bar: 5 mm. (D–G) Intravital microscopic images of the same tissue site through the observation window. D) Brightfield image of subcutaneous tissue and vasculature. Imaging of the cell-laden hydrogel after (E) 24 hours, (F) 48 hours, and (G) 72 hours showing the release of the cells from the dPEGDA hydrogels. The cells are labeled with CellTracker Red. White line depicts the initial hydrogel boundary. Scale bar: 400 μm. (H) Released hMSCs that attached and spread on the subcutaneous tissue after 72 hours. Scale bar: 50 μm. (I) Immunofluorescent staining and (J) quantification of transplanted cells (human lamin A/C) in skeletal muscle of NOD/SCID mice 5 days post implantation. Scale bar: 200 μm. Data are presented as the mean ± SEM (n = 3). Two groups were compared by two-tailed Student’s t-test. Asterisks were assigned to p-values with statistical significance (***, p < 0.001).

References

    1. Ballios BG, Cooke MJ, van der Kooy D, Shoichet MS. A hydrogel-based stem cell delivery system to treat retinal degenerative diseases. Biomaterials. 2010;31:2555–64. - PubMed
    1. Hwang Y, Suk S, Shih YR, Seo T, Du B, Xie Y, et al. WNT3A promotes myogenesis of human embryonic stem cells and enhances in vivo engraftment. Scientific reports. 2014;4:5916. - PMC - PubMed
    1. Passier R, van Laake LW, Mummery CL. Stem-cell-based therapy and lessons from the heart. Nature. 2008;453:322–9. - PubMed
    1. Schäffler A, Büchler C. Concise Review: Adipose Tissue-Derived Stromal Cells—Basic and Clinical Implications for Novel Cell-Based Therapies. STEM CELLS. 2007;25:818–27. - PubMed
    1. Segers VFM, Lee RT. Stem-cell therapy for cardiac disease. Nature. 2008;451:937–42. - PubMed

Publication types

MeSH terms