. 2015 Dec 2;88(5):941-956.
doi: 10.1016/j.neuron.2015.10.046. Epub 2015 Nov 20.

Genetic and Stress-Induced Loss of NG2 Glia Triggers Emergence of Depressive-like Behaviors through Reduced Secretion of FGF2

Affiliations

Genetic and Stress-Induced Loss of NG2 Glia Triggers Emergence of Depressive-like Behaviors through Reduced Secretion of FGF2

Fikri Birey et al. Neuron. .

Erratum in

Abstract

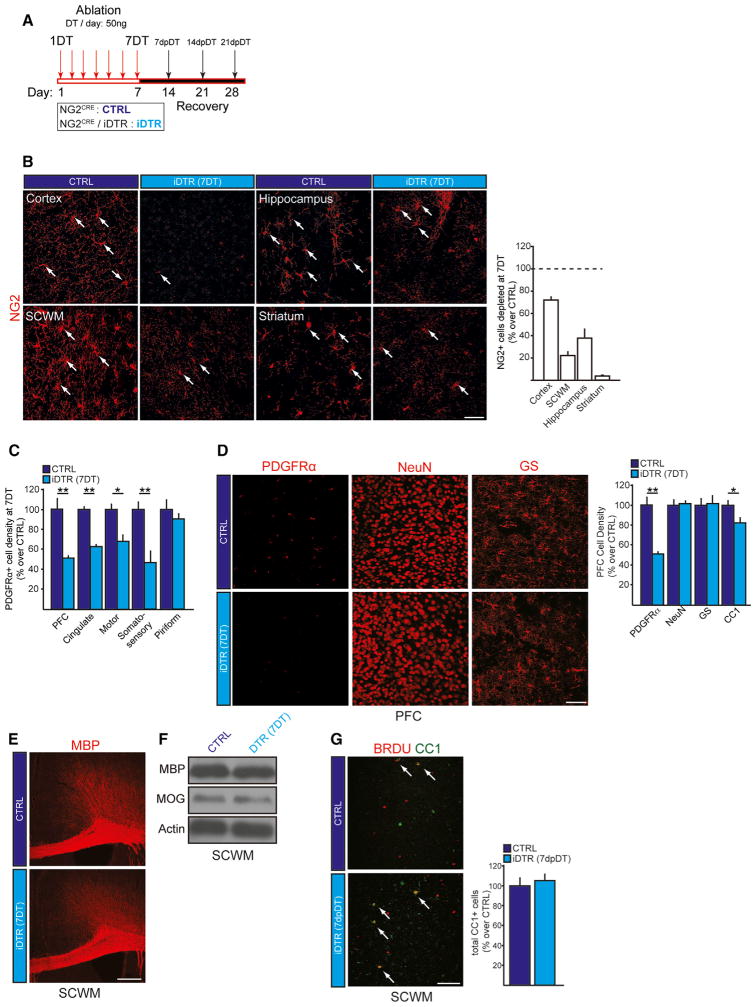
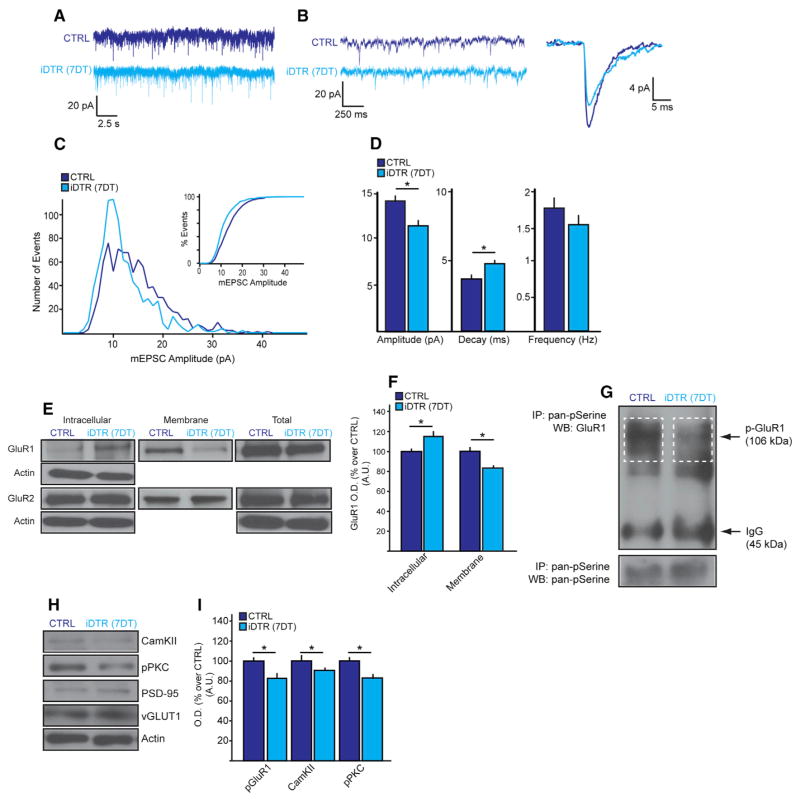
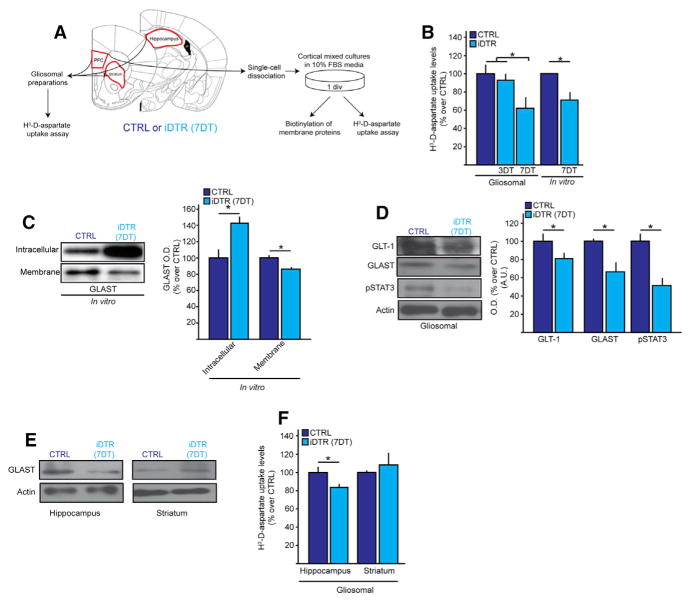
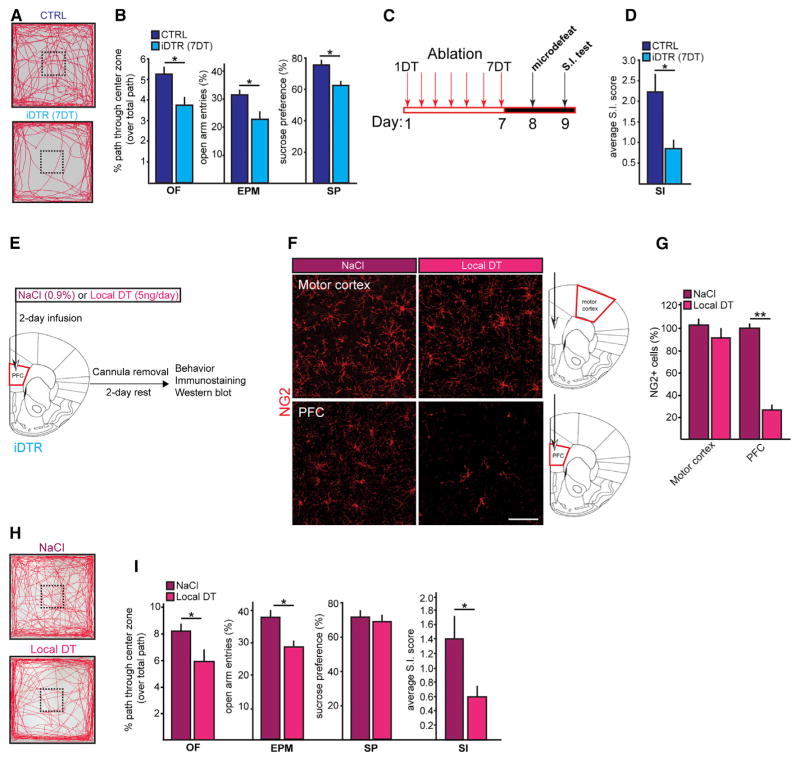
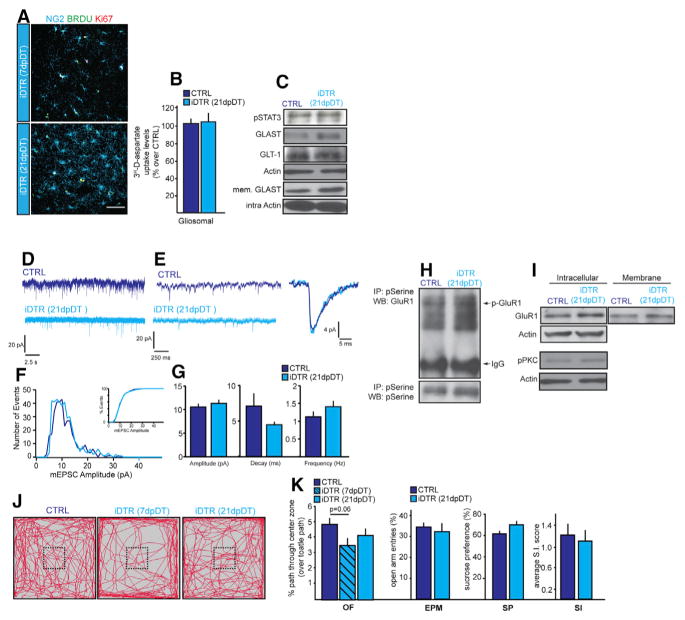
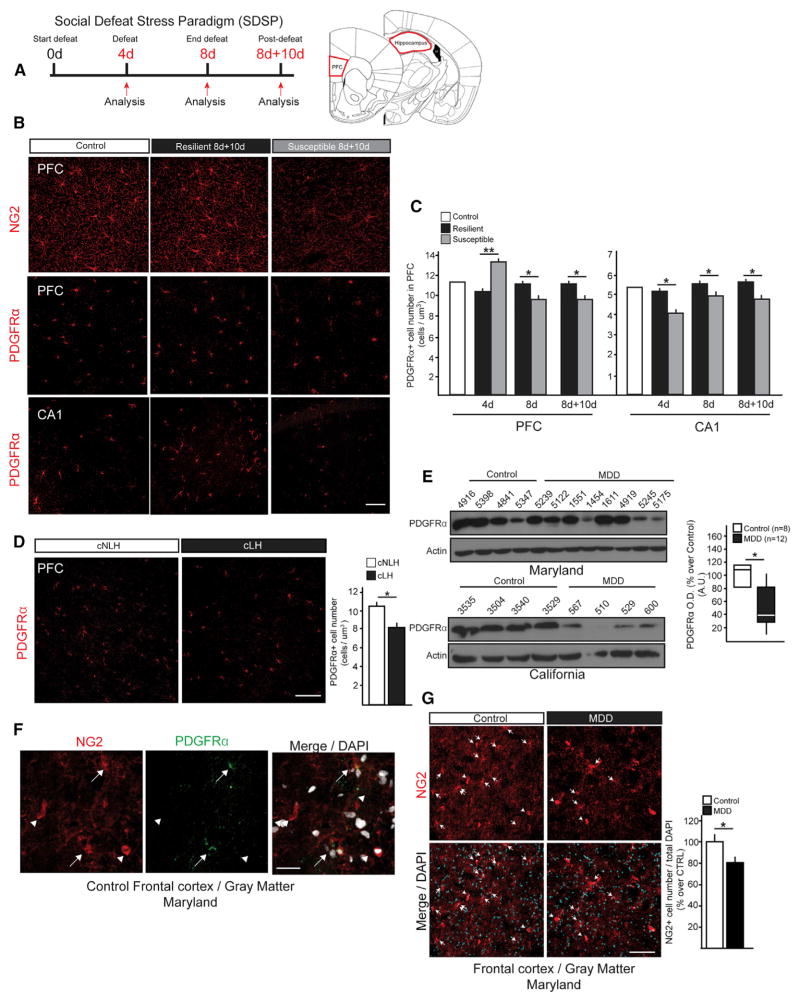
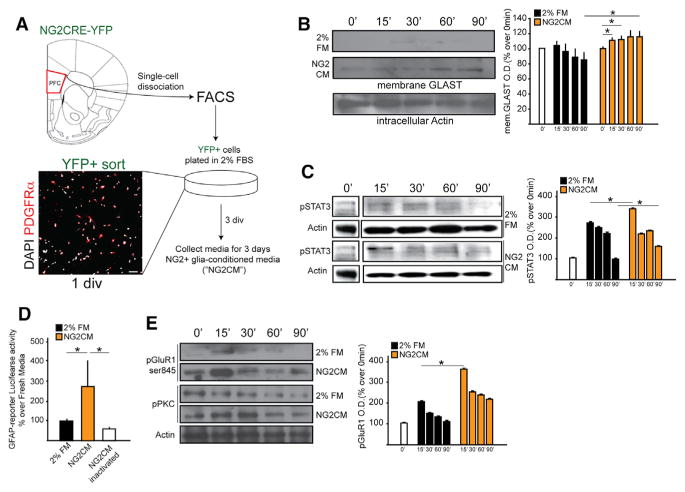
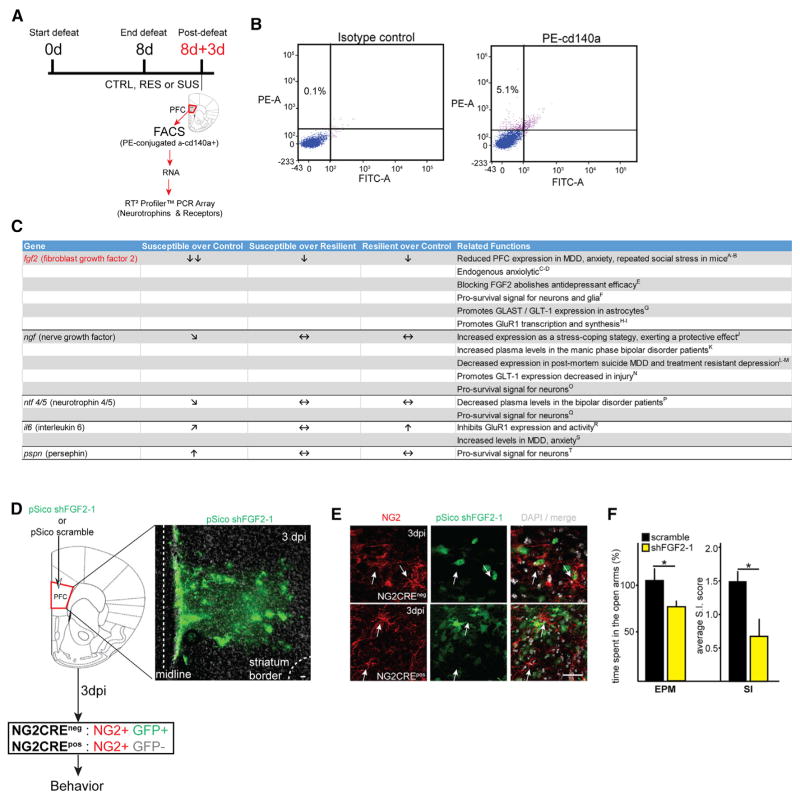
NG2-expressing glia (NG2 glia) are a uniformly distributed and mitotically active pool of cells in the central nervous system (CNS). In addition to serving as progenitors of myelinating oligodendrocytes, NG2 glia might also fulfill physiological roles in CNS homeostasis, although the mechanistic nature of such roles remains unclear. Here, we report that ablation of NG2 glia in the prefrontal cortex (PFC) of the adult brain causes deficits in excitatory glutamatergic neurotransmission and astrocytic extracellular glutamate uptake and induces depressive-like behaviors in mice. We show in parallel that chronic social stress causes NG2 glia density to decrease in areas critical to Major Depressive Disorder (MDD) pathophysiology at the time of symptom emergence in stress-susceptible mice. Finally, we demonstrate that loss of NG2 glial secretion of fibroblast growth factor 2 (FGF2) suffices to induce the same behavioral deficits. Our findings outline a pathway and role for NG2 glia in CNS homeostasis and mood disorders.


Figures

Figure 1
Figure 1. NG2CRE/iDTR, a Model of NG2 Glial Cell Ablation
(A) Paradigm used for NG2 glial cell ablation in the iDTR adult mouse brain using systemic Diphtheria Toxin (DT) administration. DT (50 ng/ul) was injected once daily for 7 days; days post DT (dpDT). (B) Representative images and quantification of depletion efficiencies in different brain regions including cortex, hippocampus, subcortical white matter and striatum. Arrows, NG2+ glial cells. (C) NG2 glial cell numbers in different cortical regions of control and iDTR mice at 7DT. (D) NG2 glia (PDGFRα+), neuron (NeuN+), astrocyte (glutamine synthase; GS+), and mature oligodendrocyte (CC1+) numbers in the PFC of control and iDTR at 7DT. (E) Representative confocal images of MBP immunostaining from control and iDTR mice at 7DT. (F) Protein extracts from the PFC were used to analyze total expression levels of MBP and MOG at 7DT. (G) The number of mature oligodendrocytes is rapidly replenished during the DT paradigms as assessed by the newly formed mature oligodendrocytes (BrdU+CC1+ cells) at 5 days after 7DT (5dpDT). Error bars, mean ± SEM (*p < 0.05, **p < 0.01; t-test) n = 5–7 per group. Scale bars, 40 μm. See also Figures S1–S3.
Figure 2
Figure 2. NG2 Glia Ablation Causes Deficits in the Glutamatergic Synaptic Transmission in the PFC
(A and B) Sample recordings (25 s) of miniature EPSCs (mEPSC) taken from PFC pyramidal neurons (n = 23–5 per group). (A) Sample recordings at higher magnification lasting 2.5 s and (B) individual mEPSC lasting 250 ms. (C) Histogram of mEPSC amplitude. Insert, a percent distribution of mEPSC amplitudes. (D) Average amplitude (left), decay (middle), and frequency (right) mEPSCs. (E and F) Membrane translocation of glutamate receptor 1 (GluR1) and GluR2. (G–I) GluR1 serine phosphorylation (G) and total protein expression levels of CaMKII, pPKC, vGLUT1, and PSD95 (H) quantified in (I). Error bars, mean ± SEM (*p < 0.05; t-test); n = 3–4 per group unless indicated otherwise. See also Figure S4.
Figure 3
Figure 3. NG2 Glia Ablation Leads to Impaired Glutamate Transporter Expression and Glutamate Uptake Deficit in the PFC
(A) Schematics of experimental protocol used for 3H-D-aspartate uptake assays. (B) 3H-D-aspartate uptake assayed in CTRL and iDTR PFC gliosomes and in primary cortical astrocyte cultures at 3DT and 7DT; n = 8–10 per group. (C) Intracellular and cell membrane-bound levels of GLAST from PFC CTRL and iDTR of in primary cortical astrocyte cultures at 7DT. (D) Protein expression levels of glutamate transporter GLAST, GLT-1 and pSTAT3 in the PFCs of CTRL and iDTR mice at 7DT. (E) 3H-D-aspartate uptake assayed in CTRL and iDTR hippocampal and striatal gliosomes at 7DT. (F) Protein levels of GLAST in the hippocampus and striatum at 7DT. Error bars, mean ± SEM (*p < 0.05). n = 4–5 per group unless indicated otherwise.
Figure 4
Figure 4. NG2 Glia Ablation Causes Depressive-like Behaviors in Mice
(A) Open field activity. (B–D) Behavioral analyses at 7DT (n = 12–14 per group; t test; OF, open field test; EPM, elevated plus maze; SP, sucrose preference test; SI, social interaction test). (B) Center entry measures normalized to total distance traveled assessed OF. Percent open arm entry frequencies over all entries assessed by EPM. A total of 1% sucrose water preference assessed by SF. (C) Schematic for subthreshold microdefeat protocol. (D) Average SI scores following microdefeat. (E–G) Paradigm for local NG2 glia ablation in the PFC. Representative images (F) and cell number quantification (G) of NG2 glia, mature oligodendrocytes (GSTPi+ cells), astrocyte (GS+cells), and microglia(Iba+cells)inthe PFC and motor cortexafter NaCl orDT infusionvia cannula intothe PFCof iDTRmice (n = 4 per group;t test). (H) Protein expression levels of astrocytes (GFAP), function-associated molecular markers for astrocytes (GLAST, GLT-1), mature oligodendrocytes (CNPase; myelin MBP), pericytes (PDGFRβ) and microglial cell activation (iNOS) after DT infusion in the PFC using cannula implanted in this brain region. (I) Open field activity after NaCl or DT infusion. (J) Behavioral analyses performed after acute focal NG2 ablation (n = 11–16 per group; t test). Error bars, mean ± SEM (*p < 0.05, **p < 0.01). Scale bar, 40 μm. See also Figure S5.
Figure 5
Figure 5. Repopulation of NG2 Glia Density in the PFC after Their Depletion Is Associated with the Recovery of Molecular, Physiological, and Behavioral Stress-Related Deficiencies
(A) Images and cell quantification of newly generated NG2 glia at 7dpDT and 21dpDT. BrdU (1 mg/mL) was giving in the drinking water after the last DT injection. (B) 3H-D-aspartate uptake in the PFC of control and iDTR at 21dpDT. (C) Protein expression levels of pSTAT3, GLAST, and GLT-1 in the PFC of control and iDTR at 21dpDT. (D) Sample recordings (25 s) of miniature EPSCs from pyramidal neurons in the PFC. (CTRL, n = 10; iDTR, n = 15; t test). (E) Sample recordings at higher magnification lasting 2 s and individual mEPSC. (F) Histogram of mEPSC amplitude. Inset, percent distribution of mEPSC amplitudes. (G) Average amplitude, decay, and frequency. (H and I) Serine phosphorylation (H) and levels of intracellular and membrane-bound GluR1 (I) in the PFC at 21dpDT. (J and K) Behavior analysis at 7dpDT and 21dpDT (n = 16–18 per group; two-way repeated-measures ANOVA (for OF analysis) and t test). (J) Open field activity and percent center entry frequencies over total distance traveled at 7dpDT and 21dpDT. (K) Percent open arm entry frequencies over all entries, 1% sucrose consumption, and average SI scores following microdefeat for behavioral analyses. Error bars, mean ± SEM (*p < 0.05). n = 4–5 per group unless indicated otherwise. Scale bar, 40 μm.
Figure 6
Figure 6. Reduced NG2 Glia Density in Animal Models of Depression and MDD Subjects
(A) Experimental protocol for social defeat stress paradigm (SDSP) and schematic of anatomical brain regions investigated: prefrontal cortex (PFC), and Prelimbic (PrL) and infralimbic (IL) regions of the CA1 region of hippocampus. (B–F) Representative images (B) and cell quantification (C) of PDGFRα+ cells in CA1 and PFC at 4d, 8d, and 8d+10d of susceptible animals (SUS) compared to resilient (RES) mice (n = 5–6 per group; t test). Representative images (D) and cell quantification (E) of proliferation dynamics of NG2 glial cells (NG2+ PCNA+ cells) in the PFC of control, RES, and SUS mice at 4d, 8d, and 8d+10d. (n = 4 per group). (F) Quantification of PDGFRα+ pGSK3β + cells of control, RES, and SUS mice in the PFC at 8d (n = 4 per group). (G) Representative images and cell number of PDGFRα+ cells in PFCs of adult congenitally nonlearned helpless (cNLH) and learned helpless (cLH) rats (n = 4 per group; t test). (H) Protein levels of PDGFRα from PFCs of the control and MDD subjects. Boxplot of PDGFRα expression levels in MDD subjects and age- and sex-matched controls (CTRL n = 8, MDD n = 12; paired t test). (I) Characterization of human NG2 glial cells in the frontal cortex gray matter characterized using PDGFRα immunostaining. Arrows, NG2 glia; Arrowheads, pericytes. (J) Representative images and cell number (percent over total DAPI+ nuclei) of NG2 glia in the PFCs of control, and MDD subjects. Arrows, NG2 glia (*p < 0.05, **p < 0.01). Error bars, mean ± SEM. Scale bars, 40 μm; Scale bars in (F), 20 μm.
Figure 7
Figure 7. NG2 Glia-Secreted Factors Mediate Astrocytic and Neuronal Functions
(A) Schematics of experimental paradigm and representative image of post-FACS cells indicating sort purity (85%–90% of all DAPI cells were PDGFRα+). (B) GLAST cellular localization at different time points of stimulation with 2% fresh medium (FM) or NG2 conditioned media (NG2-CM) in primary cortical astrocytes. (C) Time course of phosphorylation of STAT3 (pSTAT3) in response to 2%FM and NG2CM in primary cortical astrocytes. (D) GFAP-Luciferase reporter assay activity in primary cortical astrocytes in response to 2% FM or NG2CM. (E) Time course of PKC and pGluR1 phosphorylation in response to 2% FM and NG2CM in primary hippocampal neurons. Error bars, mean ± SEM n = 4–5 per group (*p < 0.05; two-way ANOVA).
Figure 8
Figure 8. The Loss of NG2 Glia-Secreted FGF2 Participates in the Emergence of Depressive-like Behaviors
(A) Schematic representation of NG2 glia isolation protocol by FAC-sorting to obtain total RNA and perform PCR array from control, RES, and SUS mice. (B) Representative plots of FACS gates used to isolate NG2 glial cells (PDGFRα+ cells; PE+) for PCR pathway array analysis. (C) Table showing the growth factors and neurotrophins with the highest differential expression among the groups and fold-changes along with reported functions in this context and relevant references. Double downward arrows, significant downregulation, >10-fold change; downward arrow, significant downregulation, <10-fold change; upward arrow, significant upregulation, <10-fold change; sideways downward arrow, downregulation trend; sideways upward arrow, upregulation trend; horizontal arrows, no change (n = 5 per group; see Supplemental Information for references and statistical analysis). (D) Lentiviral shRNA strategy to knock down mouse FGF2 in NG2 glial cells in the PFC of adult mice. Representative confocal images showing infected cells (GFP+ cells) in the PFC at 3 days postinfection (3 dpi). (E) At 3 dpi in the PFC of NG2CREneg mice (top panel, arrows), PDGFRα+ cells infected with shFGF2-1 were GFP+, while in the PFC of NG2CREpos mice PDGFRα+ were GFPneg (bottom panel, arrows). (F) Representative behavioral measures assessed at 3 dpi of mice injected with scramble shRNA or shFGF2-1. Plots shows percentage of time spent in the open arms over total time assessed by EPM (n = 22/group) and average SI score assessed by SI (n = 11/group). dpi, days postinjection. Error bars, mean ± SEM (*p < 0.05; t test). Scale bars, 40 μm. See also Figures S6 and S7.

References

    1. Aguirre A, Gallo V. Reduced EGFR signaling in progenitor cells of the adult subventricular zone attenuates oligodendrogenesis after demyelination. Neuron Glia Biol. 2007;3:209–220. - PMC - PubMed
    1. Aguirre A, Rubio ME, Gallo V. Notch and EGFR pathway interaction regulates neural stem cell number and self-renewal. Nature. 2010;467:323–327. - PMC - PubMed
    1. Almeida RF, Thomazi AP, Godinho GF, Saute JA, Wofchuk ST, Souza DO, Ganzella M. Effects of depressive-like behavior of rats on brain glutamate uptake. Neurochem Res. 2010;35:1164–1171. - PubMed
    1. Alonso G. Prolonged corticosterone treatment of adult rats inhibits the proliferation of oligodendrocyte progenitors present throughout white and gray matter regions of the brain. Glia. 2000;31:219–231. - PubMed
    1. Asano H, Aonuma M, Sanosaka T, Kohyama J, Namihira M, Nakashima K. Astrocyte differentiation of neural precursor cells is enhanced by retinoic acid through a change in epigenetic modification. Stem Cells. 2009;27:2744–2752. - PubMed

Publication types

MeSH terms