. 2015 Dec 15;112(50):15408-13.
doi: 10.1073/pnas.1512832112. Epub 2015 Nov 25.

STING activation of tumor endothelial cells initiates spontaneous and therapeutic antitumor immunity

Affiliations

STING activation of tumor endothelial cells initiates spontaneous and therapeutic antitumor immunity

Olivier Demaria et al. Proc Natl Acad Sci U S A. .

Abstract

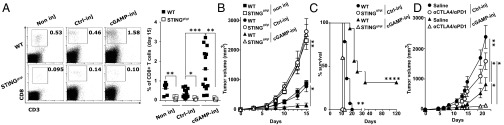
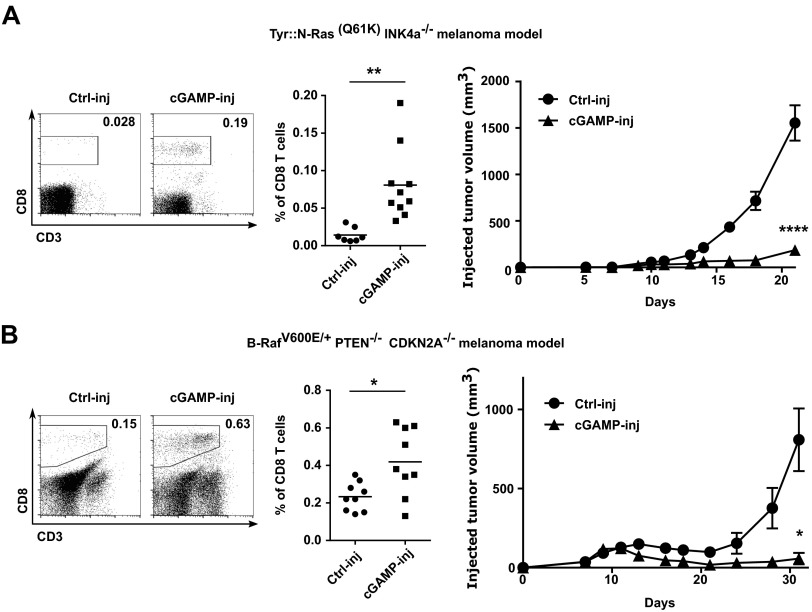
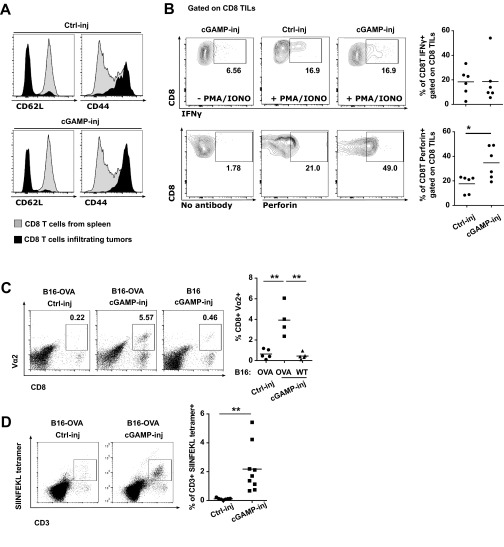
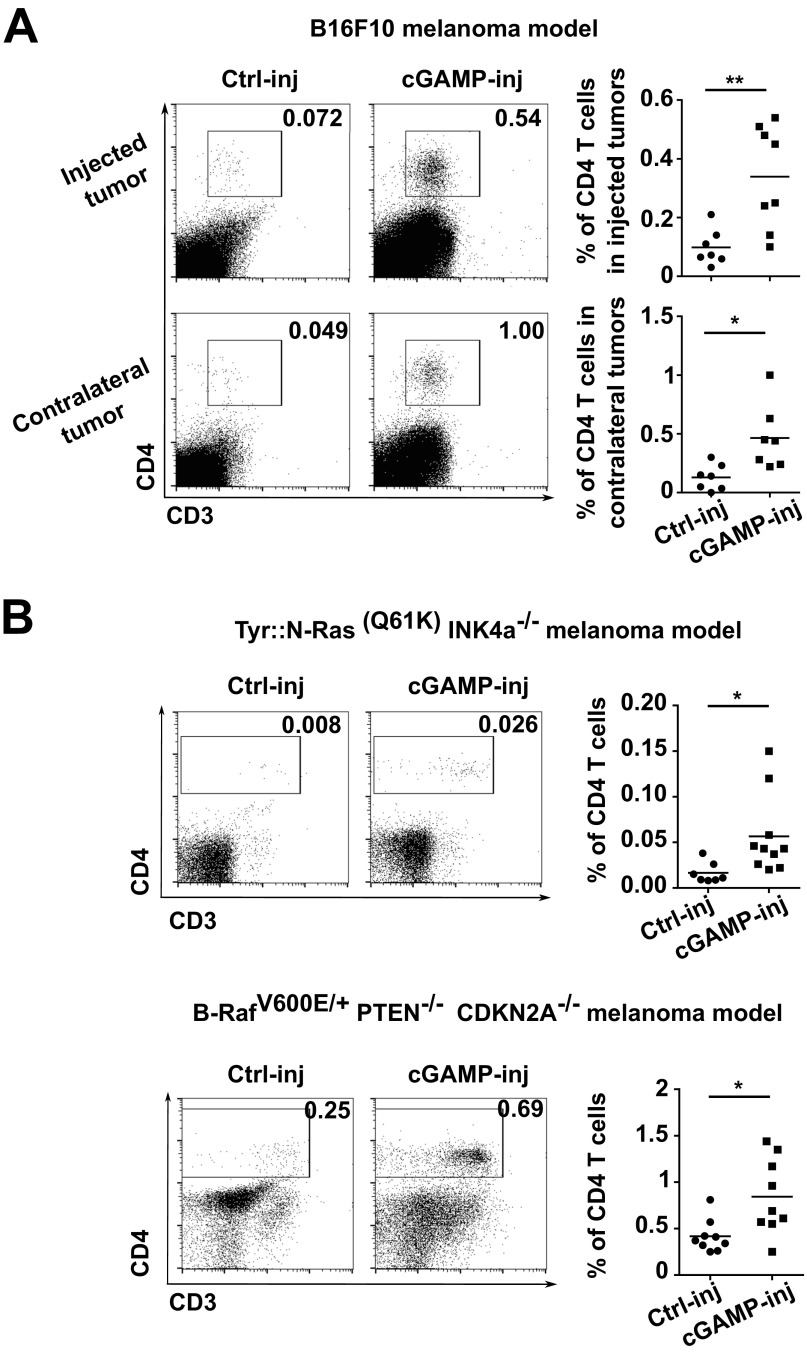
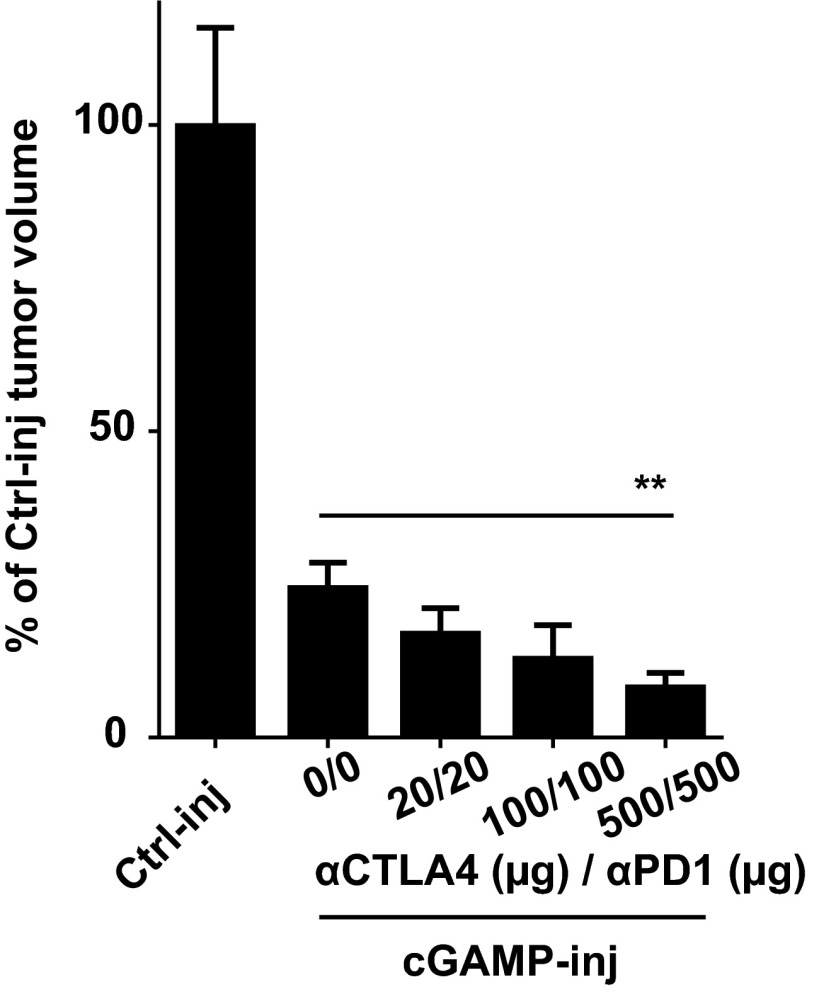
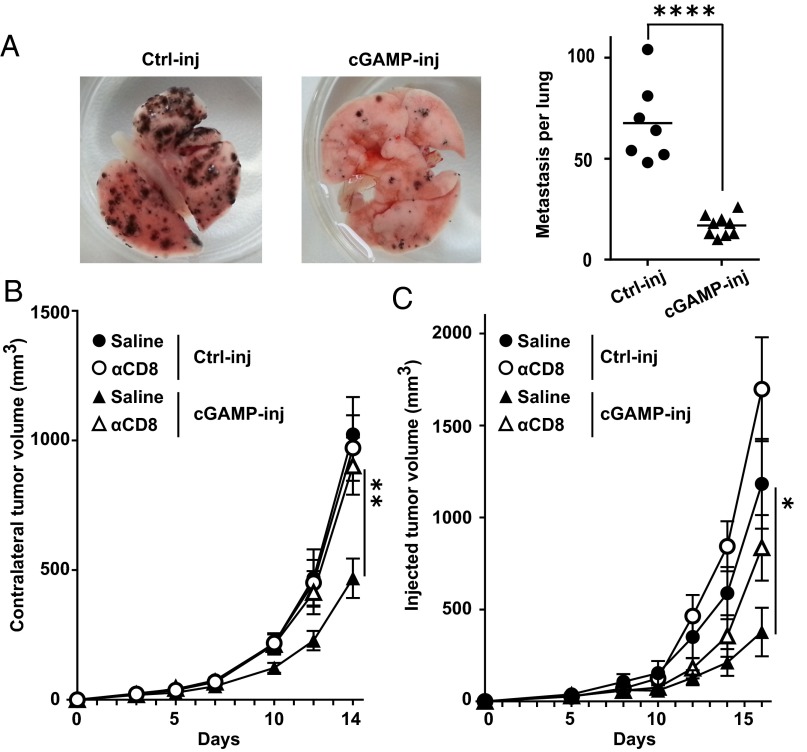
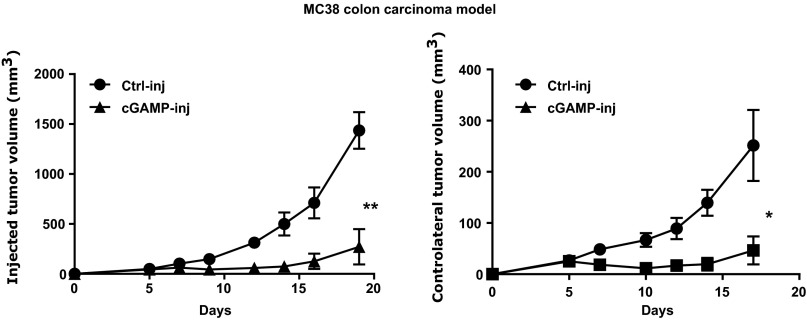
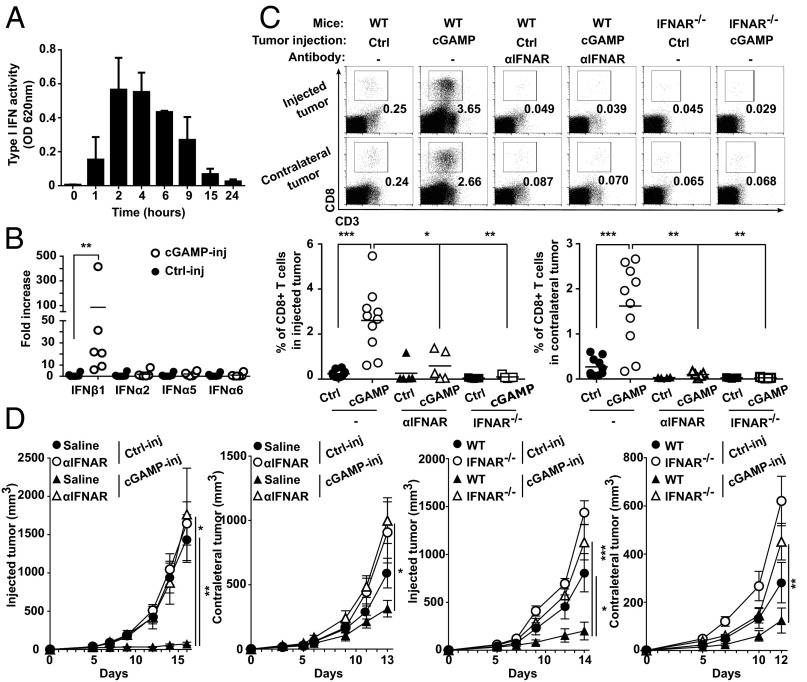
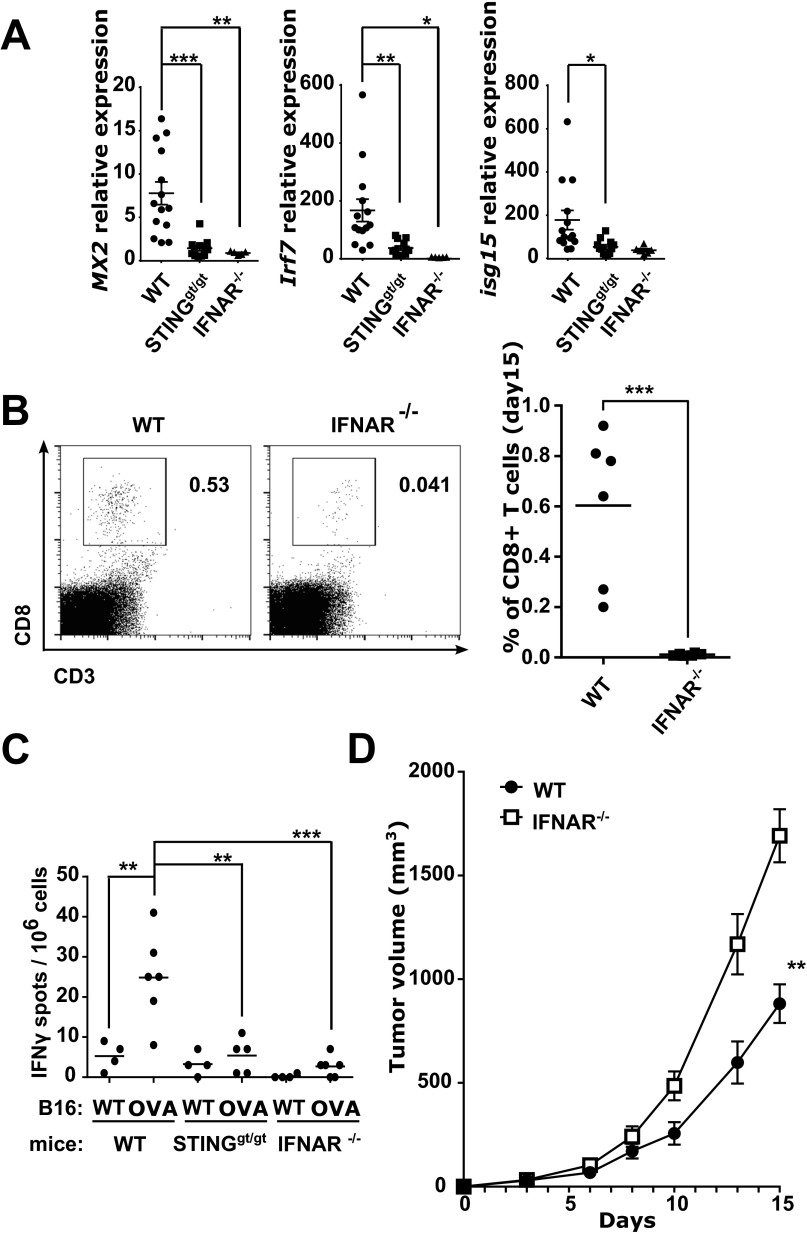
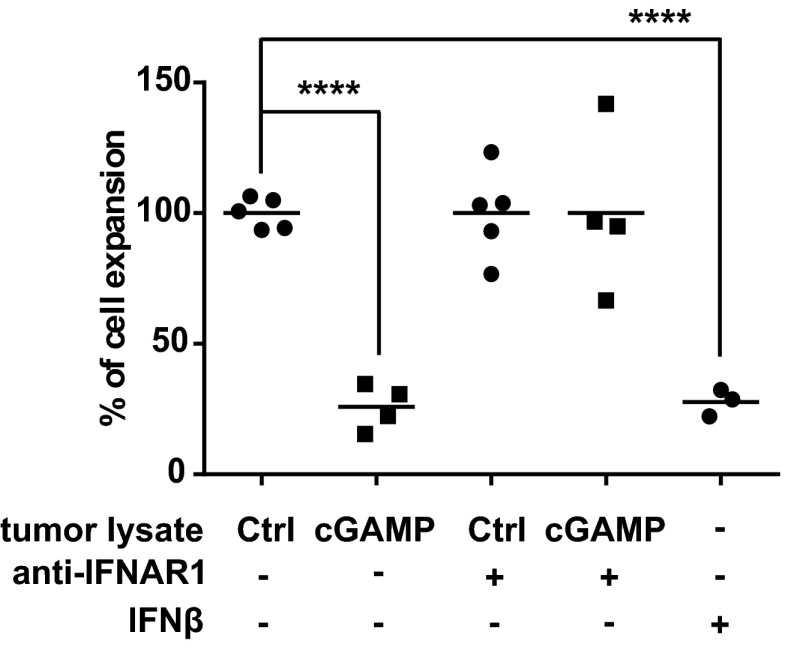
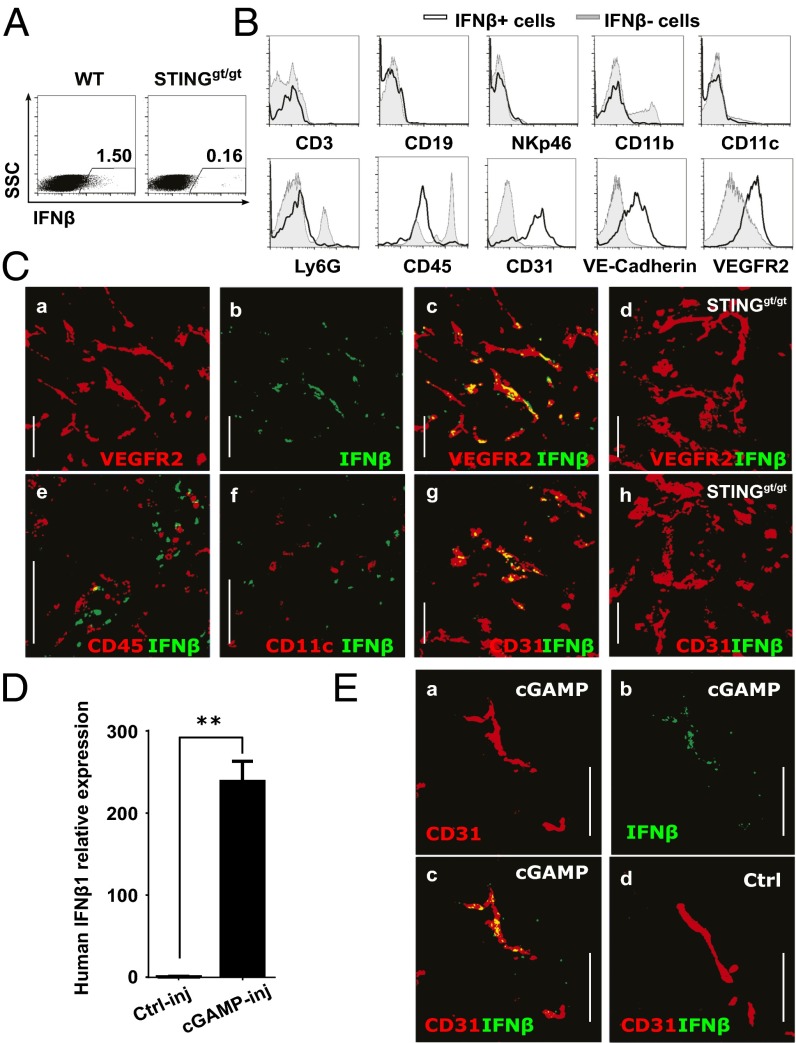
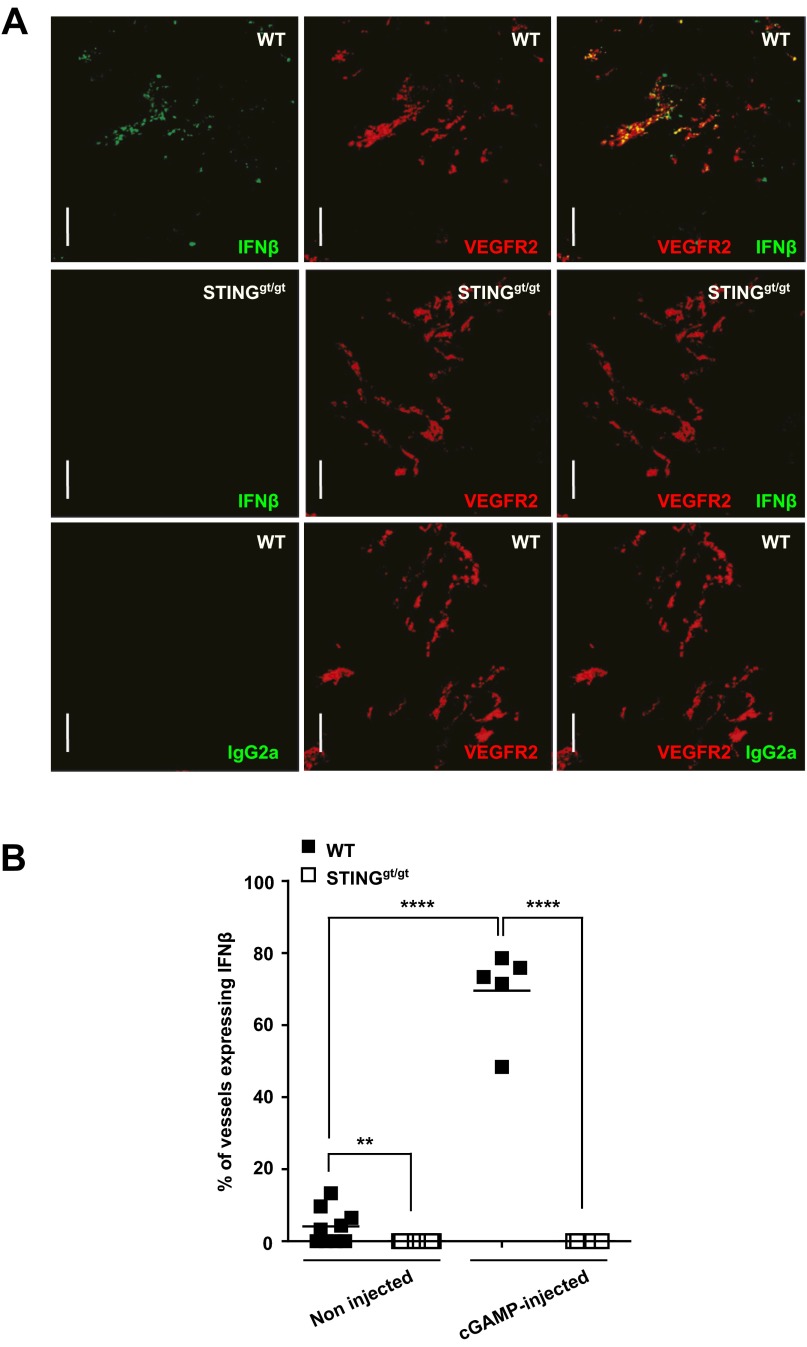
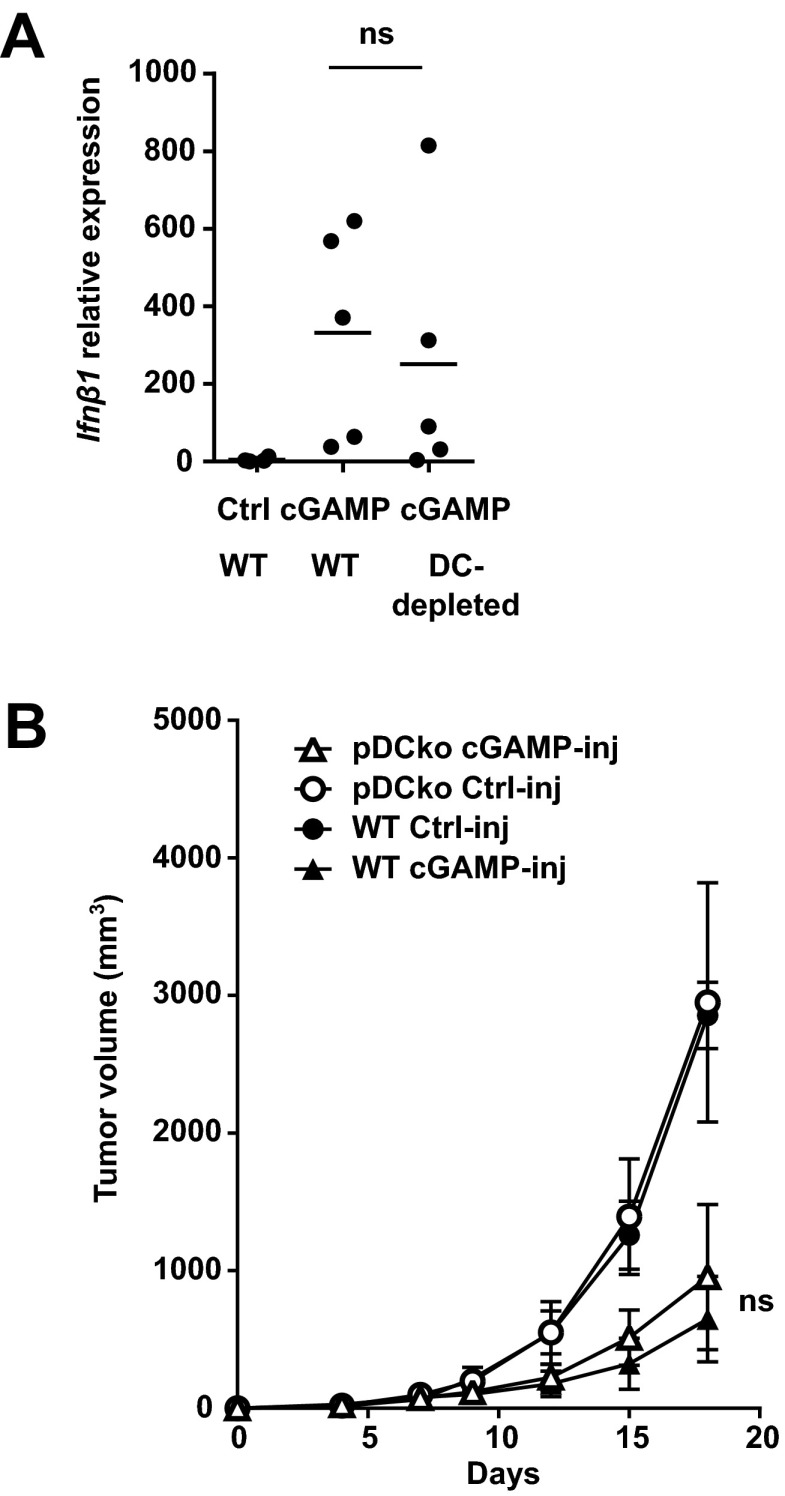
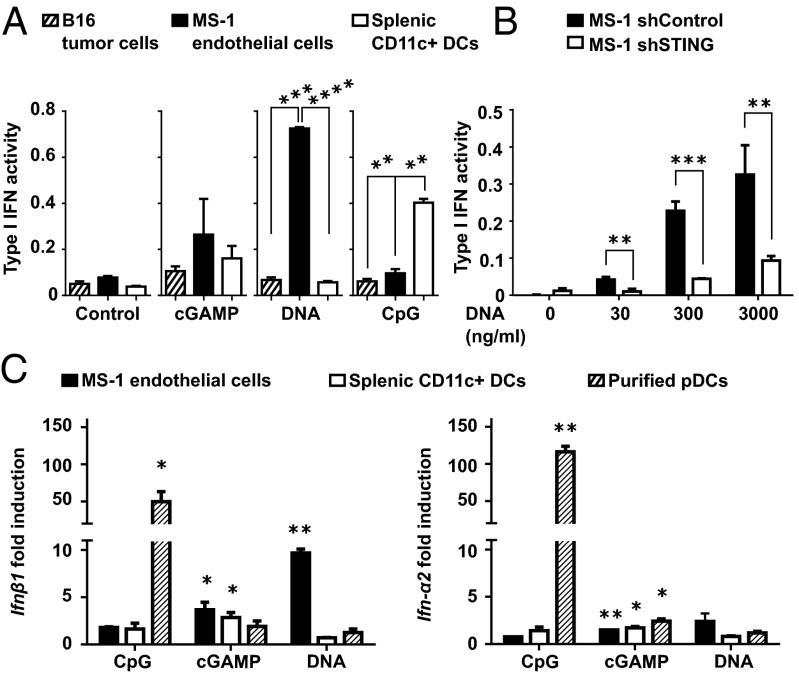
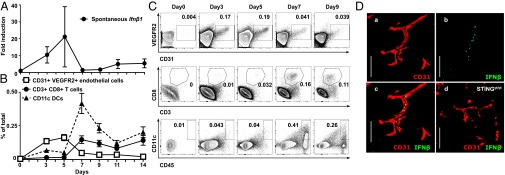
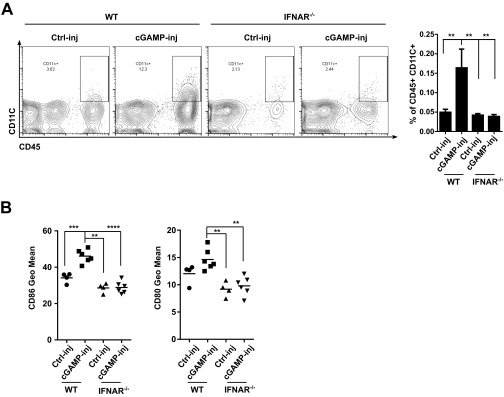
Spontaneous CD8 T-cell responses occur in growing tumors but are usually poorly effective. Understanding the molecular and cellular mechanisms that drive these responses is of major interest as they could be exploited to generate a more efficacious antitumor immunity. As such, stimulator of IFN genes (STING), an adaptor molecule involved in cytosolic DNA sensing, is required for the induction of antitumor CD8 T responses in mouse models of cancer. Here, we find that enforced activation of STING by intratumoral injection of cyclic dinucleotide GMP-AMP (cGAMP), potently enhanced antitumor CD8 T responses leading to growth control of injected and contralateral tumors in mouse models of melanoma and colon cancer. The ability of cGAMP to trigger antitumor immunity was further enhanced by the blockade of both PD1 and CTLA4. The STING-dependent antitumor immunity, either induced spontaneously in growing tumors or induced by intratumoral cGAMP injection was dependent on type I IFNs produced in the tumor microenvironment. In response to cGAMP injection, both in the mouse melanoma model and an ex vivo model of cultured human melanoma explants, the principal source of type I IFN was not dendritic cells, but instead endothelial cells. Similarly, endothelial cells but not dendritic cells were found to be the principal source of spontaneously induced type I IFNs in growing tumors. These data identify an unexpected role of the tumor vasculature in the initiation of CD8 T-cell antitumor immunity and demonstrate that tumor endothelial cells can be targeted for immunotherapy of melanoma.

Keywords: CD8 T cells; STING; antitumor immunity; tumor endothelial cells; type I IFNs.


Conflict of interest statement

The authors declare no conflict of interest.

Figures

Fig. 1.
Fig. 1.
Intratumoral cGAMP promotes CD8 T-cell responses and efficiently delays growth of injected tumors. (AC) C57BL6 or STINGgt/gt mice bearing established s.c. B16F10 tumors were either left untreated (non inj), injected intratumorally with cGAMP (cGAMP-inj), or injected with Lipofectamine alone (Ctrl-inj) at day 5 and day 10 postengraftment. Depicted are: (A) CD3+CD8+ T cells infiltrating tumors at day 15 postengraftment, measured by flow cytometry of tumor single cell suspensions. Representative plots are given (Left). Each symbol represents a separate mouse (Right). *P < 0.05, **P < 0.01, ***P < 0.001 by unpaired t test. (B) Tumor growth over time. Data are shown as mean tumor volume ± SEM of 5–6 mice per group, *P < 0.05, **P < 0.01 by two-way ANOVA. (C) Mouse survival monitored over time. Analysis include 5–16 mice per group, **P < 0.01, ****P < 0.0001 by log rank (Mantel Cox) test. (D) Mice bearing s.c. B16 tumors were treated as described above in the setting of anti-CTLA4 and anti-PD1 antibody treatment. Graph depicts tumor growth over time. Data are shown as mean tumor volume ± SEM of seven mice per group. *P < 0.05, **P < 0.01 by two-way ANOVA.
Fig. S1.
Fig. S1.
Intratumoral cGAMP injection promotes CD8 T-cell responses and efficiently delays growth of several melanoma models. (A and B) Tyr::N-Ras(Q61K)INK4a−/− melanoma cells (A) or B-RafV600E/+ PTEN−/− CDKN2A−/− melanoma cells (B) were implanted s.c. in WT mice. cGAMP (cGAMP-inj) or Lipofectamine alone (Ctrl-inj) was injected into tumors at day 5 and day 10 after engraftment. Depicted are: representative flow cytometry dot plots of CD8 T cells infiltrating tumors, quantification of tumor infiltrating CD8 T cells (*P < 0.05, **P < 0.01 by unpaired t test), and tumor growth analysis (represented as mean tumor volume ± SEM with n = 5. *P < 0.05, ****P < 0.0001 by two-way ANOVA). Data are combined from two independent experiments.
Fig. S2.
Fig. S2.
Intratumoral cGAMP injection promotes the generation of Ag-specific cytotoxic CD8 T cells that infiltrate the tumors. B16-WT or B16-OVA (if indicated) tumor cells were implanted s.c. into WT mice. (A and B) cGAMP (cGAMP-inj) or Lipofectamine alone (Ctrl-inj) was injected into tumors at day 5 and day 10. (A) Flow cytometry analysis of CD44 and CD62L expression gated on CD8 T cells infiltrating tumors at day 15. CD8 T cells from spleen of naive mice were used as control. (B) Tumor cell suspensions were cultured with Brefeldin A for 5 h in addition of PMA/Ionomycin if indicated. Data represent flow cytometry detection and quantification of IFNγ or Perforin expressing-CD8 T cells in tumor-derived cell suspension. *P < 0.05 by unpaired t test. (C and D) At day 4, 5 × 10⁶ OT-I splenocytes were transferred intravenously. cGAMP (cGAMP-inj) or Lipofectamine alone (Ctrl-inj) was injected into the tumor at day 5 and day 10. Flow cytometry analysis and quantification of OVA-specific CD8 T cells in tumors at day 15 detected with Vα2 (C) or SIINFEKL tetramer staining (D). **P < 0.01 by unpaired t test.
Fig. S3.
Fig. S3.
Intratumoral cGAMP injection induces high numbers of tumor-infiltrating CD4 T cells. (A) B16F10 were implanted s.c. into two opposite flanks of WT mice. At day 5 and day 10, cGAMP (cGAMP-inj) or Lipofectamine alone (Ctrl-inj) was injected into only one tumor. Data represent flow cytometry analysis and quantification of CD4 T cells infiltrating injected tumor and noninjected tumor (contralateral) at day 15. *P < 0.05, **P < 0.01 by unpaired t test. (B) Tyr::N-Ras(Q61K)INK4a−/− melanoma cells or B-RafV600E/+ PTEN−/− CDKN2A−/− melanoma cells were implanted s.c. into WT mice. At day 5 and day 10, cGAMP (cGAMP-inj) or Lipofectamine alone (Ctrl-inj) were injected into the tumor. Data represent flow cytometry analysis and quantification of CD4 T cells infiltrating injected tumors. *P < 0.05, **P < 0.01 by unpaired t test.
Fig. S4.
Fig. S4.
Increasing doses of aCTLA4/aPD1 treatment improve intratumoral cGAMP efficacy. B16F10 cells were implanted s.c. into WT mice. cGAMP (cGAMP-inj) or Lipofectamine alone (Ctrl-inj) was injected into the tumors at day 5. Anti-CTLA4/anti-PD1 treatment was injected intraperitoneally twice a week at the indicated dose. Data represent the percentage of tumor volume compared with Ctrl-injected tumor at day 18. Importantly, as in Fig. 1, anti-CTLA4/anti-PD1 alone showed significantly less activity than anti-CTLA4/anti-PD1 plus cGAMP (not shown). n = 5 mice per group. **P < 0.01 by two-way ANOVA.
Fig. 2.
Fig. 2.
Intratumoral STING activation leads to systemic CD8 T-cell–mediated antitumor immunity that controls the growth of distant tumors. (A) Mice bearing a 5-d established s.c. B16F10 tumor were treated by i.t. injection of cGAMP (cGAMP-inj) or Lipofectamine alone (Ctrl-inj) followed by i.v. injection of B16F10 melanoma cells. After 10 d, mice were killed and lung metastases counted macroscopically. Photographs of representative lungs are depicted (Left). Each symbol represents an independent mouse (Right); data are combined from two experiments. ****P < 0.0001 by unpaired t test. (B and C) Mice bearing two s.c. B16F10 tumors in opposite flanks were treated by i.t. injection of cGAMP (cGAMP-inj) or Lipofectamine alone (Ctrl-inj) in only one tumor. CD8-depleting antibody or saline were injected i.p. Graph depicts tumor growth over time of contralateral not injected tumors (B) and injected tumors (C). Data represent the mean tumor volume ± SEM of 9–10 mice per group pooled from two experiments. *P < 0.05, **P < 0.01 by two-way ANOVA.
Fig. S5.
Fig. S5.
Intratumoral cGAMP injection induces potent direct and systemic antitumor activity in the MC38 colon cancer model. MC38 colon cancer cells were implanted s.c. into two opposite flanks of WT mice. cGAMP (cGAMP-inj) or Lipofectamine alone (Ctrl-inj) was injected into one tumor at day 5. Data represent tumor growth of injected tumors and noninjected contralateral tumors, shown as the mean tumor volume ± SEM with n = 4–5. *P < 0.05, **P < 0.01 by two-way ANOVA.
Fig. 3.
Fig. 3.
Intratumoral cGAMP induces expression of IFN-β that drives local and systemic antitumor immunity. (A and B) Mice bearing 5-d established s.c. B16F10 tumors were treated by i.t. injection of cGAMP (cGAMP-inj) or Lipofectamine alone (Ctrl-inj). Depicted are: (A) Type I IFN activity in tumor extracts at the indicated time after treatment. (B) Ifn-β1, Ifn-α2, Ifn-α5, and Ifn-α6 mRNA expression in tumors 4 h after treatment. Each symbol represents an independent mouse, **P < 0.001 by unpaired t test. (C and D) B16F10 cells were implanted s.c. into opposite flanks of WT or IFNAR−/− mice followed by i.t. injection of cGAMP (cGAMP-inj) or Lipofectamine alone (Ctrl-inj) in only one tumor. WT mice were also treated with a neutralizing αIFNAR antibody. Depicted are: (C) CD3+CD8+ T cells infiltrating tumors at day 15 postengraftment, measured by flow cytometry of tumor single cell suspensions. Representative plots are given (Upper); each symbol represents an independent mouse (Lower). *P < 0.05, **P < 0.01, ***P < 0.001, ****P < 0.0001 by unpaired t test. (D) Tumor growth over time of injected and contralateral tumors. Data are given as the mean tumor volume ± SEM with n = 5, representative of two independent experiments, *P < 0.05, **P < 0.01, ***P < 0.001 by two-way ANOVA.
Fig. S6.
Fig. S6.
Spontaneous antitumor immunity in melanoma is IFNAR dependent. B16F10 or B16-OVA (if indicated) tumor cells were implanted s.c. in WT, STINGgt/gt, or IFNAR−/− mice. (A) Gene expression analysis of Mx2, Irf7, and Isg15 in tumors harvested at day 15 after engraftment. Data are combined from three independent experiments. (B) Flow cytometry analysis and quantification of tumor-infiltrating CD8+ T cells at day 15 after engraftment. Data are representative of two independent experiments. (C) At 11 d after engraftment, tumor draining lymph node cells were restimulated with 10 µg/mL SIINFEKL peptide for 24 h. The frequency of OVA-specific IFNγ-producing cells was evaluated by ELISPOT. Data are representative of three independent experiments. (D) B16F10 Tumor growth analysis in IFNAR−/− compared with WT mice. (AC) *P < 0.05, **P < 0.01, ***P < 0.005, by unpaired t test. (D) **P < 0.01 by two-way ANOVA.
Fig. S7.
Fig. S7.
Tumor extracts from cGAMP-injected tumor inhibit the growth of B16F10 cells in a type I IFN-dependent manner. Protein extracts were prepared from tumors lysed after they have been injected in vivo for 4 h with cGAMP or Lipofectamine (Ctrl). B16F10 cells were incubated with 300 µg/mL of tumor lysate proteins. Type I IFN signaling was blocked by adding 10 µg/mL of anti-IFNAR1 antibody (+) in the culture medium. As positive control, 10 units/mL of murine recombinant IFN-β was added to the culture (+). Data represent the percentage of cellular expansion compare with Ctrl conditions after 3 d of culture. Data are representative of at least three independent experiments. ****P < 0.0001 by unpaired t test.
Fig. 4.
Fig. 4.
Endothelial cells represent the main IFN-β producers upon intratumoral cGAMP injection in mouse and human. (AC) WT or STINGgt/gt mice bearing 5-d established s.c. B16F10 tumors were treated by i.t. injection of cGAMP plus Brefeldin A. Tumors were harvested after 5 h for flow cytometry and confocal microscopy analysis. (A) Intracellular IFN-β detection in tumor single cell suspensions. (B) Expression of CD3, CD19, NKp46, CD11b, CD11c, Ly6G, CD45, CD31, VE-cadherin, and VEGFR2 in IFN-β–producing cells (black line, gated as shown in A compared with nonIFN-β–producing cells (gray line). Data are representative of at least three independent experiments. (C) IFN-β expression on CD31 or VEGFR2 cells in tumor cryosections derived from WT (ac and eg) or STINGgt/gt mice (d and h). (Scale bar, 100 µm.) (D and E) Resected human melanoma skin metastases were injected with 2′3′-cGAMP (cGAMP-inj) or Lipofectamine alone (Ctrl-inj) and cultured in the presence of Brefeldin A (only in E) for 5 h before analysis. Depicted are: (D) Quantitative real-time PCR analysis of IFN-β1 mRNA expression in treated tumor explants. **P < 0.01 by unpaired t test. (E) Confocal microscopy of IFN-β and CD31 stained on cryosections derived from treated tumor explants. (Scale bar, 100 µm.)
Fig. S8.
Fig. S8.
Endothelial cells represent the main source of IFN-β in tumors upon therapeutic or spontaneous STING activation. (A) B16F10 cells were implanted into WT or STINGgt/gt mice. At day 5, tumors were treated with i.t. injection of cGAMP plus Brefeldin A for 5 h. Data represent confocal imaging of injected tumor cryosections stained with rat anti-mouse IFN-β, rat IgG2a isotype control, and goat anti-mouse VEGFR2 antibodies. (B) B16F10 cells were implanted into WT or STINGgt/gt mice. At day 5, tumors were treated for 5 h with Brefeldin A alone (noninjected) or Brefeldin A plus cGAMP (cGAMP-injected) before being embedded in OCT. Data represent the quantification by confocal microscopy of CD31+ vessels in tumors that express IFN-β. Each symbol represents an independent tumor. **P < 0.01, ****P < 0.0001 by unpaired t test.
Fig. S9.
Fig. S9.
IFN-β induction in response to intratumoral cGAMP is not altered in tumor of DC-depleted mice and antitumor activity induced by intratumoral cGAMP is retained in pDC-depleted mice. (A) B16F10 cells were engrafted into WT or CD11C-DTR transgenic mice. At day 4, 120 ng of diphteria toxin were i.p. injected in all mice. At day 5, 4 h after i.t. injection of cGAMP (cGAMP) or Lipofectamine alone (Ctrl), tumors were harvested for RNA extraction. Ifnβ1 gene expression was performed by quantitative PCR. ns, not significant by unpaired t test. (B) B16F10 cells were implanted s.c. into WT and hBDCA2-DTR mice. pDC depletion was achieved by systemic injection of 120 ng of diphteria toxin at day 4 and day 9. cGAMP or Lipofectamine (control) was injected into tumors at day 5 and 10. Tumor growth was monitored over time. Data show the mean tumor volume ± SEM with n = 4–5. ns, not significant by two-way ANOVA.
Fig. 5.
Fig. 5.
Endothelial cells are specialized in producing large quantities of IFN-β in response to STING activation. (A) MS-1 endothelial cells, B16 tumor cells, and splenic CD11c+ DCs were stimulated overnight with cGAMP (5 µg/mL), tumor DNA (3 µg/mL), both complexed with Lipofectamine or with CpG-B (1 µg/mL). Type I IFN activity was measured in the culture supernatant. Data are expressed as mean ± SD and are representative of three independent experiments. **P < 0.01, ***P < 0.001, ****P < 0.0001 by unpaired t test. (B) STING-deficient (shSTING) or control (shControl) MS-1 endothelial cells were stimulated overnight with increasing concentrations of tumor DNA complexed with Lipofectamine. Type I IFN activity was measured in the culture supernatant. Data are expressed as mean ± SD of two independent experiments. **P < 0.01, ***P < 0.005 by unpaired t test. (C) MS-1 endothelial cells, spleen CD11c+ DCs, or purified spleen pDCs were activated for 5 h as described in A. Ifn-β1 and Ifn-α2 gene expression were determined by quantitative real-time PCR. Data are shown as fold induction over nonstimulated cells. *P < 0.05, **P < 0.01, by unpaired t test.
Fig. 6.
Fig. 6.
Endothelial cells are the principal IFN-β producers in response to spontaneous STING activation in tumors. B16F10 melanoma cells were implanted into the flank of WT or STINGgt/gt mice. (A) Time course analysis of spontaneous Ifn-β1 mRNA expression in tumors after implantation in WT mice. Data represent the mean ± SEM of at least four independent mice. (B) Detection by flow cytometry of endothelial cells (VEGFR2+ CD31+ gated on CD45lo/neg), CD8 T cells (CD3+ CD8+), and DCs (CD45+ CD11c+) in single cell suspensions derived from tumors over time after their implantation. Data are expressed as mean ± SD of at least four independent mice. (C) Representative flow cytometry plot is shown. (D) Detection of spontaneous IFN-β production in tumors. Data show representative confocal microscopy images of 5-d-old tumors harvested from WT (ac) or STINGgt/gt mice (d) and stained for IFN-β and CD31. (Scale bar, 100 µm.)
Fig. S10.
Fig. S10.
Type I IFNs increase the number of infiltrating DCs in cGAMP-injected tumors and stimulate DC maturation in lymph node draining cGAMP-injected tumors. B16F10 cells were implanted into WT or IFNAR−/− mice. At day 5, tumors were injected with cGAMP (cGAMP-inj) or Lipofectamine alone (Ctrl-inj). (A) At day 7, CD11c+ DC number was analyzed in tumors by flow cytometry. (B) At day 7, CD11C+ DCs from tumor draining lymph nodes were analyzed by flow cytometry for CD86 and CD80 expression. **P < 0.01, ***P < 0.001, ****P < 0.0001 by unpaired t test.

Similar articles

Cited by

References

    1. Luke JJ, Hodi FS. Ipilimumab, vemurafenib, dabrafenib, and trametinib: Synergistic competitors in the clinical management of BRAF mutant malignant melanoma. Oncologist. 2013;18(6):717–725. - PMC - PubMed
    1. Pittet MJ, et al. High frequencies of naive Melan-A/MART-1-specific CD8(+) T cells in a large proportion of human histocompatibility leukocyte antigen (HLA)-A2 individuals. J Exp Med. 1999;190(5):705–715. - PMC - PubMed
    1. Valmori D, et al. Frequent cytolytic T-cell responses to peptide MAGE-A10(254-262) in melanoma. Cancer Res. 2001;61(2):509–512. - PubMed
    1. Hodi FS, et al. Improved survival with ipilimumab in patients with metastatic melanoma. N Engl J Med. 2010;363(8):711–723. - PMC - PubMed
    1. Hamid O, et al. Safety and tumor responses with lambrolizumab (anti-PD-1) in melanoma. N Engl J Med. 2013;369(2):134–144. - PMC - PubMed

Publication types

MeSH terms