. 2015 Nov 26:6:10071.
doi: 10.1038/ncomms10071.

Acute loss of TET function results in aggressive myeloid cancer in mice

Affiliations

Acute loss of TET function results in aggressive myeloid cancer in mice

Jungeun An et al. Nat Commun. .

Abstract

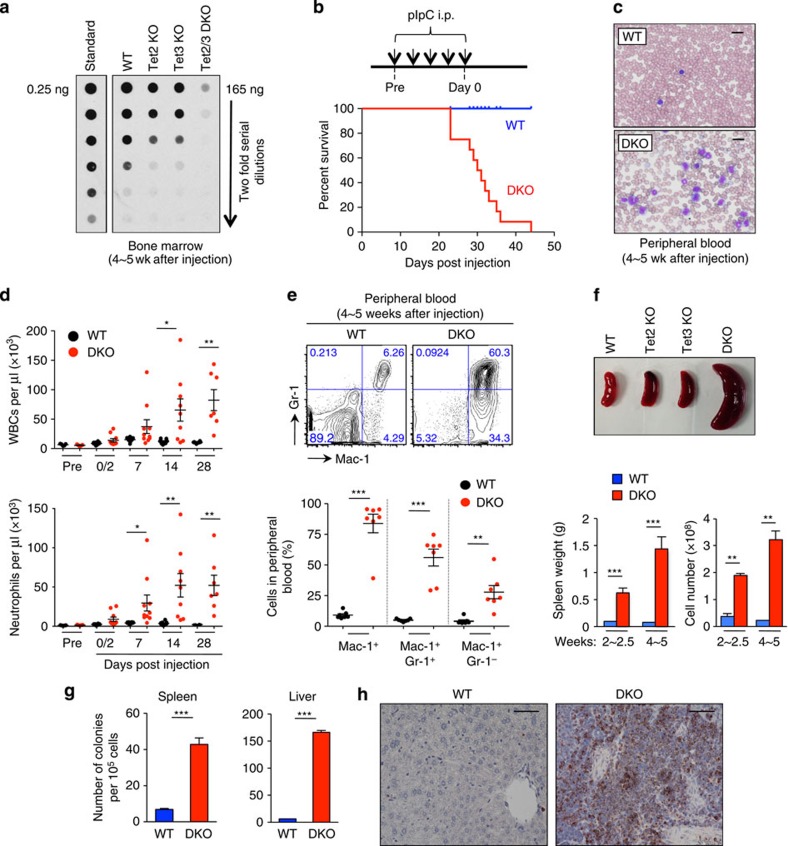
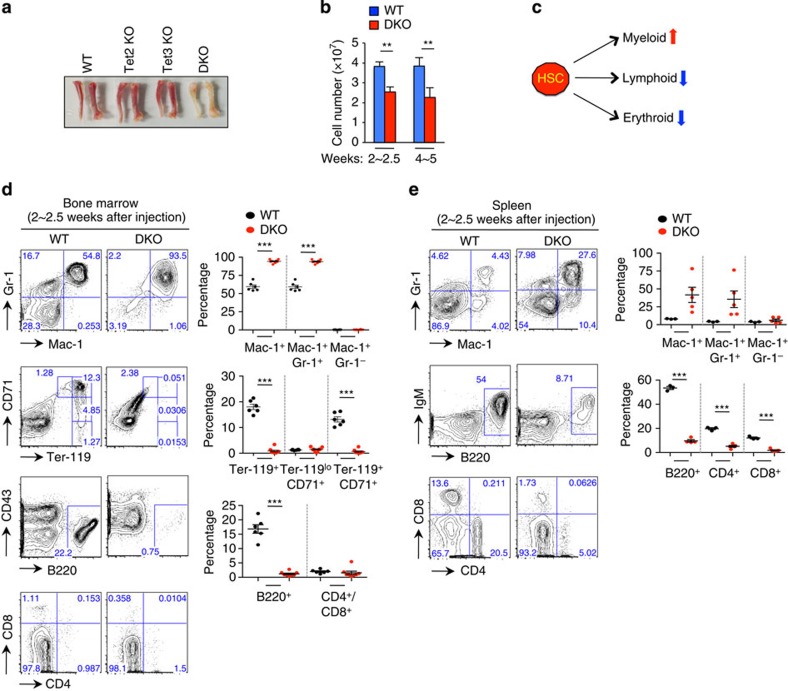
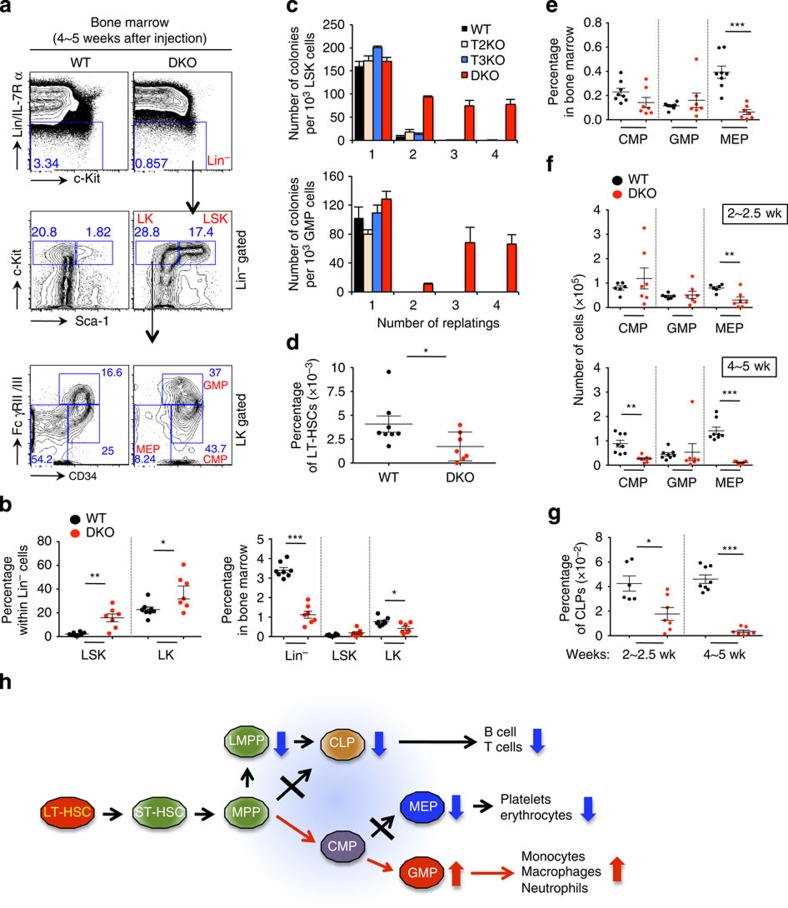
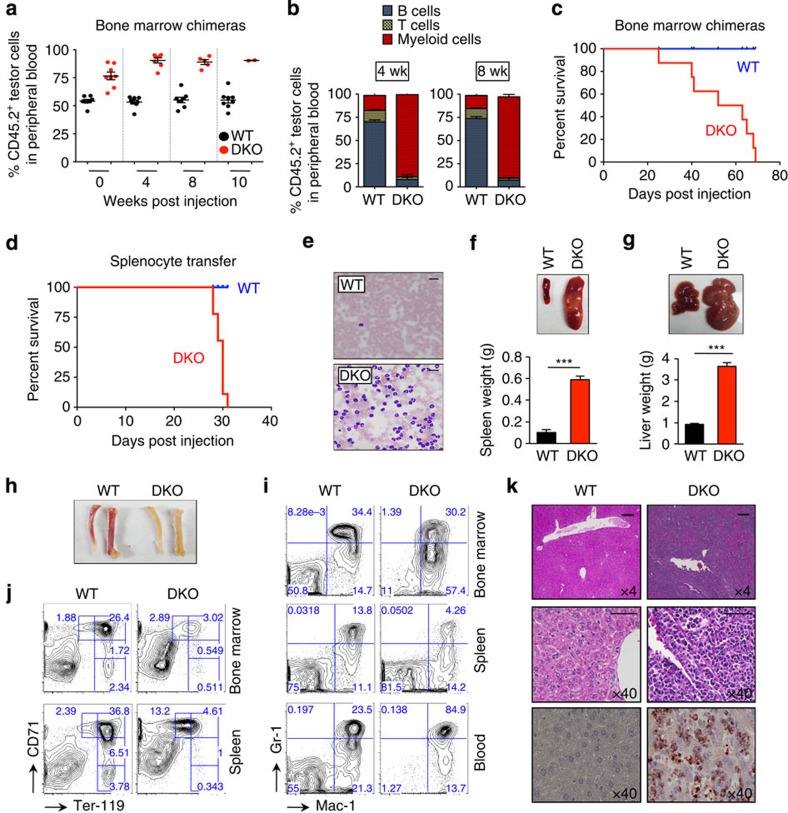
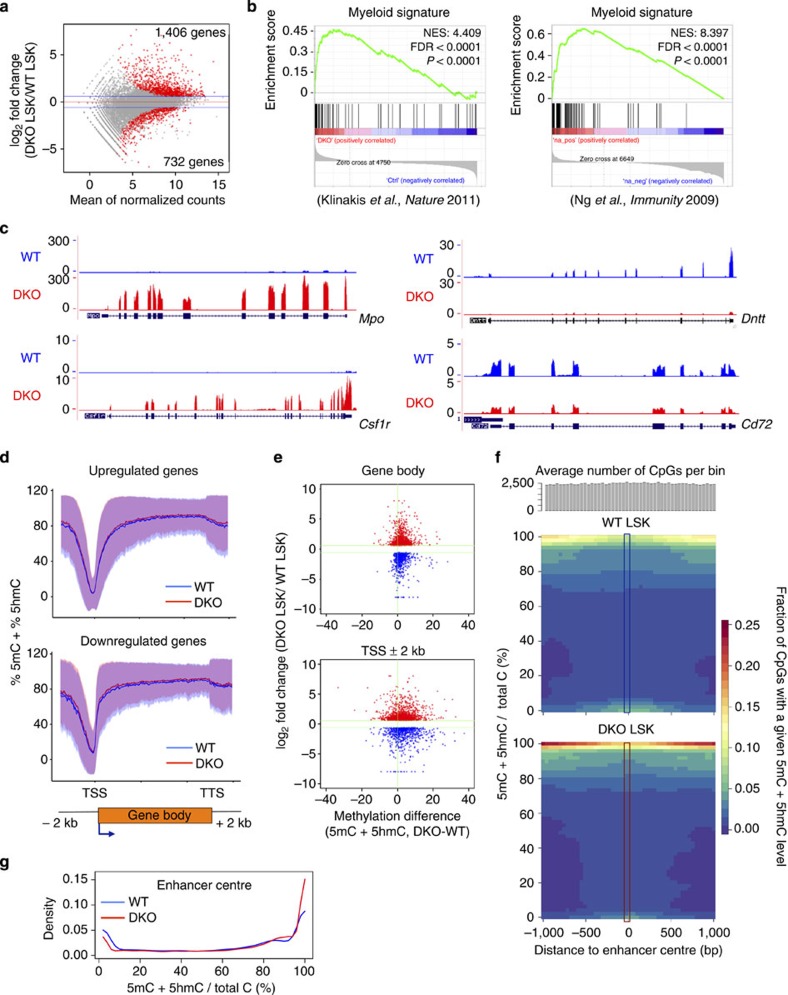
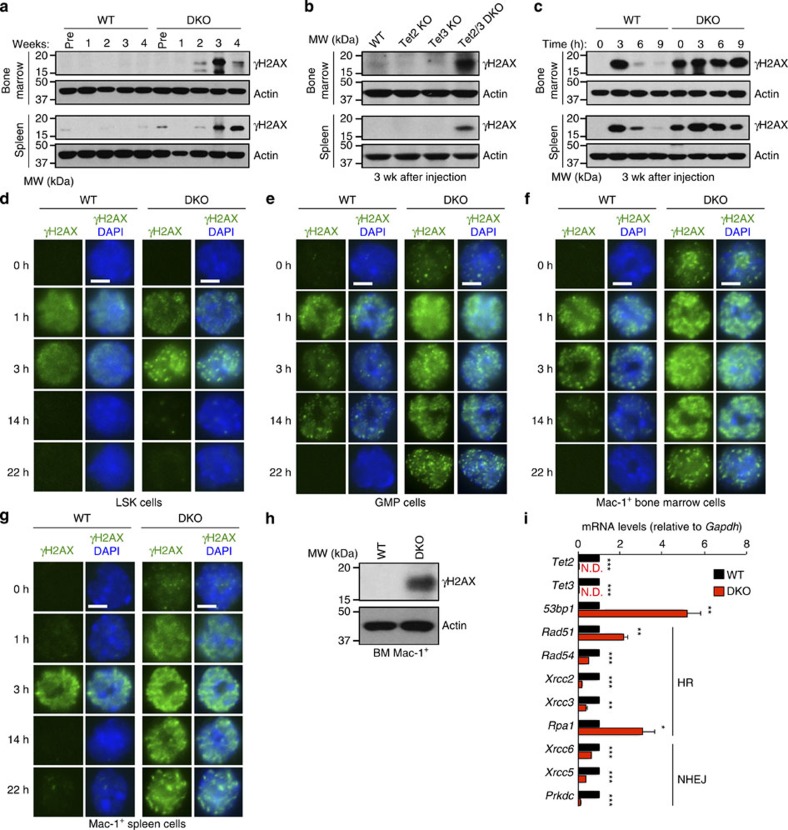
TET-family dioxygenases oxidize 5-methylcytosine (5mC) in DNA, and exert tumour suppressor activity in many types of cancers. Even in the absence of TET coding region mutations, TET loss-of-function is strongly associated with cancer. Here we show that acute elimination of TET function induces the rapid development of an aggressive, fully-penetrant and cell-autonomous myeloid leukaemia in mice, pointing to a causative role for TET loss-of-function in this myeloid malignancy. Phenotypic and transcriptional profiling shows aberrant differentiation of haematopoietic stem/progenitor cells, impaired erythroid and lymphoid differentiation and strong skewing to the myeloid lineage, with only a mild relation to changes in DNA modification. We also observe progressive accumulation of phospho-H2AX and strong impairment of DNA damage repair pathways, suggesting a key role for TET proteins in maintaining genome integrity.


Figures

Figure 1
Figure 1. Acute deletion of Tet3 in Tet2-deficient mice results in myeloid leukaemia.
(a) Quantification of 5hmC levels in Tet2/3 DKO bone marrow 4 weeks after pIpC injection by anti-CMS dot blot. (b) Kaplan–Meier curve representing percent survival of WT (n=23) and DKO (n=14) mice over time after pIpC injection. No lethality was observed for WT, Tet2-deficient (n=4) and Tet3-deficient (n=6) mice during this period. Strategy for conditional deletion of Tet3 in adult mice is shown above. For exact genotypes, see Methods. (c) May–Grünwald–Giemsa-stained peripheral blood smears, 4 weeks after pIpC administration (n=7). Scale bar, 20 μm. (d) Time-course analysis of peripheral blood cell counts after acute deletion of Tet3 in Tet2-deficient mice (means±s.e.m.). DKO mice developed progressive leukocytosis with neutrophilia (n=7∼10 per genotype at each time point examined). *P<0.05, **P<0.005 (Student's t-test). Also see Supplementary Fig. 2. (e) Expansion of myeloid-lineage cells in DKO mice. Flow cytometric analysis of myeloid cells in the peripheral blood of WT (n=7) or DKO (n=7) mice was performed at 4 weeks following pIpC injection. Bottom, summary of results (means±s.e.m.). For kinetic analyses of myeloid, B- and T-cell lineages over the entire time course, see Supplementary Fig. 3. **P<0.005, ***P<0.0005 (Student's t-test). (f) Enlargement of spleens in Tet2/3 DKO mice at 2∼2.5 weeks following pIpC injection. Top—representative photographs. Bottom—spleen weights and cellularity (n=7∼13 and 4∼6 per genotype) at 2–2.5 or 4–5 weeks after pIpC injection (means±s.e.m.). **P<0.005, ***P<0.0005 (Student's t-test). (g) Extramedullary haematopoiesis in spleen and liver of Tet2/3 DKO mice. Cells were harvested from the spleen (left) or liver (right) of WT and diseased Tet2/3 DKO mice and 105 nucleated cells were plated in methylcellulose medium. Colony-forming units were assessed by counting cell colonies 7 days after plating. ***P<0.0005 (Student's t-test) (h) Myeloperoxidase staining of livers at 4 weeks after pIpC injection (× 40 magnification). For liver weight and histological analysis data, see Supplementary Fig. 4a–d. Scale bar, 60 μm.
Figure 2
Figure 2. Combined loss of Tet2 and Tet3 results in expansion of myeloid cells with impaired lymphoid and erythroid differentiation.
(a) Representative photographs of femurs and tibiae at 4 weeks following pIpC injection. Tet2 KO, Tet2−/− Tet3fl/fl Mx1-Cre or Tet2−/− Mx1-Cre+; Tet3 KO, Tet3fl/fl Mx1-Cre+. (b) Total cellularity of bone marrow was assessed at the indicated time points after pIpC injection (n=8∼11 per genotype at each time point). Means±s.e.m. are shown. **P<0.005 (Student's t-test). (c) Schematic representation of myeloid expansion and impaired lymphoid and erythroid development upon loss of Tet2 and Tet3. (d,e) Haematopoietic cell development upon simultaneous deletion of Tet2 and Tet3. Flow cytometry was performed to assess myeloid (Gr-1/Mac-1), erythroid (CD71/Ter-119) and lymphoid (B220/CD4/CD8) cell populations in the bone marrow (d, n=8 per each genotype) and spleen (e, n=6 per each genotype) of WT or DKO mice. Representative flow cytometry plots (left) and summary graphs (right) at 2∼2.5 weeks after pIpC injection are shown. For results at 4∼5 weeks, see Supplementary Figs 7 and 8. Means±s.e.m. are shown. **P<0.005, ***P<0.0005 (Student's t-test).
Figure 3
Figure 3. Altered development of haematopoietic stem and progenitor cells in Tet2/3 DKO mice.
(a) Representative flow cytometric analysis of LSK (Lin c-Kit+ Sca1+) and LK (Lin c-Kit+ Sca1) populations in the bone marrow of WT and Tet2/3 DKO mice 4 weeks after pIpC injection. Myeloid progenitors (CMP, common myeloid progenitors; GMP, granulocyte–monocyte progenitors; MEP, megakaryocyte-erythroid progenitors) were further analysed based on CD34 and FcγRII/III expression within LK populations. (b) Percentages of LSK and LK cells within Lin (left) or total bone marrow (right) shown in a (n=7∼8) (means±s.e.m.). *P<0.05, **P<0.005, ***P<0.0005 (Student's t-test). For percentages at 2∼2.5 weeks and absolute cell numbers see Supplementary Fig. 9a,b. (c) Combined deficiency of Tet2 and Tet3 leads to increased serial replating capacity in vitro. WT, Tet2-deficient (T2KO), Tet3-deficient (T3KO) and DKO mice were treated with pIpC, and colony-forming unit assays were performed with LSK (upper panel) or GMP (lower panel) cells. DKO, but not WT, T2KO or T3KO LSK and GMP cells can be serially replated in methylcellulose medium. For results after acute deletion of Tet3 in vitro in Tet2−/− Tet3fl/fl ERT2-Cre+ mice, see Supplementary Fig. 9c–f. (d) Percentage of long-term haematopoietic stem cells (LT-HSC, LSK CD150+ CD48). For representative flow cytometric analysis, see Supplementary Fig. 10a. (e) Percentages of myeloid progenitor cell subsets shown in (a) (n=7∼8) (means±s.e.m.). ***P<0.0005 (Student's t-test). For results at 2∼2.5 weeks and absolute cell numbers, see Supplementary Fig. 11a,b. (f) Absolute numbers of myeloid progenitor cells in bone marrow of WT and Tet2/3 DKO mice. Means±s.e.m. are shown. **P<0.005, ***P<0.0005 (Student's t-test). (g) Percentages of common lymphoid progenitors (CLP, Lin Flt3+ CD27+ IL-7Rα+) in the bone marrow at 2 or 4 weeks after pIpC injection (n=6∼8). Gating strategy and absolute cell numbers are shown in Supplementary Fig. 11c,d. Means±s.e.m. are shown. *P<0.05, ***P<0.0005 (Student's t-test). (h) Schematic representation of altered haematopoietic development in Tet2/3 DKO mice.
Figure 4
Figure 4. Cell-autonomous development of transplantable myeloid leukaemia in Tet2/3 DKO mice.
(a) Competitive repopulation assay using bone marrow cells from inducible chimeric mice. Red blood cell-depleted CD45.2+ bone marrow cells from Tet2+/+ Tet3fl/fl Mx1-Cre (WT) or Tet2−/− Tet3fl/fl Mx1-Cre+ (DKO) mice were mixed with equal numbers of CD45.1+ competitor cells and transplanted into lethally irradiated CD45.1+ congenic B6.SJL mice (see Supplementary Fig. 12a). At 4 weeks after transplantation, Tet3 deletion was induced by administration of pIpC and peripheral blood was examined for donor chimerism at the indicated time points after pIpC injection. (b) Analysis of multilineage differentiation as percentage of peripheral blood cells within donor-derived (CD45.2+) cells. Myeloid cells (Mac-1+), B cells (B220+), T cells (CD3ɛ+). (c) Kaplan–Meier curve representing percent survival of bone marrow chimeric mice that received WT or Tet2/3 DKO cells after pIpC injection (n=8 per group). No lethality was observed for recipients of WT bone marrow cells. (d) Kaplan–Meier curve representing percent survival of recipient mice transplanted with 2 × 10⁶ splenocytes from WT and diseased Tet2/3 DKO mice (n=9 per group). (e) May–Grünwald–Giemsa-stained peripheral blood smears of recipient mice. Scale bar, 20 μm. (f,g) Enlargement of spleens and livers of recipient mice. Representative photographs of spleen (f) and liver (g) from recipients of control or Tet2/3 DKO splenocytes. Weights of spleen or liver are shown below (n=7 per group). Means±s.e.m. are shown. ***P<0.0005 (Student's t-test). (h) Representative photographs of femurs and tibiae from recipients of WT or Tet2/3 DKO splenocytes. (i) A representative flow cytometric analysis of myeloid-lineage cells (Gr-1+/Mac-1+) in bone marrow, spleen and blood of recipient mice (n=5 per each group). (j) A representative flow cytometric analysis of erythroid-lineage cells (Ter-119+/CD71+) in bone marrow and spleen of recipient mice (n=5 per each group). (k) Haematoxylin and eosin staining and immunohistochemistry (IHC) of livers with anti-myeloperoxidase show loss of normal liver structure and infiltration with myeloid cells. Top, × 4 magnification; middle and bottom, × 40 magnification. Scale bar, 200 μm (upper panel) and 60 μm (middle panel).
Figure 5
Figure 5. Changes in gene expression and DNA modification (5mC+5hmC) in Tet2/3 DKO cells.
(a) Differential gene expression in WT versus Tet2/3 DKO LSK cells. Red dots—differentially expressed genes (P value ≤0.05, fold change >1.5 or <0.67; thresholds indicated by blue lines). Grey dots—all other genes. (b) Gene set enrichment analysis (GSEA) of RNA-Seq data. Myeloid gene signatures are significantly enriched for genes upregulated in Tet2/3 DKO versus WT LSK cells. (c) Genome browser visualization showing increased and decreased expression of myeloid (Mpo, Csf1r) and lymphoid (Dntt, Cd72) genes in Tet2/3 DKO versus control LSK cells. (d) Slight but consistent increase in average DNA modification at gene regions in Tet2/3 DKO (red lines) versus WT LSK cells (blue lines), regardless of whether gene expression is upregulated (top) or downregulated (bottom). Similar results were obtained for all genes (Supplementary Fig. 17c). Shaded areas=±1 s.d. TSS, transcription start site; TTS, transcription termination site. (e) Changes in gene expression versus changes in average DNA methylation for all genes differentially expressed in Tet2/3 DKO LSK versus WT LSK cells. Top, gene bodies; bottom, promoter regions (TSS±2 kb). Each gene body/TSS region is represented by a dot. Most regions show increased methylation, regardless of whether they are up- or downregulated in DKO LSK cells relative to WT. (f) Active enhancer regions in LT-HSC show increased DNA modification (5mC+5hmC) in Tet2/3 DKO versus WT LSK cells. Each bin contains all the CpGs falling within the ∼7,000 active enhancer regions. Colour scale, density of CpGs with the indicated methylation levels. Enhancer centres in WT LSK cells show an increased fraction of unmethylated CpGs relative to Tet2/3 DKO LSK cells (green colour at the bottom), whereas enhancer edges in Tet2/3 DKO LSK cells show an increased fraction of methylated CpGs (5mC+5hmC) compared with WT (red colour at the top). For details, see Supplementary Methods. (g) Graphical representation of increased DNA modification in Tet2/3 DKO versus WT LSK cells. Data are from central regions of the enhancers (blue and red rectangles in f).
Figure 6
Figure 6. Loss of Tet2 and Tet3 results in DNA damage and impaired DNA repair.
(ac) γH2AX levels in whole-cell lysates from bone marrow (top) and spleen (bottom), assessed by immunoblotting. Actin serves as a loading control. (a) Progressive increase in γH2AX levels in bone marrow and spleen of Tet2/3 DKO mice with time after pIpC injection. (b) Accumulation of γH2AX in bone marrow and spleen of Tet2/3 DKO but not Tet2KO or Tet3KO mice, 3 weeks after pIpC injection. (c) Impaired DNA repair in Tet2/3 DKO cells. WT and DKO mice were exposed to 6 Gy of ionizing radiation 3 weeks after pIpC injection, single-cell suspensions of bone marrow and spleens were prepared at the indicated times, and DNA repair kinetics were assessed by immunoblotting. Similar results were obtained 1 week after pIpC injection (Supplementary Fig. 19a). (dg) DNA damage repair is impaired in Tet2/3 DKO myeloid-lineage cells. LSK (d), GMP (e) and Mac-1+ cells in bone marrow (f), or Mac-1+ cells in spleen (g) were sorted from WT and DKO mice at 3 weeks after pIpC injection, exposed to 6 Gy of ionizing radiation, and DNA repair kinetics were assessed by immunocytochemistry. LSK cells repair DNA damage efficiently, whereas GMP and Mac-1+ cells do not. Similar results were obtained using tamoxifen-injected Tet2fl/fl Tet3fl/fl ERT2-Cre+ mice (Supplementary Fig. 19b–d). Scale bar, 5 μm. (h) Increase in γH2AX levels in Mac-1+ cells sorted from bone marrow of DKO mice 3–4 weeks after pIpC injection. (i) TET proteins control expression of DNA repair genes in myeloid cells. Quantitative reverse transcription–PCR of Mac-1+ cells sorted from bone marrow of WT (Tet2fl/fl Tet3fl/fl) and DKO (Tet2fl/fl Tet3fl/fl Mx1-Cre+) mice 3–4 weeks after pIpC injection. Results are expressed as fold change over WT cells (set to 1; three independent experiments; means±s.e.m.). Similar results were observed in sorted Mac-1+ cells from WT (Tet2+/+Tet3fl/fl) and Tet2−/− Tet3fl/fl Mx1-Cre+ mice (Supplementary Fig. 19e). HR, homologous recombination; NHEJ, non-homologous end-joining; ND, not detected. *P<0.05, **P<0.005, ***P<0.0005 (Student's t-test).

References

    1. Tahiliani M. et al.. Conversion of 5-methylcytosine to 5-hydroxymethylcytosine in mammalian DNA by MLL partner TET1. Science 324, 930–935 (2009). - PMC - PubMed
    1. Ko M. et al.. Impaired hydroxylation of 5-methylcytosine in myeloid cancers with mutant TET2. Nature 468, 839–843 (2010). - PMC - PubMed
    1. Ito S. et al.. Tet proteins can convert 5-methylcytosine to 5-formylcytosine and 5-carboxylcytosine. Science 333, 1300–1303 (2011). - PMC - PubMed
    1. He Y. F. et al.. Tet-mediated formation of 5-carboxylcytosine and its excision by TDG in mammalian DNA. Science 333, 1303–1307 (2011). - PMC - PubMed
    1. Pastor W. A., Aravind L. & Rao A. TETonic shift: biological roles of TET proteins in DNA demethylation and transcription. Nat. Rev. Mol. Cell Biol. 14, 341–356 (2013). - PMC - PubMed

Publication types

Associated data