. 2016 Jan 1;196(1):64-71.
doi: 10.4049/jimmunol.1402664. Epub 2015 Nov 25.

The Tumor Antigen NY-ESO-1 Mediates Direct Recognition of Melanoma Cells by CD4+ T Cells after Intercellular Antigen Transfer

Affiliations

The Tumor Antigen NY-ESO-1 Mediates Direct Recognition of Melanoma Cells by CD4+ T Cells after Intercellular Antigen Transfer

Jean Francois Fonteneau et al. J Immunol. .

Abstract

NY-ESO-1-specific CD4(+) T cells are of interest for immune therapy against tumors, because it has been shown that their transfer into a patient with melanoma resulted in tumor regression. Therefore, we investigated how NY-ESO-1 is processed onto MHC class II molecules for direct CD4(+) T cell recognition of melanoma cells. We could rule out proteasome and autophagy-dependent endogenous Ag processing for MHC class II presentation. In contrast, intercellular Ag transfer, followed by classical MHC class II Ag processing via endocytosis, sensitized neighboring melanoma cells for CD4(+) T cell recognition. However, macroautophagy targeting of NY-ESO-1 enhanced MHC class II presentation. Therefore, both elevated NY-ESO-1 release and macroautophagy targeting could improve melanoma cell recognition by CD4(+) T cells and should be explored during immunotherapy of melanoma.


Figures

FIGURE 1.
FIGURE 1.
Cytosolic NY-ESO-1 is processed for MHC class II presentation by lysosomal degradation. (A) The human melanoma M6 cell line was transfected with MYC-HIS–tagged NY-ESO-1 or with a control plasmid. Localization of transfected NY-ESO-1 protein was investigated with an anti-HIS Ab in immune fluorescence microscopy. DAPI was used to stain nuclear DNA. One representative out of three experiments is shown. Scale bars, 40 μm. (B) IFN-γ secretion by the NY-ESO-1157–170–specific HLA-DP4–restricted CD4+ T cell clone in response to the NY-ESO-1–positive HLA-DP4–positive melanoma cell lines M6 and M29 and as a negative control to the NY-ESO-1–negative HLA-DP4–positive melanoma cell line M199. Secreted IFN-γ was assessed by ELISA assays from the coculture supernatant. Melanoma–T cell cocultures were performed at the indicated E:T cell ratios. The data represent the mean of four independent experiments. The y-axis represents the relative percentage of IFN-γ secretion reported to the maximal secretion of IFN-γ of the CD4+ T cell clone, pulsed with the cognate peptide only (10 μg/ml) and set to 100%. (C) As in (B), but targets were M6 melanoma cells treated overnight with leupeptin (LEU), brefeldin A (BFA), CQ, and lactacystin (LACT). The data represent the mean of three independent experiments. Statistical analysis was performed using an unpaired nonparametric t test (*p < 0.05, **p < 0.01). (D and E) Inhibition of lysosomal proteases leads to the accumulation of NY-ESO protein: (D) Western blot analysis of NY-ESO-1 levels in untreated (Control) M6 melanoma cells or after 24 h of treatment with different inhibitors: 50 μmol CQ, E64 at 50 and 25 μmol, and lactacystin (LACT) at 5 μmol. The data represent one of two experiments. The high molecular mass bands marked with an asterisk (*) are proteins that cross-react with the NY-ESO-1 antiserum. (E) Immunofluorescence analysis of M6 melanoma cell lines transfected with the MYC-HIS–tagged NY-ESO-1 plasmid and treated for 24 h with E64 and lactacystin. DAPI was used to stain nuclear DNA. Scale bars, 40 μm.
FIGURE 2.
FIGURE 2.
Constitutive macroautophagy of melanoma cells does not process NY-ESO-1 for MHC class II presentation. (A) Top panel, M6 melanoma stably transfected with the macroautophagy reporter construct GFP-LC3 were treated with CQ for 10 h. Bottom panel, M6-GFP-LC3 cells were transiently transfected with a siRNA control or an siRNA-targeting Atg12 (ATG12 SiRNA). Forty-eight hours later, autophagosomes accumulation was analyzed by fluorescence microscopy, after overnight treatment with CQ. DAPI was used to stain nuclear DNA. The data represent one of four independent experiments. Scale bars, 40 μm. (B) IFN-γ secretion by the NY-ESO-1157–170–specific HLA-DP4–restricted CD4+ T cell clone after coculture with M6 melanoma cells transfected with an siRNA control or a specific Atg12 siRNA (ATG12 SiRNA). Cocultures were performed 48 h after siRNA transfection at the indicated E:T ratios. The data represent the mean of four independent experiments. The y-axis represents the relative percentage of IFN-γ secretion reported to the maximal secretion of IFN-γ of the CD4+ T cell clone, pulsed with the cognate peptide only (10 μg/ml) and set to 100%. (C) Western blot analysis of Atg12 level in M6 melanoma cells 48 h posttransfection either with an siRNA control (si control) or a specific Atg12 siRNA (si ATG12).
FIGURE 3.
FIGURE 3.
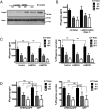
NY-ESO-1 is not processed by chaperone-mediated autophagy for MHC class II presentation. (A) Western blot analysis of RNA silencing of Lamp2A in M6 melanoma cells at 48 h posttransfection. Different siRNA against Lamp2a were tested: Oligo N1, Oligo N2, Oligo N3, or a mix of N1 + N2 + N3. A scramble siRNA was used as a negative control. One representative out of three experiments is shown. (B) IFN-γ secretion by the NY-ESO-1157–170–specific HLA-DP4–restricted CD4+ T cell clone after coculture with M6 melanoma cells transfected with an siRNA specific for Lamp2A (Oligo N1) or with a control siRNA (Ctl SiRNA). Cocultures were performed 48 h after siRNA transfection at the indicated E:T ratios. The data represent one of four independent experiments. (C) IFN-γ secretion by the NY-ESO-1157–170–specific HLA-DP4–restricted CD4+ T cell clone after coculture with M6 melanoma cells transfected with Lamp2A, Lamp2B, or a control plasmid at the indicated E:T ratios. The data represent the mean of three independent experiments. Left panel, y-axis represents INF-γ secretion in picograms per milliliter. Right panel, y-axis represents the relative percentage of IFN-γ secretion reported to the maximal secretion of IFN-γ of the CD4+ T cell clone, pulsed with the cognate peptide only (10 μg/ml) and set to 100%. (D) IFN-γ secretion by the NY-ESO-1157–170–specific HLA-DP4–restricted CD4+ T cell clone after coculture with M6 melanoma cells transfected with a plasmid encoding for the chaperone-mediated autophagy substrate KFERQ-GFP or for the GFP only. Cocultures were performed at the indicated E:T ratios. One representative of two experiments is shown. Left panel, y-axis represents INF-γ secretion in picograms per milliliter. Right panel, y-axis represents the relative percentage of IFN-γ secretion reported to the maximal secretion of IFN-γ of the CD4+ T cell clone, pulsed with the cognate peptide only (10 μg/ml) and set to 100%.
FIGURE 4.
FIGURE 4.
NY-ESO-1 Ag is presented on MHC class II molecules of melanoma cells after intercellular Ag transfer. (A) The melanoma cell line M6 was cocultured for 2 h with the indicated stoichiometric ratios of FITC-coupled beads. Bead uptake was evaluated by flow cytometry. One representative of two experiments is shown. (B) IFN-γ secretion by the NY-ESO-1157–170–specific HLA-DP4–restricted CD4+ T cell clone after coculture with M199 cells pulsed for 24 h: with MHC class II–negative A549 necrotic cells transfected with NY-ESO-1 (A549-NY cells), with 5× concentrated supernatant from the corresponding A549 cells transfected with NY-ESO-1 (A549-NY SN), or with 5× concentrated supernatant from M6 melanoma cells endogenously expressing NY-ESO-1 (M6 SN). Data represent the mean of two independent experiments. (C) IFN-γ secretion by the NY-ESO-1157–170–specific HLA-DP4–restricted CD4+ T cell clone after coculture with M29 melanoma cell line pulsed with A549 necrotic cells transfected with a control plasmid or NY-ESO-1 plasmid. One representative of two experiments is shown. (D) IFN-γ secretion by the NY-ESO-1157–170–specific HLA-DP4–restricted CD4+ T cell clone, after coculture with M6 melanoma cell line transfected with the dominant-negative (DN) Rab7 T22N or with the wild-type (WT) Rab7, at the indicated E:T cell ratios. One representative of two experiments is shown. *p < 0.05.
FIGURE 5.
FIGURE 5.
MHC class II presentation of NY-ESO-1 can be enhanced by targeting to autophagosomes. (A) Western blot analysis of NY-ESO-1 expression in M199 cells, 24 h after transfection with the wild-type NY-ESO-1 or with the autophagosome-targeted NY-ESO-1–LC3 fusion protein. (B) NY-ESO-1157–170–specific recognition of M199 melanoma cells transfected with autophagosome-targeted (NY-ESO-1-LC3) or wild-type (NY-ESO-1) Ag at the indicated E:T cell ratios. One representative experiment out of three is shown. Statistical analysis was performed using an unpaired nonparametric t test.

Similar articles

Cited by

References

    1. Caballero O. L., Chen Y. T. 2009. Cancer/testis (CT) antigens: potential targets for immunotherapy. Cancer Sci. 100: 2014–2021. - PMC - PubMed
    1. Mandic M., Castelli F., Janjic B., Almunia C., Andrade P., Gillet D., Brusic V., Kirkwood J. M., Maillere B., Zarour H. M. 2005. One NY-ESO-1-derived epitope that promiscuously binds to multiple HLA-DR and HLA-DP4 molecules and stimulates autologous CD4+ T cells from patients with NY-ESO-1-expressing melanoma. J. Immunol. 174: 1751–1759. - PubMed
    1. Gnjatic S., Atanackovic D., Jäger E., Matsuo M., Selvakumar A., Altorki N. K., Maki R. G., Dupont B., Ritter G., Chen Y. T., et al. 2003. Survey of naturally occurring CD4+ T cell responses against NY-ESO-1 in cancer patients: correlation with antibody responses. Proc. Natl. Acad. Sci. USA 100: 8862–8867. - PMC - PubMed
    1. Cho H. J., Caballero O. L., Gnjatic S., Andrade V. C., Colleoni G. W., Vettore A. L., Outtz H. H., Fortunato S., Altorki N., Ferrera C. A., et al. 2006. Physical interaction of two cancer-testis antigens, MAGE-C1 (CT7) and NY-ESO-1 (CT6). Cancer Immun. 6: 12. - PubMed
    1. Heller K. N., Gurer C., Münz C. 2006. Virus-specific CD4+ T cells: ready for direct attack. J. Exp. Med. 203: 805–808. - PMC - PubMed

Publication types

MeSH terms