. 2016 Jan 8;44(1):245-55.
doi: 10.1093/nar/gkv1292. Epub 2015 Nov 24.

The 3D folding of metazoan genomes correlates with the association of similar repetitive elements

Affiliations

The 3D folding of metazoan genomes correlates with the association of similar repetitive elements

Axel Cournac et al. Nucleic Acids Res. .

Abstract

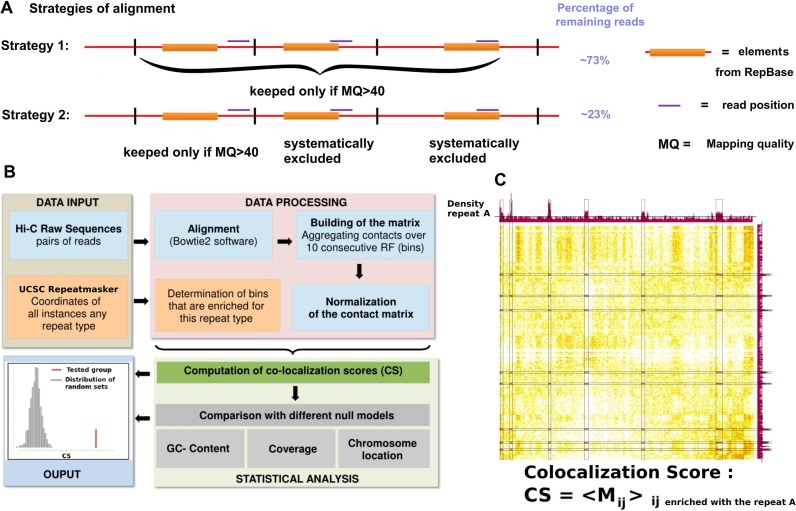
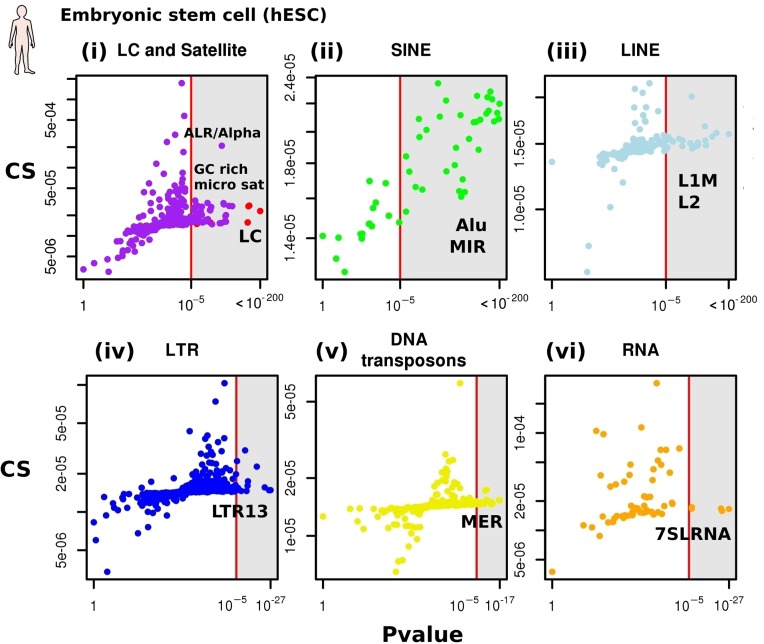
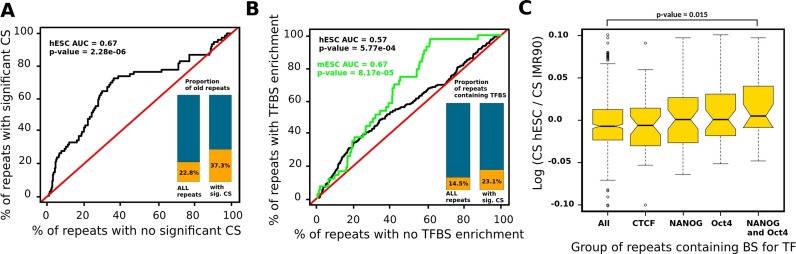
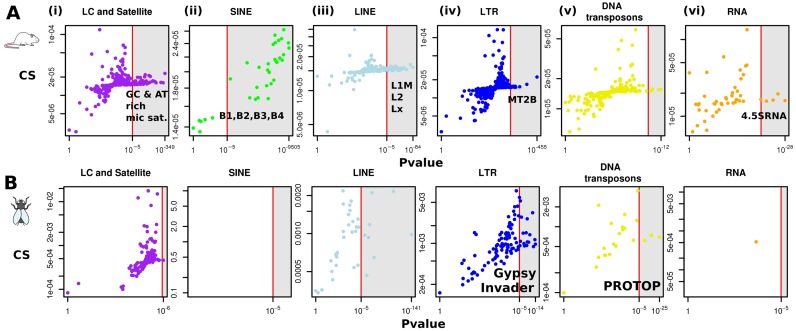
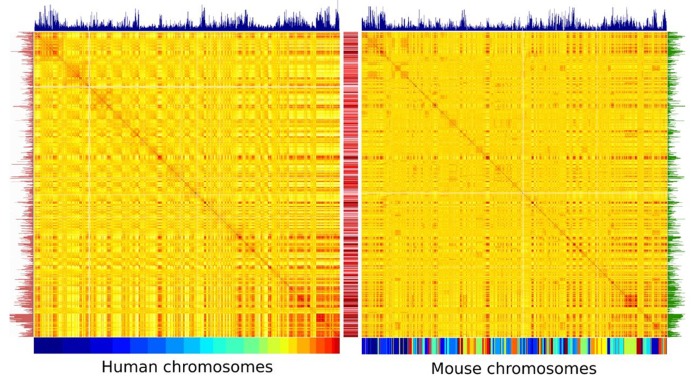
The potential roles of the numerous repetitive elements found in the genomes of multi-cellular organisms remain speculative. Several studies have suggested a role in stabilizing specific 3D genomic contacts. To test this hypothesis, we exploited inter-chromosomal contacts frequencies obtained from Hi-C experiments and show that the folding of the human, mouse and Drosophila genomes is associated with a significant co-localization of several specific repetitive elements, notably many elements of the SINE family. These repeats tend to be the oldest ones and are enriched in transcription factor binding sites. We propose that the co-localization of these repetitive elements may explain the global conservation of genome folding observed between homologous regions of the human and mouse genome. Taken together, these results support a contribution of specific repetitive elements in maintaining and/or reshaping genome architecture over evolutionary times.


Figures

Figure 1.
Figure 1.
(Color online) Most important steps of the pipeline to detect repetitive elements presenting a significant 3D co-localization score (CS). (A) Illustration of the two different strategies of alignment used for the present analysis. The first strategy consists in keeping all mappings with a Mapping Quality above a certain threshold. The second strategy is much more stringent and keeps only reads that do not overlap any sequences referenced in the RepeatMasker track of UCSC. (B) Flow-chart describing the main steps of our analysis. (C) Illustration of the CS computation: alongside the matrix of Hi-C contacts between human chromosomes 1 and 2 is aligned the repeat density profile. The black lines on the repeats density profiles represent the threshold above which the bin is considered as enriched with the repeat. The CS is then the average of all matrix elements Mij for which bins i and j are enriched with the repeat. These elements are highlighted in purple on the contacts map.
Figure 2.
Figure 2.
(Color online) CS of repetitive elements in human Embryonic Stem Cells. CS and P-values for all repetitive elements for the human embryonic stem cell. For each class of repeat (i–vi), the CSs and the P-value of all repeat sub-families are plotted. (i) Red dots: low complexity sequences (LC). Purple dots: satellite repeats. (ii) Green dots: SINEs (SINE older than 25MY are colored in dark green). (iii) Cyan dots: LINEs. (iv) Blue dots: LTR. (v) Yellow dots: DNA transposons (vi) Orange dots: RNA repeats.
Figure 3.
Figure 3.
(Color online) Evolutionary age and enrichment for TFBS of the co-localizating repetitive elements. (A) Receiver operating characteristic curve showing that the age of repetitive elements associated with significant CS is higher than that of repetitive elements not associated with significant CS. Black line represents the null condition that the age of the two sets of repetitive elements were distributed similarly. The bar plots represent the proportions of repeat elements older than 25 MYA for all repeats and for a subset of repeats with significant CS. The proportion is higher for the group of repeats with significant CS (Fisher test, P-value = 0.00043). (B) Receiver operating characteristic curve showing that the CS associated with repetitive elements enriched with TFBS is higher than that of repetitive elements not associated with enrichment for TFBS. Black line represents the null condition that the CS of the two sets of repetitive elements were distributed similarly. Red line corresponds to hESC cells and green line to mESC. The bar plots represent the proportions of repeat elements enriched with TFBS for all repeats and for repeats with significant CS. The proportion is higher for the group of repeats with significant CS (Fisher test, P-value = 0.012). (C) Distribution of the log ratios between the CS for all the repeats between two cell types (hESC and IMR90). We considered either all the repeats or only a subset of repeats bound by three TFs (CTCF, NANOG, OCT4 or both NANOG and OCT4).
Figure 4.
Figure 4.
(Color online) CS of all the different repetitive elements in mouse and Drosophila. (A) CS and corresponding P-values (constant Hi-C coverage null model) of repetitive elements in mouse ESC (25). (B) in Drosophila embryo (26).
Figure 5.
Figure 5.
(Color online) Correlation matrices of the inter-chromosomal contacts in human and mouse re-ordered according to syntenic regions. Correlation matrices obtained from whole inter-chromosomal contact of human (Left) and mouse autosome chromosomes (Right). For the human genome, the 22 chromosomes are shown using the color code below the matrix. For the mouse genome, the chromosomes are reordered as a function of their synteny conservation with human as illustrated by the resulting mosaic color code. The two color maps show the correlation in contact frequencies strength between distant parts of the genome, with high and low level of contacts in red and yellow, respectively. The color scale in the middle corresponds to the Pearson coefficient between two lines of each matrix. MIR densities in each species are indicated by the blue bar plot atop of the matrices. Genomic densities of two other SINEs with high CSs, either primate (Alu) or rodent specific (B1) were also plotted (red and green bar plots, on the left and on the right, respectively).

References

    1. De Koning A.P.J., Gu W., Castoe T.A., Batzer M.A., Pollock D.D. Repetitive elements may comprise over two-thirds of the human genome. PLoS Genet. 2011;7:e1002384. - PMC - PubMed
    1. McClintock B. The significance of responses of the genome to challenge. Science. 1984;226:792–801. - PubMed
    1. Ohno S. So much ‘junk’ DNA in our genome. Brookhaven Symp. Biol. 1972;23:366–370. - PubMed
    1. Orgel L.E., Crick F.H., Sapienza C. Selfish DNA. Nature. 1980;288:645–646. - PubMed
    1. Arkhipova I.R., Batzer M.A., Brosius J., Feschotte CÈ., Moran J.V., Schmitz J., Jurka J. Genomic impact of eukaryotic transposable elements. Mob. DNA. 2012;3:19. - PMC - PubMed

Publication types

Substances

LinkOut - more resources