Comparative Study
. 2015 Nov 25;35(47):15666-81.
doi: 10.1523/JNEUROSCI.2172-15.2015.

A Smaug2-Based Translational Repression Complex Determines the Balance between Precursor Maintenance versus Differentiation during Mammalian Neurogenesis

Affiliations
Comparative Study

A Smaug2-Based Translational Repression Complex Determines the Balance between Precursor Maintenance versus Differentiation during Mammalian Neurogenesis

Gianluca Amadei et al. J Neurosci. .

Abstract

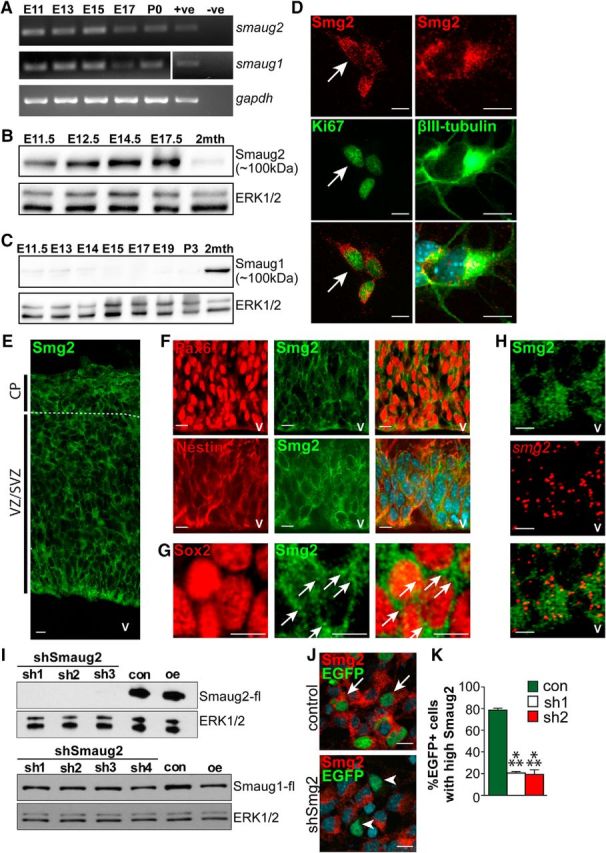
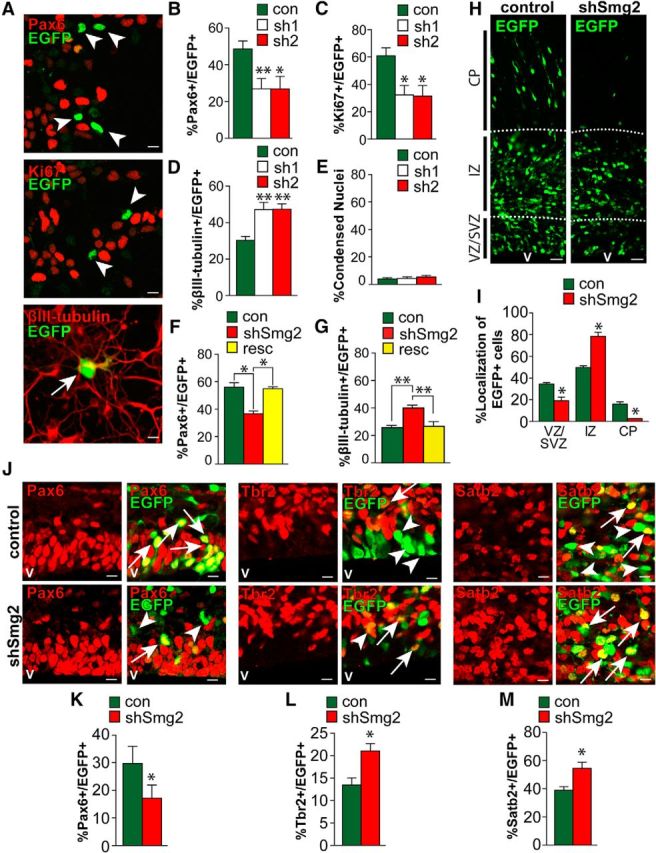
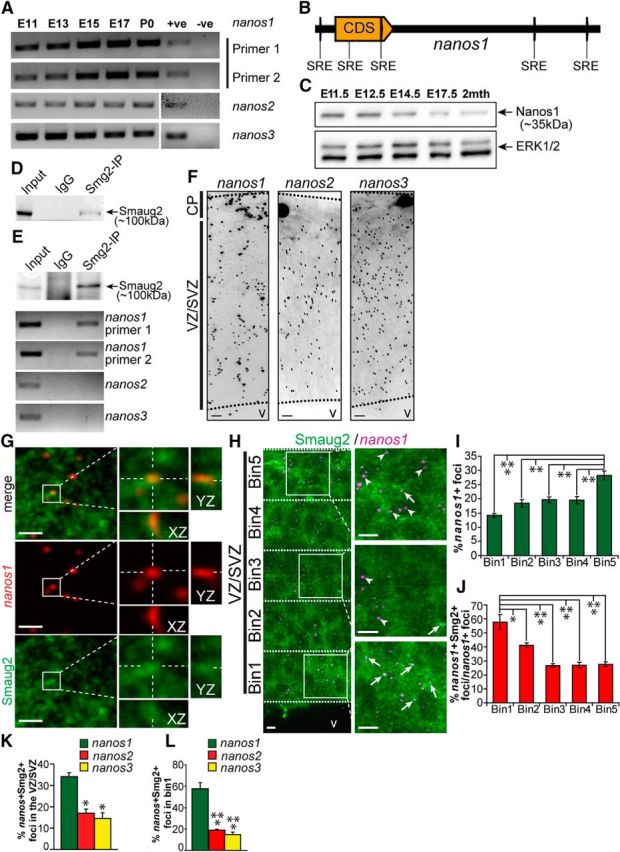
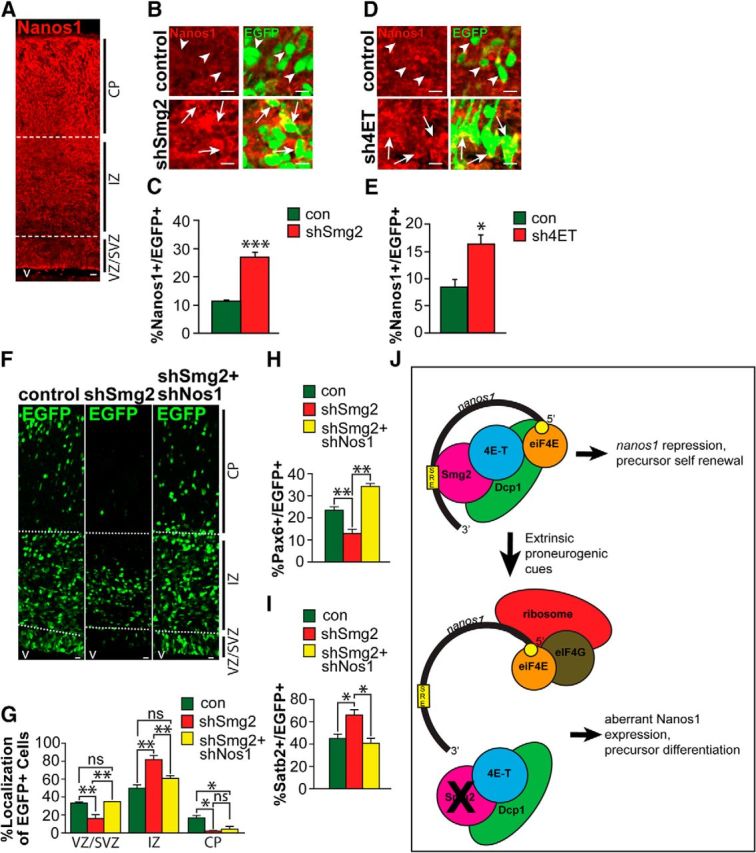
Here, we have asked about post-transcriptional mechanisms regulating murine developmental neurogenesis, focusing upon the RNA-binding proteins Smaug2 and Nanos1. We identify, in embryonic neural precursors of the murine cortex, a Smaug2 protein/nanos1 mRNA complex that is present in cytoplasmic granules with the translational repression proteins Dcp1 and 4E-T. We show that Smaug2 inhibits and Nanos1 promotes neurogenesis, with Smaug2 knockdown enhancing neurogenesis and depleting precursors, and Nanos1 knockdown inhibiting neurogenesis and maintaining precursors. Moreover, we show that Smaug2 likely regulates neurogenesis by silencing nanos1 mRNA. Specifically, Smaug2 knockdown inappropriately increases Nanos1 protein, and the Smaug2 knockdown-mediated neurogenesis is rescued by preventing this increase. Thus, Smaug2 and Nanos1 function as a bimodal translational repression switch to control neurogenesis, with Smaug2 acting in transcriptionally primed precursors to silence mRNAs important for neurogenesis, including nanos1 mRNA, and Nanos1 acting during the transition to neurons to repress the precursor state.

Significance statement: The mechanisms instructing neural stem cells to generate the appropriate progeny are still poorly understood. Here, we show that the RNA-binding proteins Smaug2 and Nanos1 are critical regulators of this balance and provide evidence supporting the idea that neural precursors are transcriptionally primed to generate neurons but translational regulation maintains these precursors in a stem cell state until the appropriate developmental time.

Keywords: Smaug2; nanos1; neurogenesis; radial precursor development; stem cells; translational repression.


Conflict of interest statement

The authors declare no competing financial interests.

Figures

Figure 1.
Figure 1.
Smaug2, but not Smaug1, protein is expressed in apical precursors and newborn neurons during embryonic cortical neurogenesis. A, RT-PCR for smaug1 and smaug2 mRNAs in the developing murine cortex from embryonic days 11 to 17 (E11–E17) and at birth (P0). gapdh mRNA expression was monitored as a control. +ve, Sample with known expression of target mRNA and used as a positive control for the reaction; -ve, sample generated in the absence of reverse transcriptase. B, C, Western blots for Smaug2 (B) and Smaug1 (C) in E11.5 to 2-month-old (2mth) cortices. Blots were reprobed for ERK1/2 as a loading control. D, Images of cortical precursors isolated at E12.5, cultured for 3 d and immunostained for Smaug2 (red) and the proliferation marker Ki67 or the early neuronal marker βIII-tubulin (both green). Arrows indicate a double-labeled cell. Scale bar, 10 μm. E, Confocal image of a coronal E12.5 cortical section immunostained for Smaug2 (green). Boundaries of the VZ/SVZ and CP are denoted. v, Ventricle. Scale bar, 10 μm. F, G, Confocal images of the E12.5 cortical VZ/SVZ immunostained for Smaug2 (green) and the radial precursor marker Pax6 (F, red) or the neural precursor markers nestin (F, red) or Sox2 (G, red) at higher magnification. F, Bottom, Counterstained with Hoechst to highlight nuclei. Arrows highlight Smaug2-positive granules. Scale bars: F, 10 μm; G, 5 μm. H, Confocal images of the E12.5 cortical VZ immunostained for Smaug2 (green) and subjected to FISH for smaug2 mRNA (red). Bottom, Merge. v, Ventricle. Scale bar, 10 μm. I, Western blot analysis with anti-FLAG of HEK-293T cell lysates cotransfected with FLAG-tagged mouse Smaug2 or Smaug1 expression constructs and a control shRNA (con) or one of four different Smaug2 shRNAs (sh1, sh2, sh3, and sh4). Cells were transfected with the expression construct alone as a positive control (oe). Blots were reprobed with ERK1/2. J, Images of cultured precursors cotransfected with a nuclear EGFP construct and a control shRNA (top) or Smaug2 shRNA #2 (bottom, shSmg2), and immunostained 3 d later for Smaug2 (red) and EGFP (green). Arrows and arrowheads indicate EGFP-positive, Smaug2 positive cells and EGFP-positive, Smaug2-negative cells, respectively. Scale bar, 10 μm. K, Quantification of transfected precursors as shown in J transfected with Smaug2 shRNA1 or shRNA2 (sh1 or sh2) and analyzed for their relative levels of immunodetectable Smaug2. ***p < 0.001. n = 3 experiments. K, Statistics were performed with ANOVA and Tukey's post hoc multiple comparisons test. Error bars indicate SEM.
Figure 2.
Figure 2.
Smaug2 knockdown in culture and in vivo increases neurogenesis and depletes cycling precursors. A–E, Cultured cortical precursors were cotransfected with a nuclear EGFP construct and a control shRNA (con) or one of two Smaug2 shRNAs (sh1 and sh2), and analyzed by immunostaining 3 d later. A, Images of precursors transfected with Smaug2 shRNA #1 and immunostained for EGFP (green) and Pax6, Ki67, or βIII-tubulin (all red). Arrows and arrowheads indicate EGFP-positive, marker-positive cells and EGFP-positive, marker-negative cells, respectively. Scale bar, 10 μm. B–D, Quantification of cultures as in A for the percentage of EGFP-positive cells expressing Pax6 (B), Ki67 (C), or βIII-tubulin (D). *p < 0.05. **p < 0.01. n = 3 experiments. E, Quantification of condensed nuclei to assess cell death in cultures as in A. F, G, Cultured precursors were cotransfected with a nuclear EGFP construct and a control shRNA (con) or Smaug2 shRNA #2 (shSmg2) with or without an expression vector encoding an shRNA-resistant human Smaug2 (resc). Three days later, cultures were immunostained and quantified for the percentage of EGFP-positive cells expressing Pax6 (F) or βIII-tubulin (G). *p < 0.05. **p < 0.01. n = 3 experiments. H–M, E13/E14 murine cortices were coelectroporated with a nuclear EGFP construct together with control (con) or Smaug2 shRNA #2 (shSmg2), and coronal sections were analyzed 3 d later at E16/E17. H, Confocal images of electroporated cortices immunostained for EGFP (green). v, Ventricle. Scale bar, 30 μm. I, Quantification of sections as in H for the percentage of EGFP-positive cells located in the different cortical regions. *p < 0.05. n = 3 embryos each, at least 3 sections per embryo. J, Confocal images of the VZ/SVZ of electroporated sections immunostained for EGFP (green) and Pax6, the intermediate progenitor marker Tbr2, or the neuronal marker Satb2 (all red). Arrows indicate double-labeled cells. Arrowheads indicate EGFP-positive, marker-negative cells. Scale bar, 10 μm. K–M, Quantification of sections as in J for the percentage of EGFP-positive cells expressing Pax6 (K), Tbr2 (L), or Satb2 (M). *p < 0.05. n = 3 embryos each, at least 3 sections per embryo. B–G, Statistics were performed with ANOVA and Tukey's post hoc multiple comparisons test. I–M, Statistics were performed with Student's t test. Error bars indicate SEM.
Figure 3.
Figure 3.
Smaug2 overexpression in vitro and in vivo is sufficient to enhance cortical precursor self-renewal. A–C, Cultured E12.5 precursors were cotransfected with a nuclear EGFP construct and control (con) or murine Smaug2 (Smg2-OE) expression vectors, and analyzed by immunostaining 3 d later. A, Images of transfected precursors immunostained for EGFP (green) and Ki67 or βIII-tubulin (both red). Arrows and arrowheads indicate EGFP-positive, marker-positive cells and EGFP-positive, marker-negative cells, respectively. Scale bar, 10 μm. B, C, Quantification of cultures as in A for the percentage of EGFP-positive cells expressing Ki67 (B) or βIII-tubulin (C). **p < 0.01. n = 3 experiments. D, Cortical precursor cultures were cotransfected with the piggybac EGFP labeling system plus control (con) or murine Smaug2 (Smg-OE) expression vectors. Cultures were immunostained for EGFP 3 d later and clone size was scored. *p < 0.05. n = 3 experiments. E–J, E13/E14 murine cortices were coelectroporated with a nuclear EGFP construct and control (con) or mouse Smaug2 (Smg2-OE) expression vectors and coronal cortical sections were analyzed 3 d later at E16/E17. E, Confocal images of electroporated sections immunostained for EGFP (green). v, Ventricle. Scale bar, 30 μm. F, Quantification of sections similar to those in E for the percentage of EGFP-positive cells located in the different cortical regions. *p < 0.05. ns, Nonsignificant. n = 3 embryos each, at least 3 sections per embryo. G, Confocal images of the VZ/SVZ (two top rows) or CP (bottom row) of electroporated sections immunostained for EGFP (green) and Pax6, Tbr2, or Satb2 (all red). Arrows indicate double-labeled cells. Arrowheads indicate EGFP-positive, marker-negative cells. v, Ventricle. Scale bar, 10 μm. H–J, Quantification of sections as in G for the percentage of EGFP-positive cells that were positive for Pax6 (H), Tbr2 (I), or Satb2 (J). *p < 0.05. **p < 0.01. ***p < 0.001. n = 3 embryos each, at least 3 sections per embryo. Statistics were performed with Student's t test. Error bars indicate SEM.
Figure 4.
Figure 4.
nanos1 mRNA is a Smaug2 target in embryonic cortical precursors. A, RT-PCR for nanos1, nanos2, and nanos3 mRNAs in murine cortices from E11 to birth (P0). nanos1 mRNA expression was detected using two different primer sets. PCR products were sequenced to confirm specificity. +ve, Sample with known expression of target mRNA and used as a positive control for the reaction; -ve, sample generated in the absence of reverse transcriptase. B, Schematic of SREs in the nanos1 mRNA transcript. Yellow arrow labeled CDS represents the protein-coding region. C, Western blot analysis for Nanos1 in E11.5 to 2-month-old cortices. The blot was reprobed for ERK1/2 as a loading control. D, Western blot of HEK-293T cells transfected with a Flag-tagged mouse Smaug2 construct and immunoprecipitated with anti-Smaug2 or with control nonspecific rabbit IgG, probed with antibodies for Smaug2. As a control, 10% of the input homogenate was loaded. E, Western blot (top) of E12.5 cortical lysates immunoprecipitated with the same Smaug2 antibody as in D or with control, nonspecific rabbit IgG and probed with anti-Smaug2. As a positive control, 10% of the input homogenate was loaded. Similar immunoprecipitates were generated in parallel, mRNA was extracted, and the samples were analyzed for nanos1, nanos2, and nanos3 mRNAs using RT-PCR (second to bottom panels). F, Confocal images of FISH for nanos1 (left), nanos2 (center), and nanos3 (right) mRNAs (black granules) in coronal sections of the E12.5 cortex. v, Ventricle. Scale bar, 10 μm. G, Higher-magnification confocal images of the VZ/SVZ of an E13.5 cortical section showing FISH for nanos1 mRNA (red) and immunostaining for Smaug2 (green). Top, Merge. Boxed regions are shown at higher magnification in the right panels, which also show colocalization of Smaug2 and nanos1 mRNA on the z-axis (XZ and YZ), as indicated by the hatched white lines. Scale bar, 10 μm. H, Confocal images of the E12.5 cortex showing FISH for nanos1 mRNA (magenta) and immunostaining for Smaug2 (green). The VZ/SVZ is divided into five bins of identical width, as denoted by the hatched white lines, and boxed regions within some of these bins are shown at higher magnification in the right panels. Arrows indicate foci with colocalized nanos1 mRNA and Smaug2. Arrowheads indicate foci with only nanos1 mRNA. v, Ventricle. Scale bar, 10 μm. I, J, Quantification of sections similar to that shown in H for the distribution of total nanos1 mRNA-positive foci (I) and the relative proportion of nanos1 mRNA-positive foci that colocalize with Smaug2 in each bin (J). *p < 0.05. **p < 0.01. ***p < 0.001. n = 3. K, L, Quantification of sections similar to those shown in H for the proportion of nanos1, nanos2, or nanos3 mRNA foci that colocalize with Smaug2 across the entire E12.5 VZ/SVZ (K) or only in Bin1 (L), the apical-most region of the VZ. *p < 0.05. ***p < 0.001. n = 3. Statistics were performed with ANOVA and Tukey's post hoc multiple comparisons test. Error bars indicate SEM.
Figure 5.
Figure 5.
Nanos1 is necessary and sufficient to promote neurogenesis in vivo. A, Western blots of HEK-293T cell lysates cotransfected with murine Nanos1 or Flag-tagged murine Nanos2 or Nanos3 expression constructs and a control shRNA (Con) or a Nanos1 shRNA (shNos1) and probed with anti-Nanos1 or anti-Flag, as indicated. The blots were reprobed with ERK1/2 as a loading control. B–H, E13/E14 murine cortices were coelectroporated with a nuclear EGFP construct, and either a control (con) or Nanos1 shRNA (shNos1) and coronal sections were analyzed 3 d later at E16/E17. B, Images of electroporated sections immunostained for EGFP (green). v, Ventricle. Scale bar, 10 μm. C, Quantification of sections similar to those in B for the percentage of EGFP-positive cells located in the different cortical regions. **p < 0.01. n = 3 embryos each, at least 3 sections per embryo. D, Confocal micrographs of the VZ/SVZ (three top rows) or CP (bottom row) of electroporated sections immunostained for EGFP (green) and Pax6, Ki67, Tbr2, or Satb2 (all red). Arrows indicate double-labeled cells. v, Ventricle. Scale bar, 10 μm. E–H, Quantification of sections similar to those in D for the percentage of EGFP-positive cells that expressed Pax6 (E), Ki67 (F), Tbr2 (G), or Satb2 (H). **p < 0.01. ***p < 0.001. n = 3 embryos each, at least 3 sections per embryo. I–K, E13/E14 cortices were coelectroporated with a nuclear EGFP construct and a control (con) or Nanos1 shRNA (shNos1) ± an shRNA-resistant human Nanos1 expression vector (resc) and coronal sections were analyzed 3 d later at E16/E17. I, Images of electroporated sections immunostained for EGFP (green). v, Ventricle. Scale bar, 10 μm. J, K, Sections similar to those in I were immunostained for EGFP and Pax6 or Satb2 and the proportion of EGFP-positive cells that were also positive for the marker was quantified. **p < 0.01. ***p < 0.001. n = 3 embryos each, at least 3 sections per embryo. L–R, E13/E14 cortices were coelectroporated with a nuclear EGFP construct and either a control (con) or murine Nanos1 (Nos1-OE) expression vector, and coronal sections were analyzed 3 d later at E16/E17. L, Images of electroporated sections immunostained for EGFP (green). v, Ventricle. Scale bar, 10 μm. M, Quantification of sections as in L for the percentage of EGFP-positive cells located in the different cortical regions. *p < 0.05. ns, Nonsignificant. n = 3 embryos each, at least 3 sections per embryo. N, Confocal images of the VZ/SVZ (top three rows) or CP (bottom row) of electroporated sections similar to those in L immunostained for EGFP (green) and Pax6, Ki67, Tbr2, or Satb2 (all red). Arrows indicate double-labeled cells. Arrowheads indicate EGFP-positive, marker-negative cells. v, Ventricle. Scale bar, 10 μm. O–R, Quantification of sections as in N for the percentage of EGFP-positive cells that were also positive for Pax6 (O), Ki67 (P), Tbr2 (Q), or Satb2 (R). *p < 0.05. **p < 0.01. ***p < 0.001. n = 3 embryos each, at least 3 sections per embryo. J, K, Statistics were performed with ANOVA and Tukey's post hoc multiple comparisons test. All other panels, Statistics were performed with Student's t test. Error bars indicate SEM.
Figure 6.
Figure 6.
Smaug2 and nanos1 mRNA are associated with 4E-T in a P-Body-like granule in Pax6-positive apical precursors. A, Western blot analysis for Smaug2 (Smg2) and 4E-T in lysates of E12.5 cortical precursors cultured for 3 d and immunoprecipitated with anti-Smaug2 or with control, nonspecific rabbit IgG. As a positive control, 10% of the input homogenate was loaded. B, Western blot analysis for Smaug2 and 4E-T in lysates of E12.5 cortical precursors cultured for 3 d and immunoprecipitated with anti-4E-T or with control, nonspecific mouse IgG. As a positive control, 10% of the input homogenate was loaded. C, Confocal images of E12.5 cortical precursors cultured for 3 d and immunostained for Smaug2 (green) and 4E-T (magenta). Cultures were also counterstained with Hoechst (blue). Top, Boxed areas are shown at higher magnification in the bottom panels. Arrows indicate granules that are positive for both Smaug2 and 4E-T. Scale bar, 5 μm. D, Confocal images of E12.5 3 d cortical precursor cultures after the PLA with Smaug2 and 4E-T antibodies. Cultures were also counterstained with Hoechst (blue). Left, Boxed areas are shown at higher magnification to the right. Scale bar, 10 μm. E, Confocal images of E12.5 cortical precursors cultured for 3 d and immunostained for Smaug2 (red) and Dcp1 (green). Cultures were also counterstained with Hoechst (blue). Top, Boxed areas are shown at higher magnification in the bottom panels. Arrows indicate granules that are double labeled for Smaug2 and Dcp1. Scale bar, 10 μm. F, Confocal images of cortical precursor cultures after PLA with Smaug2 and Dcp1 antibodies. Cultures were also counterstained with Hoechst (blue). Left, Boxed areas are shown at higher magnification on the right. Scale bar, 10 μm. G, RT-PCR analysis for nanos1 mRNA in 4E-T immunoprecipitates (4E-T IP) from the E12.5 cortex. As a control, similar lysates were immunoprecipitated with a control, nonspecific mouse IgG (IgG). H, qRT-PCR analysis for nanos1 mRNA enrichment in multiple independent 4E-T immunoprecipitates from the E12.5 cortex, in comparison with control IgG immunoprecipitates. I, Confocal images of E12.5 cortical precursors cultured for 3 d and analyzed by FISH for nanos1 mRNA (red or magenta) and immunostaining for 4E-T or Smaug2 (both green). Cultures were also counterstained with Hoechst (blue). Arrows and arrowheads indicate nanos1 mRNA-positive foci that are or are not positive for the relevant protein, respectively. Scale bar, 5 μm. J, Quantification of cultures as in I for the percentage of total nanos1 mRNA-positive foci that also colocalized with Smaug2 (Smg2) or 4E-T alone, or with both together. *p < 0.05. **p < 0.01. ***p < 0.01. n = 3. K, Confocal images of the E12.5 cortical VZ immunostained with 4E-T (green) and subjected to FISH (magenta) with a nanos1 mRNA probe shown at low magnification (left) and high magnification (right). Cell nuclei were counterstained with Hoechst (blue). Bottom, Merge. Left, Boxed regions are shown at high magnification to the right. Arrows indicate foci positive for both nanos1 mRNA and 4E-T. Arrowheads indicate nanos1 mRNA foci that are negative for 4E-T. v, Ventricle. Scale bar, 10 μm. L, Quantification of sections similar to that shown in K for the relative proportion of nanos1 mRNA-positive foci that colocalized with 4E-T in each bin of the VZ/SVZ, as defined in Figure 4H. **p < 0.01. n = 3. M, N, Quantification of sections similar to those shown in K for the proportion of nanos1, nanos2, or nanos3 mRNA foci that colocalized with Smaug2 across the entire E12.5 VZ/SVZ (M) or only in Bin1 (N), the apical-most region of the VZ. *p < 0.05. n = 3. Statistics were performed with ANOVA and Tukey's post hoc multiple comparisons test. Error bars indicate SEM.
Figure 7.
Figure 7.
Knockdown of Smaug2 or 4E-T causes aberrant Nanos1 expression, and this is responsible for the Smaug2 knockdown-mediated increase in neurogenesis. A, Nanos1 immunoreactivity in a coronal section of the E16/E17 cortex. v, Ventricle. Scale bar, 10 μm. B, Confocal images of cells at the border of the SVZ and the IZ of E16/E17 murine cortices that were coelectroporated 3 d earlier with a nuclear EGFP construct and control (con) or Smaug2 (shSmg2) shRNAs. Sections were immunostained for EGFP (green) and Nanos1 (red). Arrows and arrowheads indicate EGFP-positive cells that do or do not express Nanos1, respectively. Scale bar, 10 μm. C, Quantification of the proportion of EGFP-positive cells expressing detectable Nanos1 in sections similar to those in B. ***p < 0.001. n = 3 embryos each, at least 3 sections per embryo. D, Confocal images of cells at the border of the SVZ and the IZ of E15/E16 murine cortices that were coelectroporated 2 d earlier with a nuclear EGFP construct and control (con) or 4E-T (sh4ET) shRNAs. Sections were immunostained for EGFP (green) and Nanos1 (red). Arrows and arrowheads indicate EGFP-positive cells that do or do not express Nanos1, respectively. Scale bar, 10 μm. E, Quantification of the proportion of EGFP-positive cells expressing detectable Nanos1 in sections similar to those in D. *p < 0.05. n = 3 embryos each, at least 3 sections per embryo. F–I, E13/E14 cortices were coelectroporated with a nuclear EGFP construct and control (con) or Smaug2 shRNA (shSmg2) ± Nanos1 shRNA (shNos1), and coronal cortical sections were analyzed 3 d later at E16/E17. F, Images of electroporated sections immunostained for EGFP (green). v, Ventricle. Scale bar, 10 μm. G, Quantification of sections similar to those in F for the percentage of EGFP-positive cells located in the different cortical regions. *p < 0.05. **p < 0.01. ns, Nonsignificant. n = 3 embryos each, at least 3 sections per embryo. H, I, Quantification of EGFP-positive, marker-positive cells in sections as in F immunostained for EGFP and either Pax6 (H) or Satb2 (I). *p < 0.05. **p < 0.01. n = 3 embryos each, at least 3 sections per embryo. J, Schematic showing the proposed repressive complex involving Smg2, 4E-T, Dcp1, and nanos1 mRNA (top). When the complex is disrupted, either by environmental signals or by knockdown of complex components such as Smaug2, this causes aberrant translation of Nanos1, thereby promoting neurogenesis (bottom). G–I, Statistics were performed with ANOVA and Tukey's post hoc multiple comparisons test. Other panels, Statistics were performed with Student's t test. Error bars indicate SEM.

References

    1. Aviv T, Lin Z, Lau S, Rendl LM, Sicheri F, Smibert CA. The RNA-binding SAM domain of Smaug defines a new family of post-transcriptional regulators. Nat Struct Biol. 2003;10:614–621. doi: 10.1038/nsb956. - DOI - PubMed
    1. Aviv T, Lin Z, Ben-Ari G, Smibert CA, Sicheri F. Sequence-specific recognition of RNA hairpins by the SAM domain of Vts1p. Nat Struct Mol Biol. 2006;13:168–176. doi: 10.1038/nsmb1053. - DOI - PubMed
    1. Baez MV, Boccaccio GL. Mammalian Smaug is a translational repressor that forms cytoplasmic foci similar to stress granules. J Biol Chem. 2005;280:43131–43140. doi: 10.1074/jbc.M508374200. - DOI - PubMed
    1. Baez MV, Luchelli L, Maschi D, Habif M, Pascual M, Thomas MG, Boccaccio GL. Smaug1 mRNA-silencing foci respond to NMDA and modulate synapse formation. J Cell Biol. 2011;195:1141–1157. doi: 10.1083/jcb.201108159. - DOI - PMC - PubMed
    1. Balagopal V, Parker R. Polysomes, P bodies and stress granules: states and fates of eukaryotic mRNAs. Curr Opin Cell Biol. 2009;21:403–408. doi: 10.1016/j.ceb.2009.03.005. - DOI - PMC - PubMed

Publication types