

doi: 10.1021/acs.nanolett.5b03331.
Epub 2015 Dec 2.
Electrophoretic Deformation of Individual Transfer RNA Molecules Reveals Their Identity
Affiliations
- PMID: 26609994
- PMCID: PMC4890568
- DOI: 10.1021/acs.nanolett.5b03331
Item in Clipboard
Electrophoretic Deformation of Individual Transfer RNA Molecules Reveals Their Identity
Nano Lett.
.
Abstract
It has been hypothesized that the ribosome gains additional fidelity during protein translation by probing structural differences in tRNA species. We measure the translocation kinetics of different tRNA species through ∼3 nm diameter synthetic nanopores. Each tRNA species varies in the time scale with which it is deformed from equilibrium, as in the translocation step of protein translation. Using machine-learning algorithms, we can differentiate among five tRNA species, analyze the ratios of tRNA binary mixtures, and distinguish tRNA isoacceptors.
Keywords: RNA; SVM; nanopores; single molecule; tRNA.
Figures
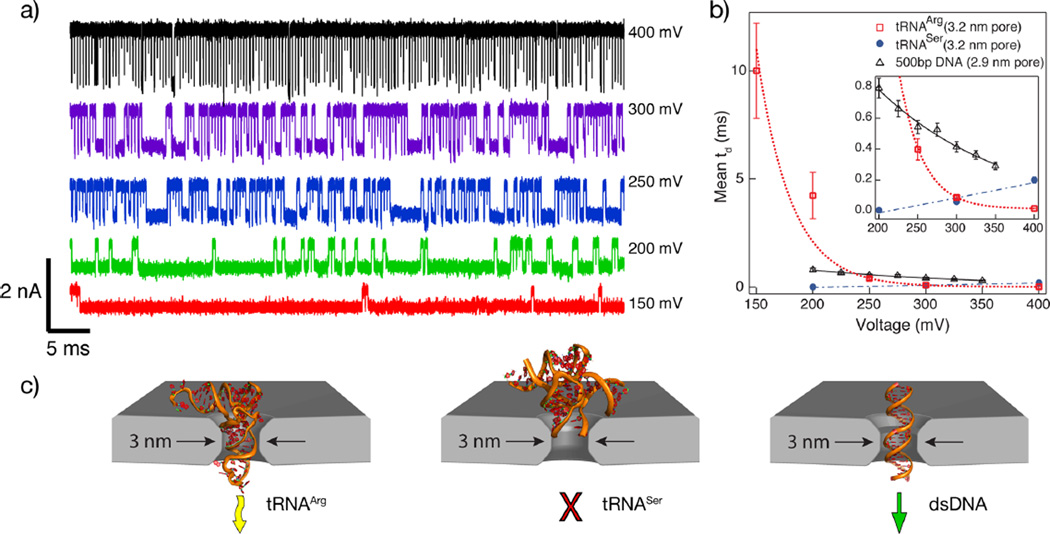
(a) Concatenated event traces for tRNAArg displaying events at the indicated voltages. Each event is shown with ~250 µs of data before and after the event. (b) Mean dwell times as a function of applied voltage for tRNAArg. Data for tRNASer and 500 bp DNA are included for comparison (see text). (c) Schematic showing the PDB cartoon structures of the three control molecules positioned inside a ~3 nm diameter pore (yellow arrow = translocation with unbending, red cross = no translocation, green arrow = unhindered translocation).
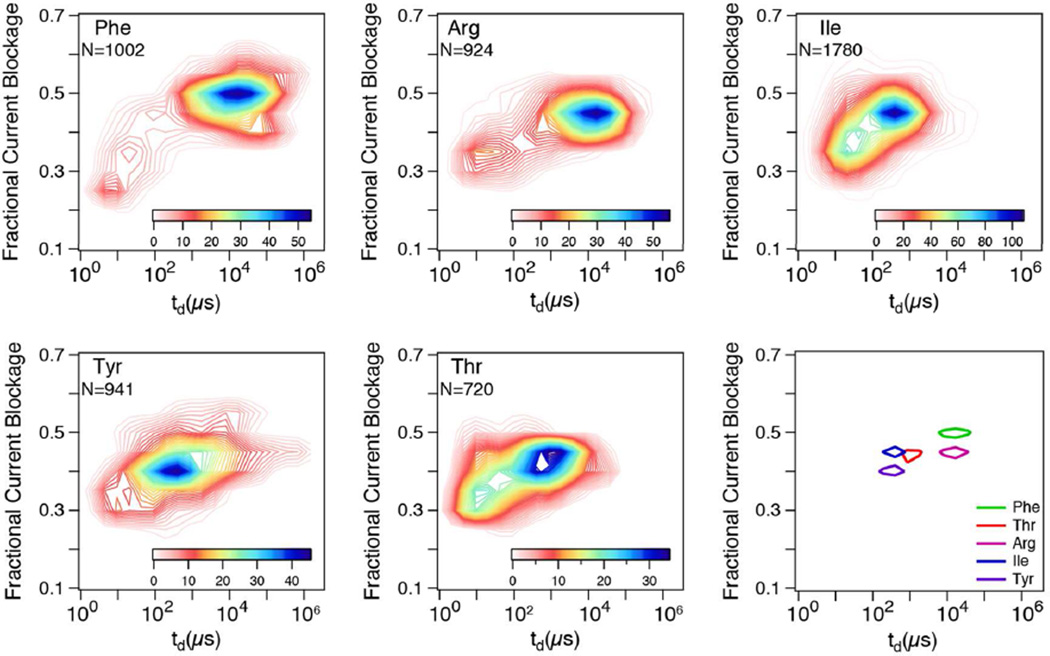
Contour plots depicting the distributions of fractional current blockage vs td for five tRNA samples electrophoresed through the same nanopore (~3 nm diameter, ~10 nm thickness) using an applied voltage of 200 mV. The final panel shows the locations of the contour peaks for each tRNA.
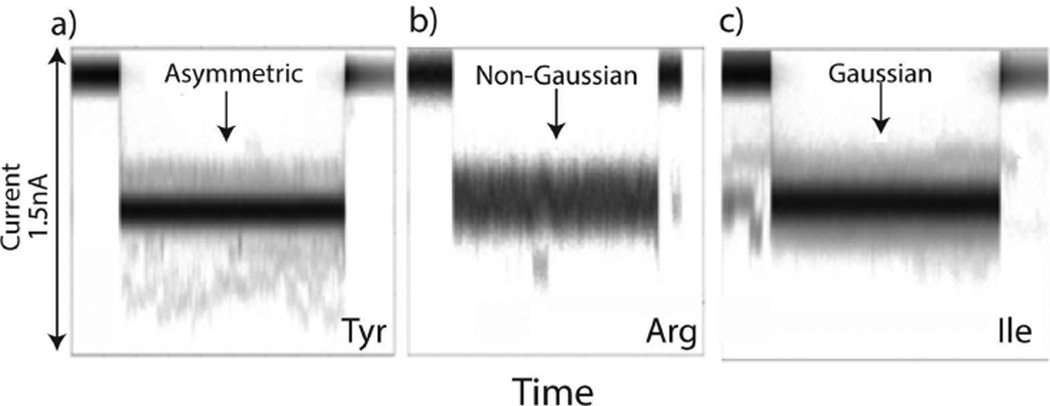
Noise characteristics for different tRNA species. Translocation events are overlaid (with up to 10% of time-rescaling to align the start and end of each event) and the gray scale density corresponds to the number of overlapping data points. (a) tRNATyr displaying asymmetric noise, n = 666, 〈td〉 = 0.5 ± 0.05 ms, (b) tRNAArg displaying non-Gaussian noise, n = 551, 〈td〉 = 5 ± 0.5 ms, (c) tRNAIle displaying Gaussian noise, n = 746, 〈td〉 = 0.7 ± 0.07 ms.
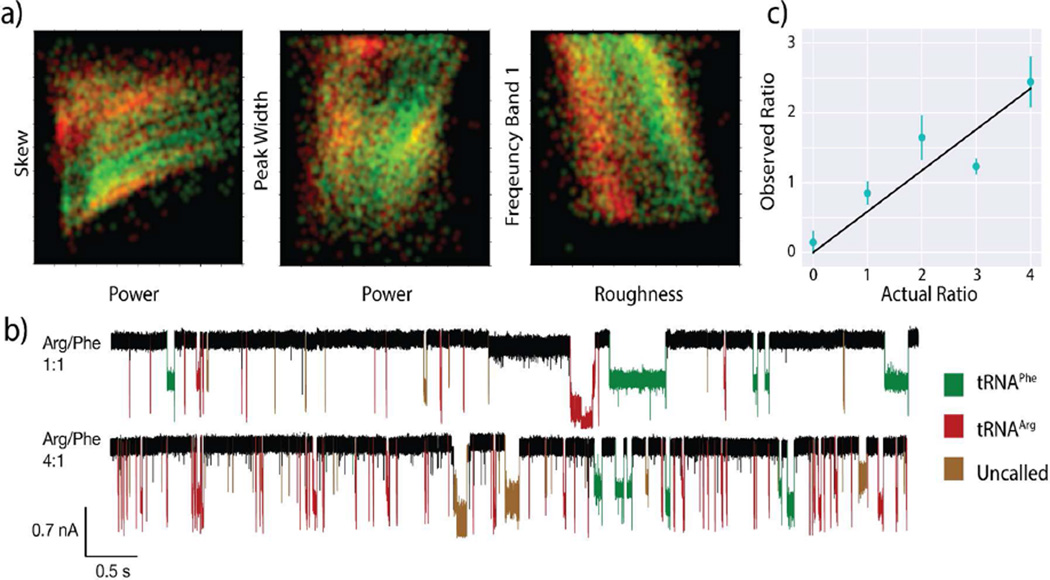
Detection of tRNA species in binary mixtures. (a) Several of the SVM signal features displayed in false-color 2D plots (see text and Table SI2). All units are normalized and shown from 0 to 1. tRNAPhe is shown in red, tRNAArg in green, and areas of overlap are shown in yellow. Signal feature definitions: skew (statistical skew of a peak), power (integrated area of event current), peak width (total time of event), frequency band 1 (noise spectrum between (0–208) kHz), roughness (standard deviation of current values within an event). (b) Current vs time traces for both the 1:1 and 4:1 tRNAArg/tRNAPhe mixtures. Events are colored according to SVM calling. The number of tRNAArg calls increases greatly with its relative concentration, whereas the number of tRNAPhe does not appreciably change. (c) Measured ratio of tRNAArg to tRNAPhe signals vs the known molar ratio in solution. The ratios do not show 1:1 correspondence due to differences in the capture efficiency for the two molecules, but the linear correlation shows that the identity of single molecule events can be assigned with reasonable accuracy. Error bars were assigned by dividing each data set into many different subsets. The subsets were divided by time within the experiment to identify sampling errors, and then again using a number of different feature sets. The comparison between all the different assigned ratios determines the classification error, and controls for the standard problems of over- and underfitting of the SVM.
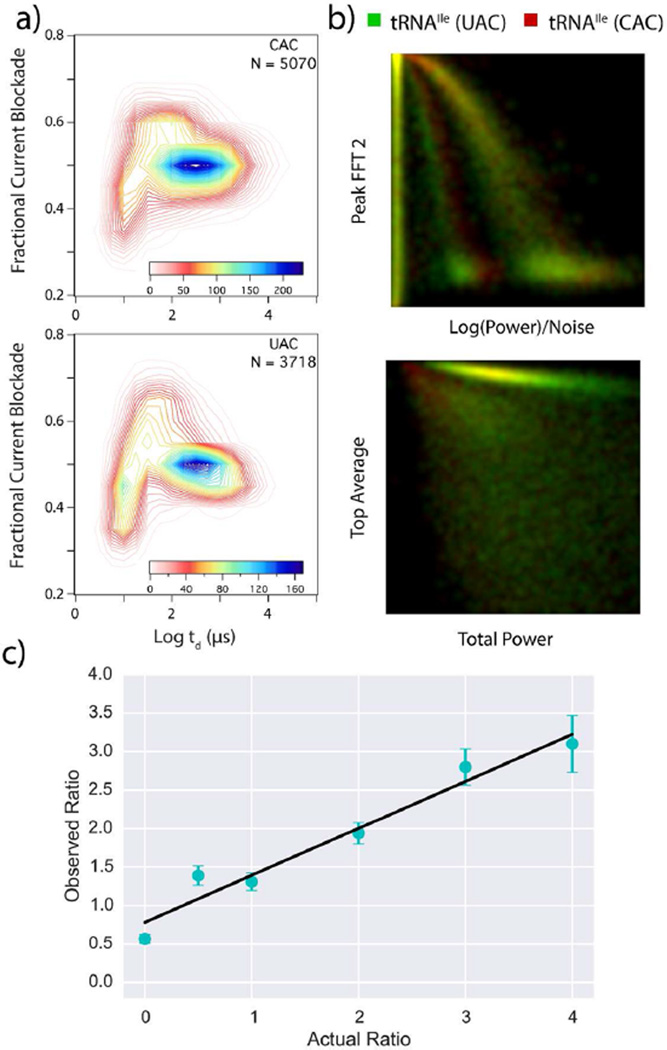
Comparison of the UAC and CAC tRNAIle isoacceptors. (a) Contour plots showing both isoacceptors, >3000 events were recorded for each at an applied voltage of 500 mV. (b) Two-dimensional projections using four of the SVM features. All units are normalized and shown from 0 to 1. UAC (green) and CAC (red). SVM analysis yields calling accuracy of 93% for individual pulses. Signal feature definitions: peal FFT 2 (power spectrum value at 18 kHz), log(power)/noise (the log of the sum of the power spectrum, divided by the noise spectrum of the nanopore system), top average (sum of the ionic current values within a translocation pulse), total power (log of the sum of the power spectrum) (c) Measured ratio of UAC to CAC signals vs the known molar ratio in solution. The ratios do not show 1:1 correspondence due to differences in the capture efficiency for the two molecules, but the linear correlation convincingly shows that the identity of single molecule events can be assigned). The error in the ratios was determined by segmenting the peaks by time (~5 s intervals). The ratios between the various analytes were then determined for each segment, normalized and the percent error was determined.
References
Publication types
MeSH terms
Substances
Grants and funding
LinkOut - more resources
Full Text Sources
Other Literature Sources
