. 2015 Dec 24;528(7583):504-9.
doi: 10.1038/nature16461. Epub 2015 Nov 26.

Complete nitrification by Nitrospira bacteria

Affiliations

Complete nitrification by Nitrospira bacteria

Holger Daims et al. Nature. .

Abstract

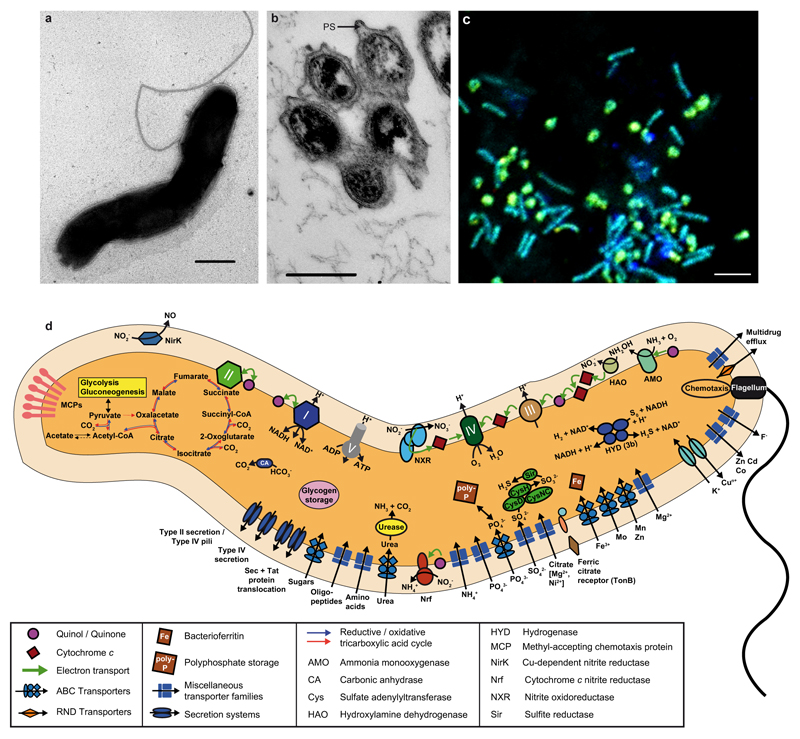
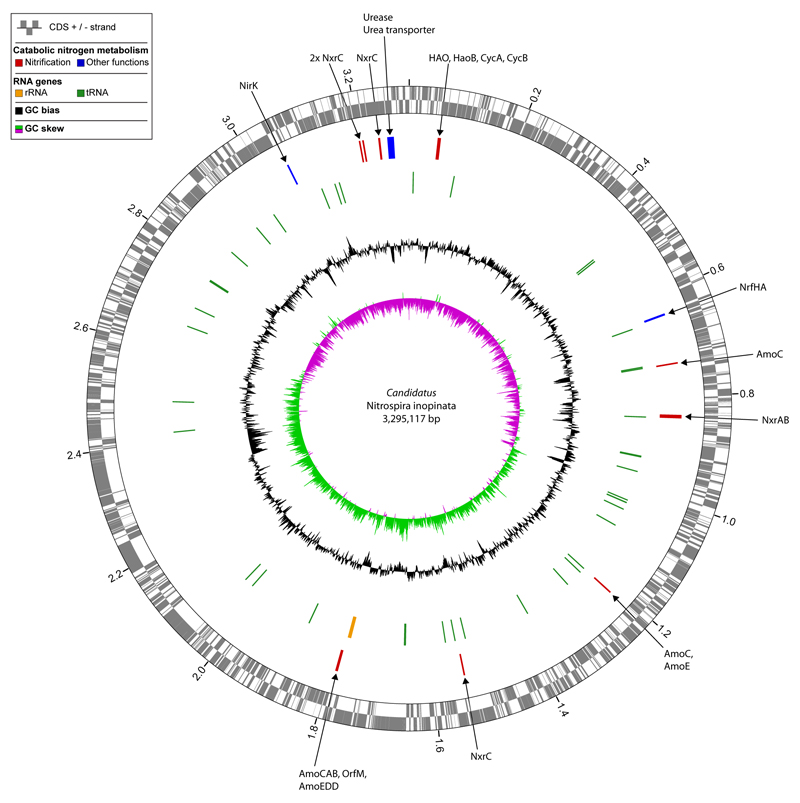
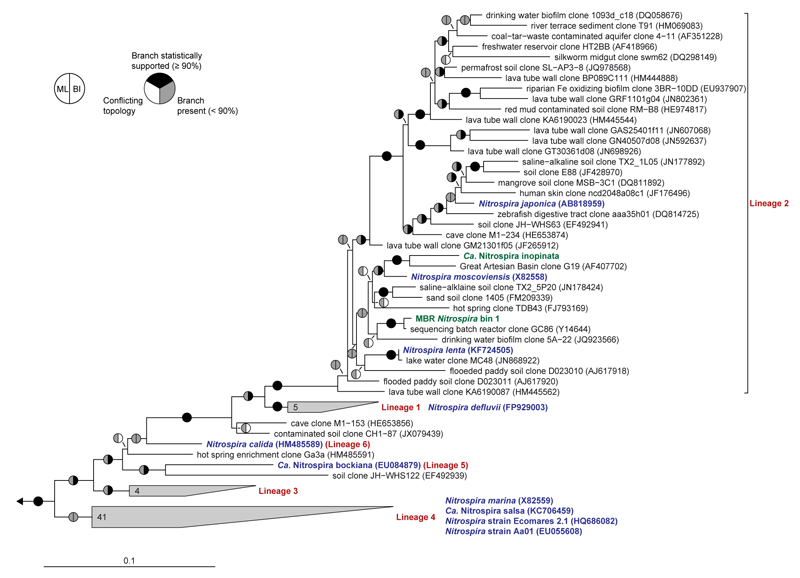
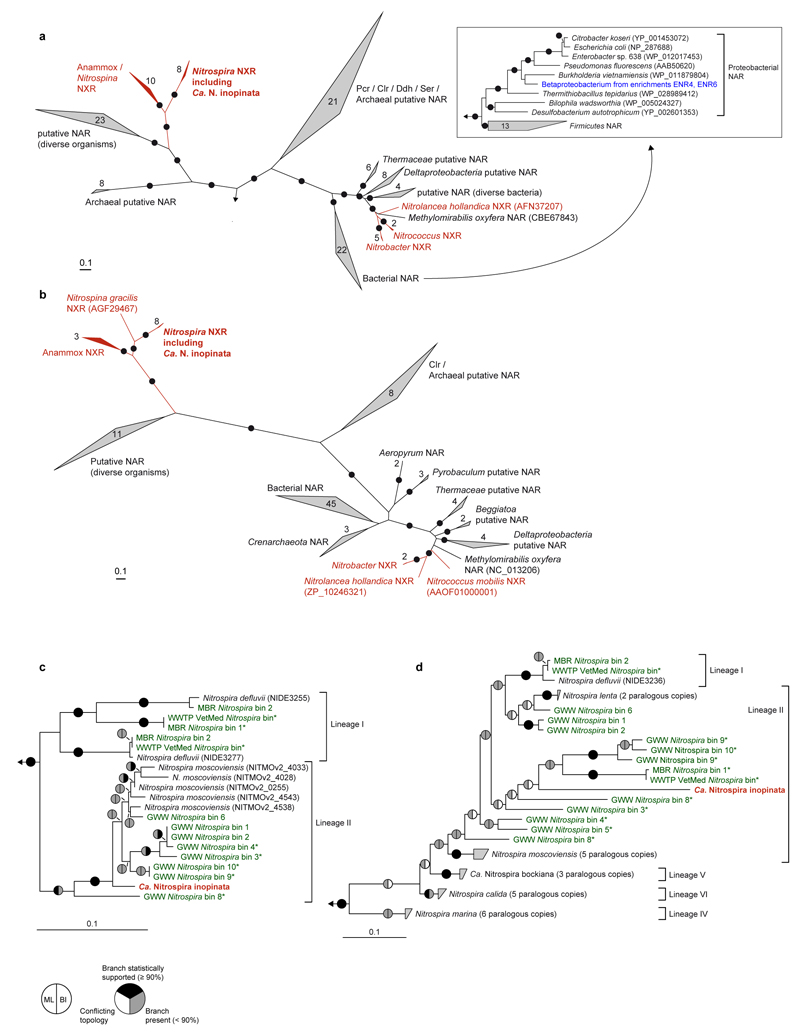
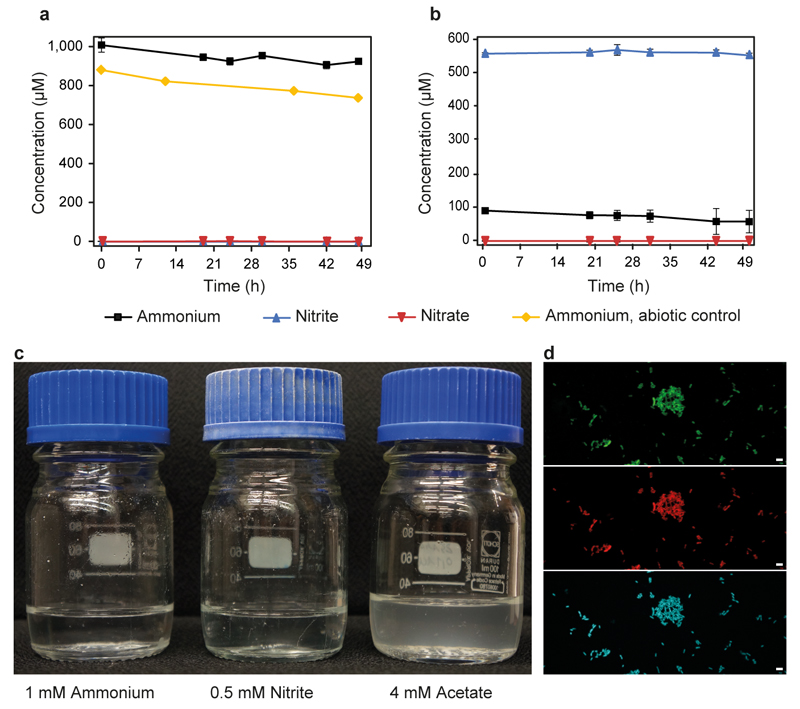
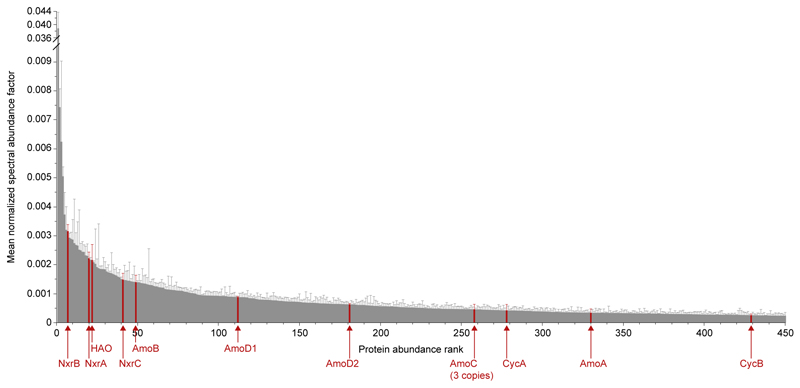
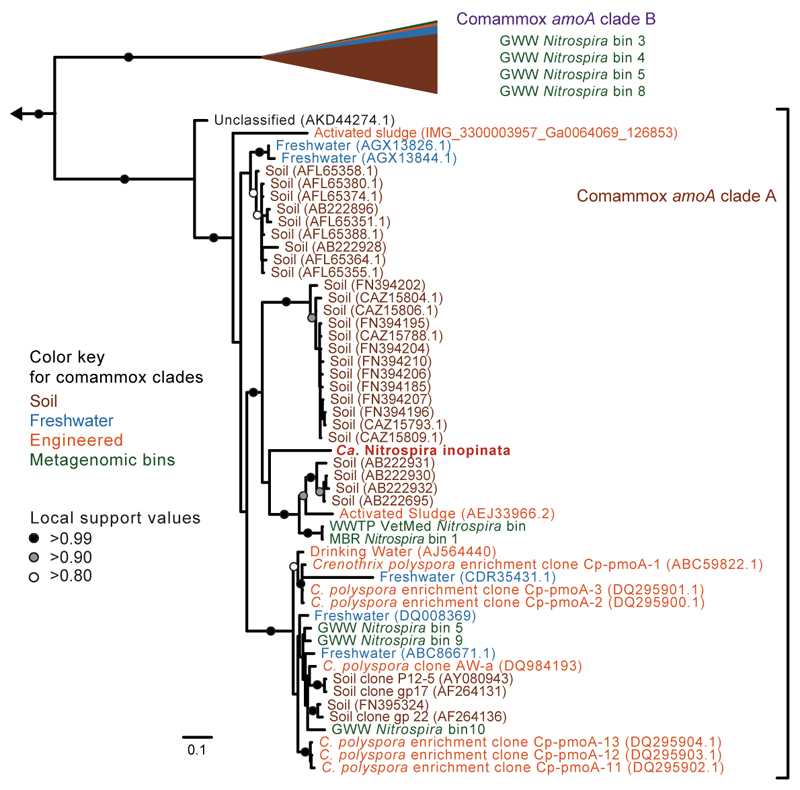
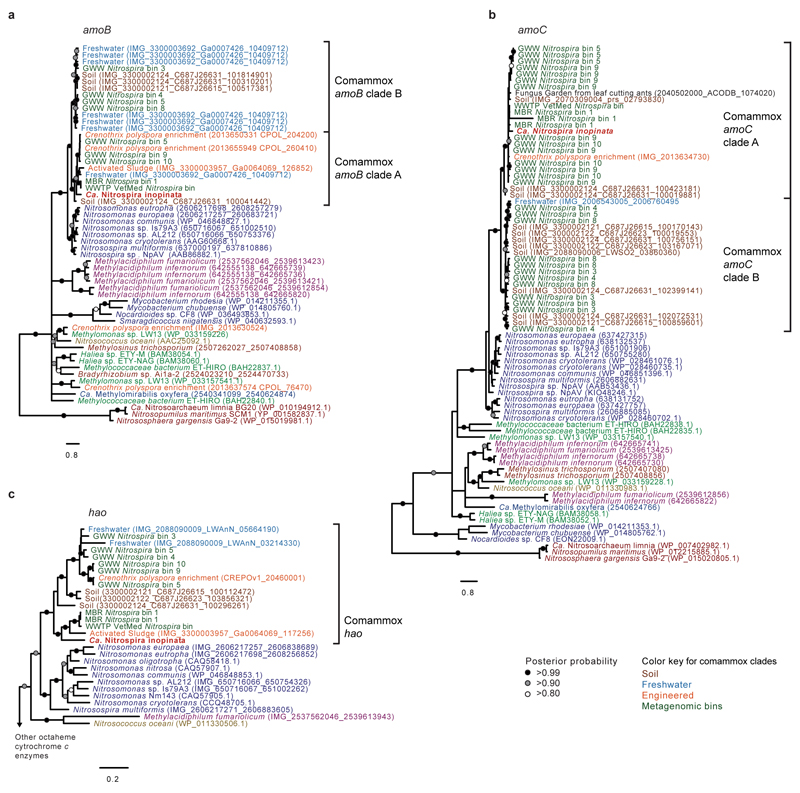
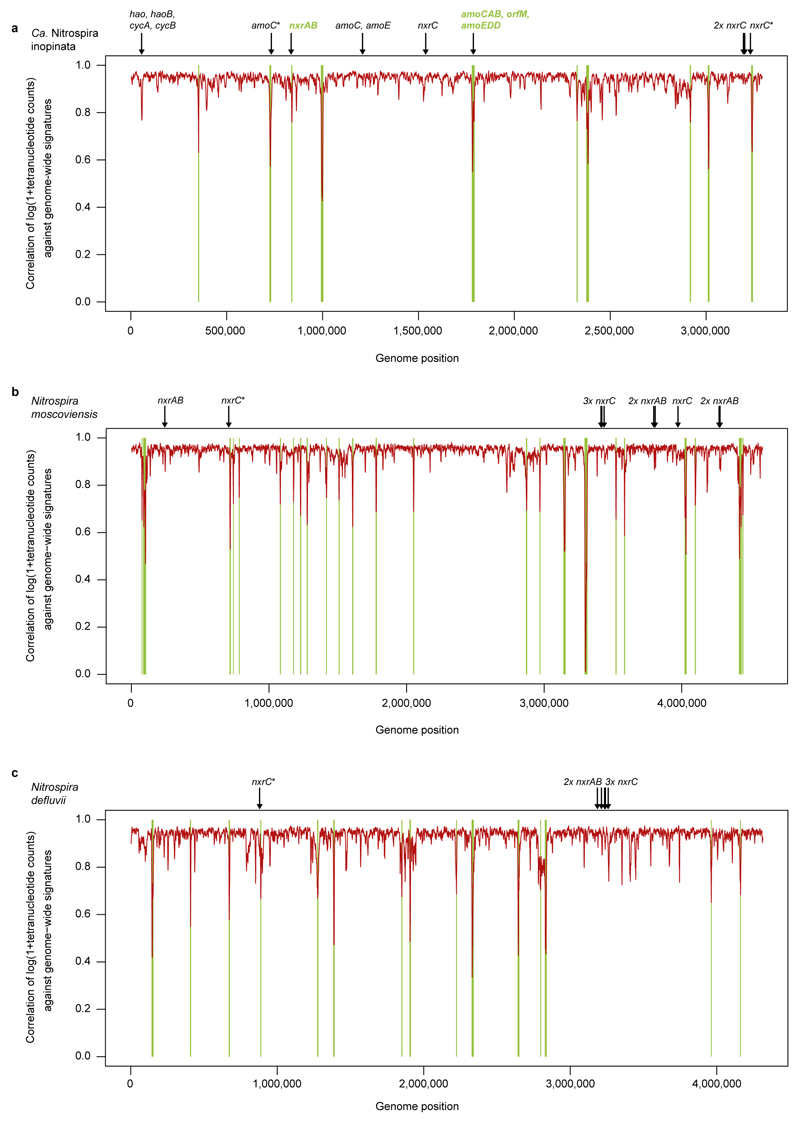
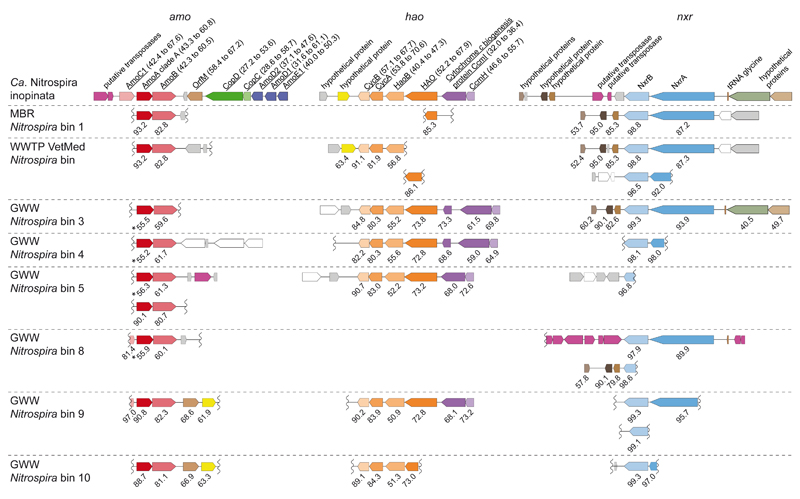
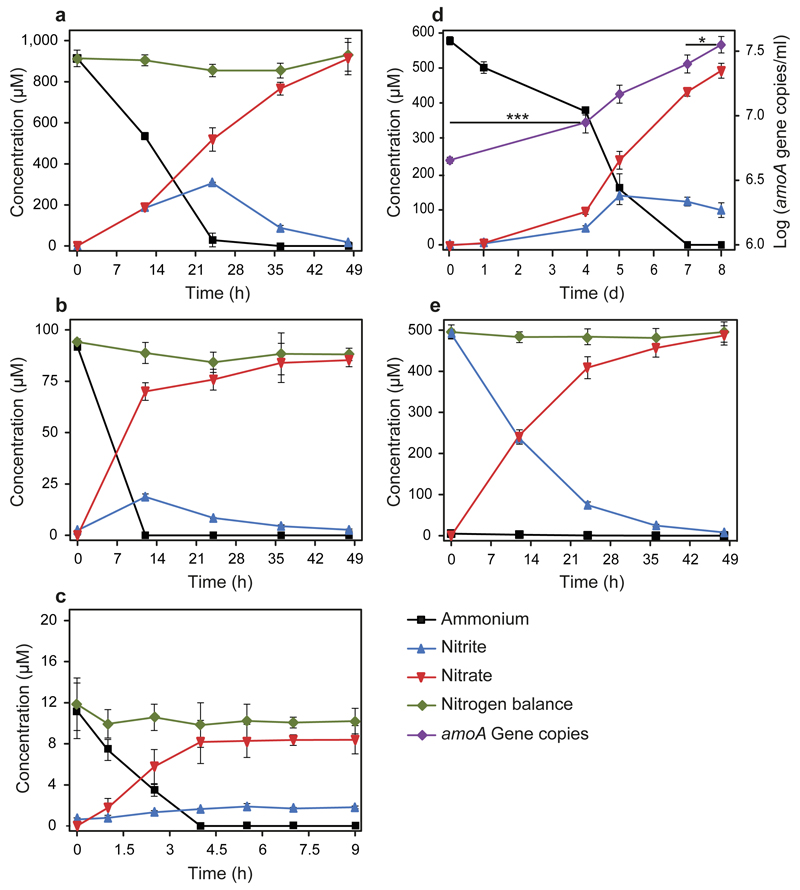
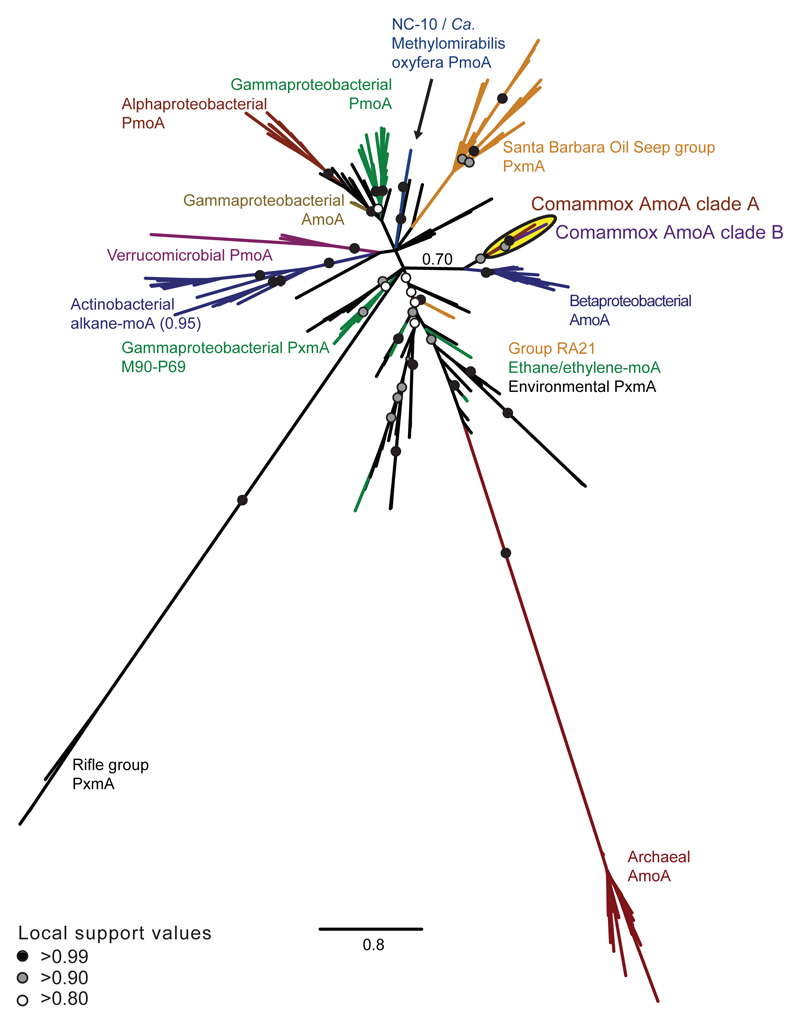
Nitrification, the oxidation of ammonia via nitrite to nitrate, has always been considered to be a two-step process catalysed by chemolithoautotrophic microorganisms oxidizing either ammonia or nitrite. No known nitrifier carries out both steps, although complete nitrification should be energetically advantageous. This functional separation has puzzled microbiologists for a century. Here we report on the discovery and cultivation of a completely nitrifying bacterium from the genus Nitrospira, a globally distributed group of nitrite oxidizers. The genome of this chemolithoautotrophic organism encodes the pathways both for ammonia and nitrite oxidation, which are concomitantly activated during growth by ammonia oxidation to nitrate. Genes affiliated with the phylogenetically distinct ammonia monooxygenase and hydroxylamine dehydrogenase genes of Nitrospira are present in many environments and were retrieved on Nitrospira-contigs in new metagenomes from engineered systems. These findings fundamentally change our picture of nitrification and point to completely nitrifying Nitrospira as key components of nitrogen-cycling microbial communities.


Figures

Extended Data Figure 1
Extended Data Figure 1. Photomicrographs and cell diagram of Ca. Nitrospira inopinata.
a, Transmission electron micrograph of a spiral-shaped cell with a flagellum. The size of Ca. N. inopinata cells is 0.18 to 0.3 µm in width and 0.7 to 1.6 µm in length. Scale bar represents 200 nm. b, Transmission electron micrograph of a thin section preparation. Microcolony showing the wide periplasmic space (PS), which is a characteristic feature of Nitrospira. Scale bar represents 200 nm. c, Fluorescence image of cells from enrichment ENR4 after hybridization with oligonucleotide probes targeting Nitrospira (Ntspa662 and Ntspa712 both labelled with Cy3, red), the betaproteobacterium (Nmir1009 labelled with Cy5, blue), and Bacteria (EUB338 probe mix labelled with FLUOS, green). Ca. N. inopinata cells and microcolonies appear yellow and the betaproteobacterial cells appear cyan due to simultaneous hybridization to the respective specific probe and the EUB338 probe mix. Scale bar represents 2 µm. d, Cell metabolic cartoon constructed from the annotation of the Ca. N. inopinata genome. Enzyme complexes of the electron transport chain are labelled by Roman numerals.
Extended Data Figure 2
Extended Data Figure 2. Sequence composition-independent binning of the metagenome scaffolds from the nitrifying enrichment cultures.
Circles represent scaffolds, scaled by the square root of their length. Only scaffolds ≥5 kbp are shown. Clusters of similarly coloured circles represent potential genome bins. These differential coverage plots were the starting points for further refinement and finishing of genome assemblies as described elsewhere. a, binning of the scaffolds from enrichment culture ENR4 containing Ca. N. inopinata and three heterotrophic populations related to the Betaproteobacteria, Alphaproteobacteria, and Actinobacteria. b, binning of the scaffolds from enrichment culture ENR6 containing only Ca. N. inopinata and the betaproteobacterial accompanying heterotrophic organism. Enrichment ENR4, sample A, was used for comparison in differential coverage binning of culture ENR6.
Extended Data Figure 3
Extended Data Figure 3. Circular representation of the Ca. N. inopinata chromosome.
Predicted coding sequences (CDS; rings 1+2), genes of enzymes involved in nitrification and other pathways of catabolic nitrogen metabolism (ring 3), RNA genes (ring 4), and local nucleotide composition measures (rings 5+6) are shown. Very short features were enlarged to enhance visibility. Clustered genes, such as several tRNA genes, may appear as one line due to space limitations. The tick interval is 0.2 Mbp. Abbreviations: Amo, ammonia monooxygenase; HAO, hydroxylamine dehydrogenase; CycA and CycB, tetraheme c-type cytochromes that form the hydroxylamine ubiquinone redox module together with HAO; NirK, Cu-dependent nitrite reductase; Nrf, cytochrome c nitrite reductase; Nxr, nitrite oxidoreductase; Orf, open reading frame.
Extended Data Figure 4
Extended Data Figure 4. Phylogenetic affiliation of Ca. N. inopinata.
The maximum likelihood tree, which is based on 16S ribosomal RNA sequences of cultured and uncultured representative members of the genus Nitrospira, shows that the comammox organism Ca. N. inopinata (highlighted green) is a member of Nitrospira lineage II. Another 16S rRNA gene sequence was extracted from MBR metagenomic Nitrospira bin 1 (also highlighted green). This sequence bin also contained amo and hao genes (main text Figure 1, Extended Data Figures 8 and 9). The cultured Nitrospira strains other than Ca. N. inopinata, which are not known to use ammonia as a source of energy and reductant, are highlighted blue. Nitrospira lineages are labeled red. Pie charts indicate statistical support of branches based on maximum likelihood (ML; 1,000 bootstrap iterations) and Bayesian inference (BI; posterior probability, 4 independent chains). In total, 95 taxa and 1,543 nucleotide sequence alignment positions were considered. Numbers in wedges indicate the numbers of taxa. The scale bar indicates 0.1 estimated substitutions per nucleotide.
Extended Data Figure 5
Extended Data Figure 5. Phylogeny of NXR from Ca. N. inopinata and related proteins.
a,b, Maximum likelihood trees showing the alpha (a) and beta (b) subunits of selected enzymes from the DMSO reductase type II family. Names of validated enzymes are indicated (Clr, chlorate reductase; Ddh, dimethylsulfide dehydrogenase; NAR, nitrate reductase; NXR, nitrite oxidoreductase; Pcr, perchlorate reductase; Ser, selenate reductase). More distantly related molybdoenzymes were used as outgroup. Black dots on branches indicate high maximum likelihood bootstrap support (≥ 90%; 1,000 iterations). Known NXR forms are highlighted in red. The inset in (a) contains a subtree, which shows the phylogenetic affiliation of the NAR of the betaproteobacterium from enrichments ENR4 and ENR6 (highlighted in blue) with canonical nitrate reductases of Proteobacteria. In total, 1,279 (a) and 556 (b) amino acid sequence alignment positions, and 134 (a) and 99 (b) taxa (including outgroups), were considered. c,d Maximum likelihood trees showing only Nitrospira NxrA (c) and nxrB (d) phylogenies. The tree in (d) was calculated using nucleotide sequences aligned according to their amino acid translations. Ca. N. inopinata is highlighted in red, sequences from metagenomic Nitrospira bins obtained in this study are highlighted in green. Asterisks mark metagenomic bins that also contain amo genes. Metagenomic bins are numbered as in Supplementary Table 8. Sublineages of the genus Nitrospira are indicated. As recognized earlier, lineage II is paraphyletic with respect to lineage I in nxrB phylogenies, but differentiation of the lineages is stable. Pie charts indicate statistical support of branches based on maximum likelihood (ML; 1,000 bootstrap iterations) and Bayesian inference (BI; posterior probability, 3 independent chains). In total, 1,279 amino acid sequence alignment positions (c) and 1,290 nucleotide sequence alignment positions (d), and 30 (c) and 40 (d) taxa (including outgroups), were considered. All panels: Numbers in or next to wedges indicate the numbers of taxa. The scale bars indicate 0.1 estimated substitutions per residue.
Extended Data Figure 6
Extended Data Figure 6. Absence of nitrifying activity in the betaproteobacterium found in enrichments ENR4 and ENR6.
a,b, Incubation of a pure culture of the betaproteobacterium in mineral medium containing 1 mM ammonium (a) or 0.5 mM nitrite plus 0.1 mM ammonium as nitrogen source (b). No conversion of ammonium to nitrite or nitrate, or of nitrite to nitrate, was observed. Data points in a and b show means, error bars show 1 s.d. of n=3 biological replicates. If not visible, error bars are smaller than symbols. The mean initial densities of the cultures, as determined by qPCR of the single-copy soxB gene, were 7.15±0.01 (log soxB copies/ml, 1 s.d., n=3) for the 1 mM ammonium experiment (a) and 7.22±0.02 (log soxB copies/ml, 1 s.d., n=3) for the 0.5 mM nitrite plus 0.1 mM ammonium experiment (b). After 48 h of incubation, the mean densities were 7.06±0.10 and 7.15±0.29, respectively. A slight decrease in the ammonium concentration was observed in these experiments and also in an abiotic control incubation containing only medium and 1 mM ammonium, but no cells (data points for this control show means of two technical replicates). It might be explained by adsorption of ammonium to the glass bottles or by outgassing of NH3. c, Photographs of incubation bottles after 53 h of incubation. The mean optical density at 600 nm (OD600) of the cultures at this time point was 0.006±0.003 (1 s.d., n=3) for the 1 mM ammonium experiment and 0.007±0.008 (1 s.d., n=3) for the 0.5 mM nitrite plus 0.1 mM ammonium experiment. Control incubations were carried out in medium containing 4 mM acetate and 0.1 mM ammonium as nitrogen source for assimilation (three biological replicates). The inoculum for these cultures was 2.5-fold diluted compared to the experiments with ammonium or nitrite. After incubation, the acetate-grown cultures were visibly turbid with a mean OD600 of 0.068±0.011 (1 s.d., n=3) and the mean density was 8.12±0.03 (log soxB copies/ml, 1 s.d., n=3). Thus, the culture of the betaproteobacterium, which was used to inoculate all experiments, was physiologically active and grew on acetate. d, Fluorescence images showing the culture of the betaproteobacterium after FISH with the EUB338 probe mix (labelled with FLUOS, green), probe Nmir1009 that is specific for this organism (labelled with Cy3, red), and DAPI counterstaining (blue). The images show the same field of view after splitting the colour channels. According to FISH, all detected cells were the betaproteobacterium.
Extended Data Figure 7
Extended Data Figure 7. Protein abundance levels of Ca. N. inopinata during growth on ammonia.
Displayed are the 450 most abundant proteins from Ca. N. inopinata in the metaproteome from culture ENR4 after incubation with 1 mM ammonium for 48 h. Red arrows and labels highlight key proteins for ammonia and nitrite oxidation. Columns show the mean normalized spectral abundance factor (NSAF), error bars show 1 s.d. of n=4 biological replicates. In total 1,083 proteins in the metaproteome were unambiguously assigned to Ca. N. inopinata. Only one of the four putative NXR gamma subunits (NxrC) was among the top 450 expressed proteins. The other three NxrC candidates ranked at positions 561, 605, and 931. The AmoE1 protein was ranked at position 520, and HaoB at position 653.
Extended Data Figure 8
Extended Data Figure 8. Phylogenetic affiliation of comammox amoA sequences to amoA sequences from different environments.
Bayesian inference tree showing the phylogenetic relationship of the amoA sequences from Ca. N. inopinata and metagenomic bins from this study (224 taxa, 939 nucleotide alignment positions). Ca. N. inopinata clusters confidently into comammox amoA clade A. Comammox amoA clade B (116 taxa) has been collapsed for clarity and the proportion of database sequences from soil (95 taxa), freshwater (13 taxa), and engineered environments (4 taxa) is represented as a proportion of the collapsed clade. AmoA from the metagenomic Nitrospira bins generated for this study (5 taxa in clade A, 4 taxa in clade B) are numbered as in Supplementary Table 8. Scale bar indicates estimated change per nucleotide. The outgroup consists of 27 betaproteobacterial amoA and 29 diverse pmoA sequences.
Extended Data Figure 9
Extended Data Figure 9. Phylogenetic relationship of comammox amoB, amoC, and hao sequences to corresponding gene family members.
Trees were calculated with PhyloBayes using nucleotide sequences aligned according to their amino acid translations. Support values indicate the consensus probability from 5 independent chains. Sequences outside the comammox clades are colored as in main text Figure 3. Metagenomic bins are numbered as in Supplementary Table 8. Scale bars indicate the estimated substitutions per nucleotide. a, Phylogenetic relationship of Ca. N. inopinata amoB to other amoB and pmoB genes (57 taxa, 1,518 alignment positions). b, Phylogenetic relationship of Ca. N. inopinata amoC to other amoC and pmoC genes (81 taxa, 993 alignment positions). c, Phylogenetic relationship of Ca. N. inopinata hydroxylamine dehydrogenase (hao) to other hao genes (37 taxa, 2,875 alignment positions).
Extended Data Figure 10
Extended Data Figure 10. Genome-wide tetranucleotide analysis of Ca. N. inopinata and other Nitrospira.
Correlation of tetranucleotide patterns in a 5 kb sliding window (step size 1 kb) against genome-wide tetranucleotide signatures. The positions of key nitrification genes are indicated. Regions where the tetranucleotide patterns significantly deviate from the genome-wide signature, and nitrification genes located in such regions, are highlighted in green. Asterisks mark genes that are outside significantly deviating regions but may appear to be inside due to space limitations in the figure. a, Ca. N. inopinata (member of Nitrospira lineage II). The hao, cycA, and cycB genes are located in a region whose tetranucleotide pattern deviates slightly but not significantly from the genome-wide signature. The P-value cutoff from the Benjamini-Hochberg procedure, indicating a significantly low correlation for a window’s tetranucleotide signature, was 0.00065 for this genome. b, N. moscoviensis (member of Nitrospira lineage II). The P-value cutoff for this genome was 0.0013. c, N. defluvii (member of Nitrospira lineage I). The P-value cutoff for this genome was 0.00072. In N. moscoviensis (b) and N. defluvii (c), all nxr genes are outside regions with significantly deviating tetranucleotide patterns.
Figure 1
Figure 1. Key nitrification gene loci in Ca. N. inopinata and the metagenomic Nitrospira population genome bins containing putative comammox Nitrospira.
Gene alignments of the amoCAB, hao, and nxrAB loci with flanking genes are shown. Only two or three of up to nine syntenic cytochrome c biogenesis genes upstream of the hao loci are displayed. Colours identify homologous genes. Genes without homologs in the analyzed dataset are white if their function is known, otherwise grey. Transposases are magenta irrespectively of homology. Numbers below genes represent amino acid sequence identities (in per cent) of the predicted gene products compared to Ca. N. inopinata. Asterisks mark comammox clade B amoA genes. Wiggly lines indicate ends of metagenomic contigs. Underlined gene products of Ca. N. inopinata have homologs in AOB genomes (amino acid identities in per cent to AOB are indicated in parentheses), but gene arrangements can differ from AOB. Genes and noncoding regions are drawn to scale. Metagenomic bins are numbered as in Supplementary Table 8. Abbreviations: MBR, membrane bioreactor; WWTP, wastewater treatment plant; GWW, groundwater well.
Figure 2
Figure 2. Complete nitrification by Ca. N. inopinata in enrichment culture ENR4.
a-c, Near-stoichiometric oxidation of 1 mM, 0.1 mM, or 10 µM ammonium to nitrate with transient accumulation of nitrite. d, Growth of Ca. N. inopinata on ammonium (initial concentration 0.6 mM) as determined by qPCR of the amoA gene. Ammonia oxidation was slow because this experiment was started with a highly diluted culture. Significance of difference was calculated by a paired t-test (*: p<0.05; ***: p<0.01) between data points as indicated by horizontal lines. e, Near-stoichiometric oxidation of 0.5 mM nitrite to nitrate by ammonia-grown Ca. N. inopinata. The cells were washed to remove residual ammonium prior to nitrite addition. Data points show means, error bars show 1 s.d. of n=4 (a, b, e) or n=3 (c, d) biological replicates. If not visible, error bars are smaller than symbols.
Figure 3
Figure 3. Phylogenetic affiliation of comammox AmoA sequences to other AmoA superfamily members.
Bayesian inference tree showing the phylogenetic relationship of comammox AmoA to other members of the AmoA superfamily (202 taxa, 238 alignment positions). Comammox AmoA sequences formed clades A (posterior probability, PP=0.99) and B (PP=0.97) that grouped together (PP=0.91) and with betaproteobacterial AmoA (PP=0.70). Scale bar indicates estimated change per nucleotide.

Comment in

References

    1. Bock E, Wagner M. In: The Prokaryotes: A Handbook on the Biology of Bacteria. Dworkin M, et al., editors. Springer Science+Business Media; 2001. pp. 457–495.
    1. Könneke M, et al. Isolation of an autotrophic ammonia-oxidizing marine archaeon. Nature. 2005;437:543–546. - PubMed
    1. Winogradsky S. Contributions a la morphologie des organismes de la nitrification. Arch Sci Biol (St Petersb) 1892;1:88–137.
    1. Arp D, Bottomley PJ. Nitrifiers: More than 100 years from isolation to genome sequences. Microbe. 2006;1:229–234.
    1. Pfeiffer T, Bonhoeffer S. Evolution of cross-feeding in microbial populations. Am Nat. 2004;163:E126–E135. doi: 10.1086/383593. - DOI - PubMed

Publication types

Associated data