. 2015 Nov 27:6:8653.
doi: 10.1038/ncomms9653.

Identification of candidate genes for prostate cancer-risk SNPs utilizing a normal prostate tissue eQTL data set

Affiliations

Identification of candidate genes for prostate cancer-risk SNPs utilizing a normal prostate tissue eQTL data set

S N Thibodeau et al. Nat Commun. .

Abstract

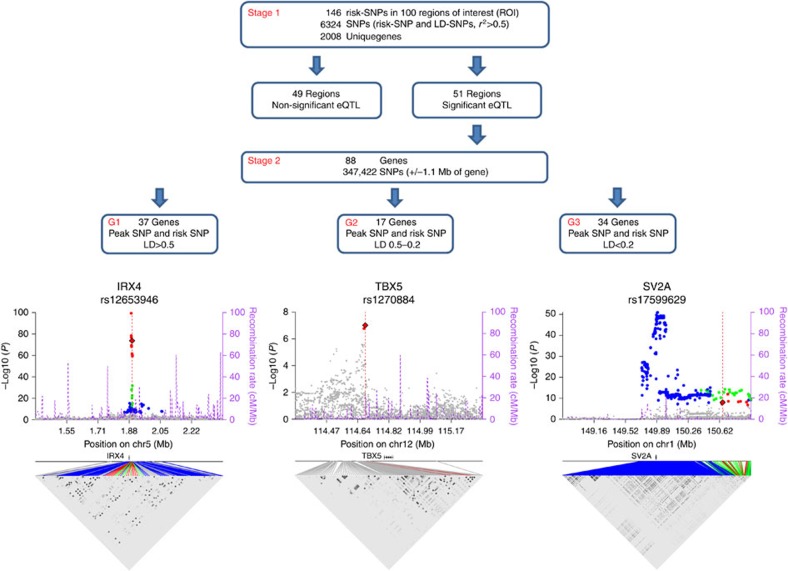
Multiple studies have identified loci associated with the risk of developing prostate cancer but the associated genes are not well studied. Here we create a normal prostate tissue-specific eQTL data set and apply this data set to previously identified prostate cancer (PrCa)-risk SNPs in an effort to identify candidate target genes. The eQTL data set is constructed by the genotyping and RNA sequencing of 471 samples. We focus on 146 PrCa-risk SNPs, including all SNPs in linkage disequilibrium with each risk SNP, resulting in 100 unique risk intervals. We analyse cis-acting associations where the transcript is located within 2 Mb (±1 Mb) of the risk SNP interval. Of all SNP-gene combinations tested, 41.7% of SNPs demonstrate a significant eQTL signal after adjustment for sample histology and 14 expression principal component covariates. Of the 100 PrCa-risk intervals, 51 have a significant eQTL signal and these are associated with 88 genes. This study provides a rich resource to study biological mechanisms underlying genetic risk to PrCa.


Figures

Figure 1
Figure 1. Schematic diagram outlining the eQTL analyses conducted for the primary and second stages.
Schematic diagram outlining the analysis conducted for the primary analysis (focused on risk regions defined by PrCa-risk SNPs) and for the second stage (focused on target gene regions defined as all genes meeting a Bonferroni significance threshold in stage 1). Stage 2 results were classified into three groups (G1, G2 and G3) based on the magnitude of LD between the PrCa-risk SNP and the peak eQTL-associated SNP in each region; G1 defined as r2>0.5 between risk and peak SNPs, G2 having r2 between 0.2–0.5 and G3 having r2≤0.2. An example regional association plot is shown for each group. The x axis shows the chromosomal position of the SNPs (with analyzed gene in the region displayed below) and the y axis is the −log10(P value) obtained by regressing normalized expression levels for the gene listed in the panel title on the number of minor alleles of each SNP genotype adjusted for histologic characteristics and 14 expression principal components. The position of the PrCa-risk SNP is indicated by a dotted red vertical line with the eQTL result displayed as diamond. All Bonferroni significant results are coloured, with the colour defined by LD between the SNP and the PrCa-risk SNP listed in the panel title (LD r2>0.5 red, between 0.2–0.5 green and ≤0.2 blue). The right y axis shows the recombination rate (purple dotted lines mark recombination locations). The bottom half of each panel contains an LD heat map of the significant SNPs in the region (if >1,000 significant SNPs, only the top 1,000 SNPs in the region are shown).
Figure 2
Figure 2. Regional association plots for regions containing multiple risk SNPs.
Regional association plots are presented for three gene regions, each of which contain two or more PrCa-risk SNPs with varying degrees of LD between them (r2=0.54 for GGCX region, r2<0.2 for BMPR1B region and r2=0.67 for HNF1B region. The x axis shows the chromosomal position of the SNPs (with analyzed gene in the region displayed below) and the y axis is the −log10 (P value) obtained by regressing normalized expression levels for the gene listed in the panel title on the number of minor alleles of each SNP genotype adjusted for histologic characteristics and 14 expression principal components. The position of the PrCa-risk SNP is indicated by a dotted red vertical line with the eQTL result displayed as diamond. All Bonferroni significant results are coloured, with the colour defined by LD between the SNP and the PrCa-risk SNP listed in the panel title (LD r2>0.5 red, between 0.2–0.5 green and ≤0.2 blue). The right y axis shows the recombination rate (purple dotted lines mark recombination locations). The bottom half of each panel contains an LD heat map of the significant SNPs in the region (if >1,000 significant SNPs, only the top 1,000 SNPs in the region are shown). For each gene region, two or more plots are shown depending on the number of risk SNPs in the region, one for each risk SNP. The points are coloured according to LD with the risk SNP listed in the panel title (r2>0.5, red; between 0.2–0.5, green; and ≤0.2, blue). The eQTL result for the PrCa-risk SNP listed in the panel title is displayed as diamond, the data points for all of the other PrCa-risk SNPs are displayed as an open circle.
Figure 3
Figure 3. Regional association plots for the CHMP2B gene region containing multiple risk SNPs.
Regional association plot presented for the CHMP2B gene region containing several PrCa-risk SNPs with varying degrees of LD between them. The x axis shows the chromosomal position of the SNPs (with analyzed gene in the region displayed below) and the y axis is the −log10(P value) obtained by regressing normalized expression levels for the gene listed in the panel title on the number of minor alleles of each SNP genotype adjusted for histologic characteristics and 14 expression principal components. The position of the PrCa-risk SNP is indicated by a dotted red vertical line with the eQTL result displayed as diamond. All Bonferroni significant results are coloured, with the colour defined by LD between the SNP and the PrCa-risk SNP listed in the panel title (LD r2>0.5, red; between 0.2–0.5, green; and ≤0.2, blue). The right y axis shows the recombination rate (purple dotted lines mark recombination locations). The bottom half of each panel contains an LD heat map of the significant SNPs in the region (if >1,000 significant SNPs, only the top 1,000 SNPs in the region are shown). For each gene region, two or more plots are shown depending on the number of risk SNPs in the region, one for each risk SNP. The points are coloured according to LD with the risk SNP listed in the panel title (r2>0.5, red; between 0.2–0.5, green; and ≤0.2, blue). The eQTL result for the PrCa-risk SNP listed in the panel title is displayed as diamond, the data points for all of the other PrCa-risk SNPs are displayed as an open circle.
Figure 4
Figure 4. Positional distribution of peak cis-eQTLs and their effect size.
Each point represents the peak SNP for each significant target gene (N=88). The β-coefficient obtained by regressing normalized expression levels for each target gene on the number of minor alleles of each SNP genotype adjusted for histologic characteristics and 14 expression principal components is plotted on the y axis and the SNP distance from the TSS or TES on the x axis. For display purposes, the distance between the TES and TSS was normalized to be 100 kb.

References

    1. Siegel R., Miller K. D. & Jemal A. Cancer statistics, 2015. CA Cancer J. Clin. 65, 5–29 (2015). - PubMed
    1. Knudsen B. S. & Vasioukhin V. Mechanisms of prostate cancer initiation and progression. Adv. Cancer Res. 109, 1–50 (2010). - PubMed
    1. Schaid D. J. The complex genetic epidemiology of prostate cancer. Hum. Mol. Genet. 1, R103–R121 (2004). - PubMed
    1. Witte J. S. Prostate cancer genomics: towards a new understanding. Nat. Rev. Genet. 10, 77–82 (2009). - PMC - PubMed
    1. Duggan D. et al. Two genome-wide association studies of aggressive prostate cancer implicate putative prostate tumor suppressor gene DAB2IP. J. Natl Cancer Inst. 99, 1836–1844 (2007). - PubMed

Publication types

Associated data