. 2016 Jun 15;1641(Pt B):234-44.
doi: 10.1016/j.brainres.2015.11.023. Epub 2015 Nov 22.

Uncovering diversity in the development of central noradrenergic neurons and their efferents

Affiliations

Uncovering diversity in the development of central noradrenergic neurons and their efferents

Sabrina D Robertson et al. Brain Res. .

Abstract

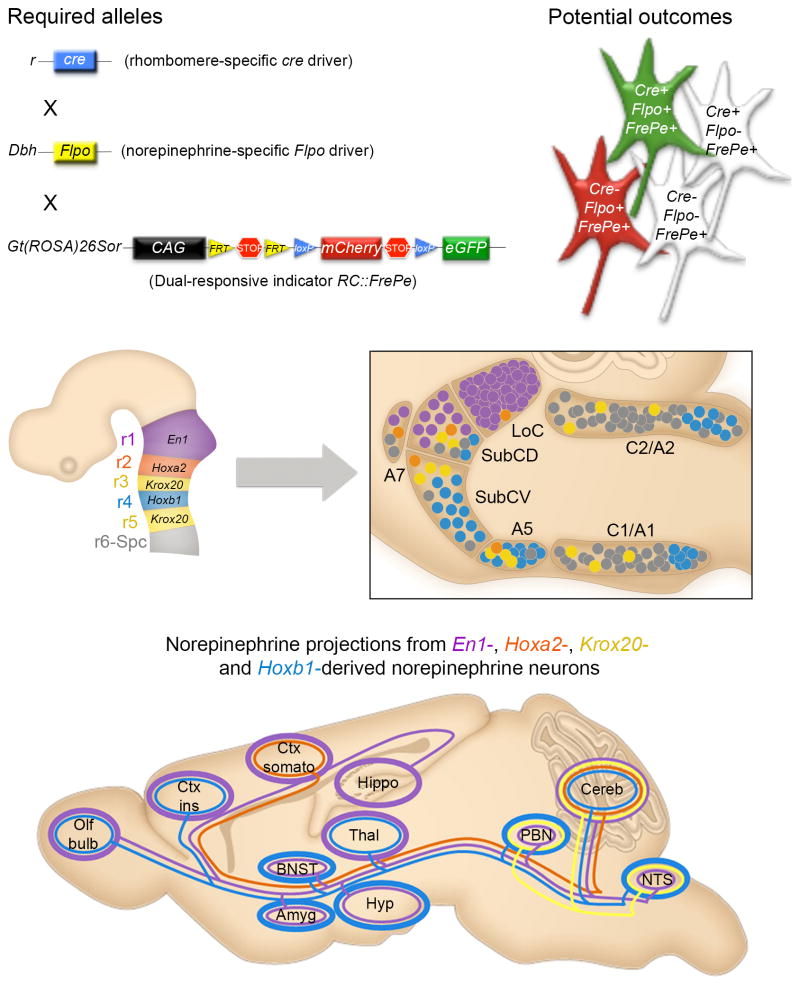
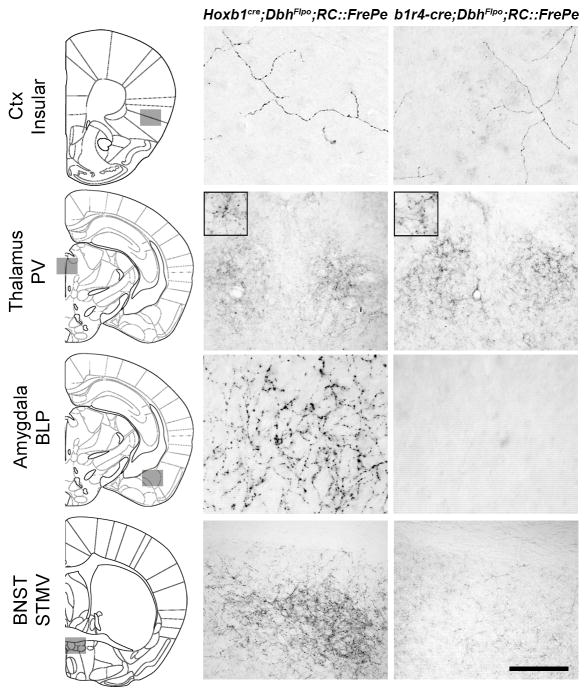
Uncovering the mechanisms that underlie central noradrenergic neuron heterogeneity is essential to understanding selective subtype vulnerability to disease and environmental insult. Using recombinase-based intersectional genetic fate mapping we have previously demonstrated that molecularly distinct progenitor populations give rise to mature noradrenergic neurons differing in their anatomical location, axon morphology and efferent projection pattern. Here we review the findings from our previous study and extend our analysis of the noradrenergic subpopulation defined by transient developmental expression of Hoxb1. Using a combination of intersectional genetic fate mapping and analysis of a targeted loss of function mutation in Hoxb1, we have now uncovered additional heterogeneity based on the requirement of some noradrenergic neurons for Hoxb1 expression. By comparing the distribution of noradrenergic neurons derived from the Hoxb1 expression domain in wild-type and mutant mice, we demonstrate that Hoxb1 expression is required by a subset of neurons in the pons. Additional fate mapping, using a Hoxb1 enhancer element that drives Cre recombinase expression exclusively in rhombomere 4 of the hindbrain, reveals the existence of a subpopulation of noradrenergic neurons in the pons with more restricted axonal targets than the full Hoxb1-derived subpopulation. The unique projection profile of this newly defined subpopulation suggests that it may be functionally distinct. These analyses shed new light on the molecular determinants of noradrenergic identity in the pons and the overall complexity of the central noradrenergic system. This article is part of a Special Issue entitled SI: Noradrenergic System.

Keywords: Efferents; Fate map; Hoxb1; Norepinephrine; Recombinase-based intersectional genetic fate mapping; Rhombomere.


Figures

Figure 1
Figure 1. Intersectional labeling reveals genetically defined subpopulations of noradrenergic neurons with distinct efferent projection patterns
(Top) Visualization of noradrenergic neurons derived from a specific rhombomere in the embryonic hindbrain requires a rhombomere-specific Cre driver, noradrenergic specific Flp driver, and dual-recombinase responsive fluorescent indicator allele, RC::FrePe. In mice that inherit all three alleles, noradrenergic neurons derived from the Cre expression domain will be labeled with eGFP. All other noradrenergic neurons will be labeled with mCherry. (Middle) Four Cre driver lines expressed in the embryonic hindbrain (left, schematic sagittal view) define subpopulations of noradrenergic neurons that are distributed across the anatomically defined noradrenergic nuclei in the adult brainstem (right). The locus coeruleus (LoC), subcoeruleus dorsal (SubCD) and ventral (SubCV), A7, A5, C2/A2 and C1/A1 are shown with color-coded contribution from each genetically defined subpopulation represented as colored circles on a schematic sagittal view of the adult brainstem compressed along the mediolateral axis. (Bottom) Prominent axonal projections from the four genetically defined noradrenergic subopulations are illustrated as color-coded lines. The thickness of the open circle around each target region denotes the density of innervation. Olf bulb, olfactory bulb; Ctx ins, insular cortex; Ctx somato, somatosensory cortex; Hippo, hippocampus; BNST, bed nucleus of stria terminalis; Amyg, amygdala; Hippo, hippocampus; Thal, thalamus; Hyp, hypothalamus; PBN, parabranchial nucleus; Cereb, cerebellum; NTS, solitary nucleus. Adapted from Robertson et al., 2013.
Figure 2
Figure 2. Hoxb1 expression is required for the development of a subset of Hoxb1-derived noradrenergic neurons in the pontine SubC and A5 nuclei
(TOP) Coronal sections from adult mouse brainstem reveal the significant absence of Hoxb1-derived noradrenergic neurons in the SubC and A5 nuclei of Hoxb1-null animals (Null-Hoxb1cre/cre;DbhFlpo;RC::FrePe) compared to control animals (CTR-Hoxb1cre/+;DbhFlpo;RC::FrePe). Hoxb1-derived noradrenergic neurons are labeled with eGFP (green) and all other noradrenergic neurons are labeled with mCherry (red) in representative sections corresponding to the labeled areas in the schematic (top right). (Bottom) Counts of labeled neurons confirm a significant decrease in the number of eGFP-labeled neurons (**P<0.01) and total noradrenergic neurons (*P<0.05) in A5 of Hoxb1-null mice (top right graph). No significant change in mCherry-labeled A5 neurons was observed. In the SubCD of Hoxb1-null animals, a significant decrease in eGFP-labeled neurons (*P<0.05), but no significant difference in mCherry or total noradrenergic neurons was observed (bottom left graph). In the SubCV of Hoxb1 null animals, significant decreases in eGFP-labeled and total noradrenergic neurons were observed(***P<0.001) (bottom right graph). Numbers are the sum of bilateral counts from 40-μm sections spaced 120 μm apart from the brainstems of seven mice for each fate map (n=7 with minimum of n=3 for each gender; error bars are mean ± s.e.m.). Scale bar represents 119 μm in all images.
Figure 3
Figure 3. Hoxb1 expression is not required for the development of medullary Hoxb1-derived noradrenergic neurons
(Top) Coronal sections from adult mouse brainstem reveal an increase in Hoxb1-derived norepinephrine neurons in C1/A1 and C2/A2 nuclei of Hoxb1-null animals (Null-Hoxb1cre/cre;DbhFlpo;RC::FrePe) compared to control animals (CTR-Hoxb1cre/+;DbhFlpo;RC::FrePe). Hoxb1-derived noradrenergic neurons are labeled with eGFP and all other noradrenergic neurons are labeled with mCherry (red) in representative sections corresponding to the boxed areas in the schematic (left). Scale bar represents 100 μm (C2/A2) or 75 μm (C1/A1). (Bottom) Counts of labeled neurons confirm a significant increase of eGFP-labeled neurons (*P<0.05) but no significant change in numbers of mCherry-labeled or total noradrenergic neurons in C2/A2 (left graph). In C1/A1, a significant increase of eGFP-labeled neurons (***P<0.001) and total noradrenergic neurons was observed (right graph). Numbers are the sum of bilateral counts from 40-μm sections spaced 120 μm apart from the brainstems of six mice for each fate map (n=6 with n=3 for each gender; error bars are mean ± s.e.m.) For the total count of noradrenergic neurons (grey bars), the number of neurons co-expressing mCherry and eGFP was subtracted from the GFP population to prevent double counting.
Figure 4
Figure 4. In Hoxb1-null mice, the number of noradrenergic axons is increased at target sites of the Hoxb1-derived noradrenergic subpopulation
In Hoxb1-null (Null-Hoxb1cre/cre;DbhFlpo;RC::FrePe) and control (CTR-Hoxb1cre/+;DbhFlpo;RC::FrePe) mice, axons of Hoxb1-derived (eGFP-labeled) noradrenergic neurons are revealed by immunoperoxidase staining of representative sections from target sites of noradrenergic projections. Relative to controls, staining is heavier in Hoxb1-null sections indicating an increase in the number of labeled axons in the basolateral amygdala posterior part (BLP) and the bed nucleus of the stria terminalis (BNST) medial division ventral part (STMV) but not in the paraventricular (PV) thalamic nucleus. Grey boxes on coronal schematic diagrams indicate the approximate position of the imaged axons. Scale bar represents 136 μm (Thalamus and BNST) or 47 μm (Amygdala). The total projection pixel intensities (arbitrary intensity units) of eGFP-positive axon fibers from three Hoxb1-null and control mice are shown (BLP n=7, BNST STMV n=5, and PV n=6 images; error bars are mean ± s.e.m.). A two-tailed, unpaired t-test was used to determine significance. *P = 0.01 t = 2.896 df = 17 (BLP), ***P = 0.0002 t = 5.111 df = 13 (BNST STMV), Not significantly different P = 0.389 t = 0.8878 df = 15 (PV).
Figure 5
Figure 5. b1r4-cre expression defines a subpopulation of noradrenergic neurons in the pons
Coronal sections of brain from b1r4-cre;DbhFlpo;RC::FrePe mice demonstrate that b1r4-cre-derived noradrenergic neurons (b1r4-cre and DbhFlpo expression; eGFP-labeled) populate the SubC dorsal, SubC ventral, and A5 noradrenergic nuclei in the pons. No b1r4-cre-derived noradrenergic neurons are observed in the pontine A7 nucleus and medullary C2/A2 and C1/A1 nuclei. Cell counts indicate that b1r4-cre-derived neurons constitute a smaller percentage of SubC and A5 neurons than those labeled by Hoxb1cre.The number of labeled neurons in each anatomically defined noradrenergic nucleus (mean ± s.e.m.) is the sum of bilateral counts from 40-μm sections spaced 120 μm apart in the brainstems of seven mice (3 males and 4 females). Scale bar represents 128 μm (A7), 119 μm (LoC, SubC, C2/A2, C1/A1), or 77 μm (A5)
Figure 6
Figure 6. b1r4-cre defines a subpopulation of noradrenergic neurons with a distinct efferent projection pattern
At representative target sites, axons of eGFP-labeled Hoxb1-derived and b1r4-cre-derived noradrenergic neurons are revealed by immunoperoxidase staining. Projections from Hoxb1-derived noradrenergic subpopulation can be observed in insular cortex (Ctx), paraventricular (PV) thalamic nucleus, basolateral amygdala posterior part (BLP), and the BNST medial division ventral part (STMV). In contrast, projections from b1r4-cre-derived neurons are almost completely absent from the Amygdala and very sparse in the BNST. The representative images reflect observations from a minimum of five animals of each genotype. Grey boxes on coronal schematic diagrams indicate the approximate position of the imaged axons. Scale bar represents 136 μm (Thalamus and BNST), 56 μm (Ctx), or 47 μm (Amygdala).

References

    1. Awatramani R, Soriano P, Rodriguez C, Mai JJ, Dymecki SM. Cryptic boundaries in roof plate and choroid plexus identified by intersectional gene activation. Nature genetics. 2003;35:70–5. - PubMed
    1. Bang SJ, Jensen P, Dymecki SM, Commons KG. Projections and interconnections of genetically defined serotonin neurons in mice. The European journal of neuroscience. 2012;35:85–96. - PMC - PubMed
    1. Berridge CW, Waterhouse BD. The locus coeruleus-noradrenergic system: modulation of behavioral state and state-dependent cognitive processes. Brain research. Brain research reviews. 2003;42:33–84. - PubMed
    1. Brust RD, Corcoran AE, Richerson GB, Nattie E, Dymecki SM. Functional and developmental identification of a molecular subtype of brain serotonergic neuron specialized to regulate breathing dynamics. Cell Rep. 2014;9:2152–65. - PMC - PubMed
    1. Champagnat J, Morin-Surun MP, Fortin G, Thoby-Brisson M. Developmental basis of the rostro-caudal organization of the brainstem respiratory rhythm generator. Philos Trans R Soc Lond B Biol Sci. 2009;364:2469–76. - PMC - PubMed

Publication types

LinkOut - more resources