Accumulated common variants in the broader fragile X gene family modulate autistic phenotypes
- PMID: 26612855
- PMCID: PMC4693501
- DOI: 10.15252/emmm.201505696
Accumulated common variants in the broader fragile X gene family modulate autistic phenotypes
Abstract
Fragile X syndrome (FXS) is mostly caused by a CGG triplet expansion in the fragile X mental retardation 1 gene (FMR1). Up to 60% of affected males fulfill criteria for autism spectrum disorder (ASD), making FXS the most frequent monogenetic cause of syndromic ASD. It is unknown, however, whether normal variants (independent of mutations) in the fragile X gene family (FMR1, FXR1, FXR2) and in FMR2 modulate autistic features. Here, we report an accumulation model of 8 SNPs in these genes, associated with autistic traits in a discovery sample of male patients with schizophrenia (N = 692) and three independent replicate samples: patients with schizophrenia (N = 626), patients with other psychiatric diagnoses (N = 111) and a general population sample (N = 2005). For first mechanistic insight, we contrasted microRNA expression in peripheral blood mononuclear cells of selected extreme group subjects with high- versus low-risk constellation regarding the accumulation model. Thereby, the brain-expressed miR-181 species emerged as potential "umbrella regulator", with several seed matches across the fragile X gene family and FMR2. To conclude, normal variation in these genes contributes to the continuum of autistic phenotypes.
Keywords: FMR1; FMR2; FXR1; FXR2; PGAS; miR‐181.
© 2015 The Authors. Published under the terms of the CC BY 4.0 license.
Figures

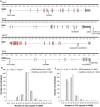
Schematic overview of
FMR 1,FXR 1,FXR 2,FMR 2, and position of the 8 selected single nucleotide polymorphisms (SNP s). Line represents introns, gray box at the beginning and end of each gene stands forUTR region, and red boxes represent exons. Gene structure plots generated using FancyGene (Rambaldi & Ciccarelli, 2009).Distribution of repeat polymorphism lengths in
FMR 1 of maleGRAS schizophrenia patients and healthy controls.Distribution of repeat polymorphism lengths in
FMR 2 of maleGRAS schizophrenia patients and healthy controls.

Genes from the “broader fragile X family” and their chromosomal position.
SNP numbers available through direct genotyping in the here used semicustom genotyping array (Affymetrix, Santa Clara,CA ,USA ).SNP s fulfilling some of the first round of selection criteria (“functional” =SNP s, i.e. located in promoter region, 3′UTR or coding sequence;MAF =MAF ≥ 0.2;LD =SNP s that “survive” after linkage disequilibrium pruning: r² < 0.8). Underlined are the 13SNP s selected for thePGAS approach using thePAUSS (selection requirements: fulfilled 2 of the above criteria or were functional). Not more than 3SNP s per gene are selected to avoid overrepresentation of one gene.SNP s with a tendency inPGAS (see Fig 3A) at singleSNP basis went into the final accumulation model.

- A, B
A total of 13
SNP s preselected according to theSOP presented in Fig 2 underwentPGAS screening as exemplified here: (A)PAUSS association pattern of an exemplary fictitious autosomal (upper panel) and a sex‐chromosomal (lower panel)SNP which are eligible for the accumulation model. The genotype associated with the highest averagePAUSS (in this exampleCC ) is the “proautistic genotype” (indicated by the black arrow) and is assigned a score of 1. The heterozygous genotype is assigned a score of 0.5 and the homozygous genotype associated with the lowestPAUSS receives a score of 0. Please note that the difference between genotypes does not have to be statistically significant. (B)PAUSS association pattern of an exemplary fictitious autosomal (upper panel) and a sex‐chromosomal (lower panel)SNP which would not be selected for the accumulation model because of unclear phenotypical/biological relevance. - C, D
The specificity of the association of the 8‐
SNP accumulation model with an autistic phenotype (as determined usingPAUSS ; compare Fig 4B) is controlled by applying an unrelated (or “non‐sense”) phenotype, for example, delusional‐depression: (C) Intercorrelation pattern of single items included in the delusional‐depression composite score, used here as example control phenotype. Cronbach's alpha is presented as measure of internal consistency. (D) The delusional‐depression composite score is not associated with the number of proautistic genotypes of the 8‐SNP risk model in the discovery sample.

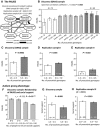
PAUSS (PANSS autism severity score) composition and item intercorrelation pattern in theGRAS sample of male schizophrenic individuals (discovery sample). Cronbach's alpha is presented as measure of internal consistency and also provided for the male replication samples I andII .Association of
PAUSS with the number of proautistic genotypes of the 8‐SNP risk model in the discovery sample; mean ±SEM .PAUSS comparison of extreme groups with high and low numbers of accumulated proautistic genotypes in the discovery sample; binary logistic regression analysis with non‐z‐standardizedPAUSS as dependent variable; mean ±SEM .PAUSS comparison of extreme groups with high and low numbers of accumulated proautistic genotypes in replication sample I of male schizophrenia patients; binary logistic regression analysis; mean ±SEM .PAUSS comparison of extreme groups with high and low numbers of accumulated proautistic genotypes in replication sampleII of male disease control patients; Mann–Whitney U‐test; mean ±SEM .The highly significant correlation of
PAUSS and social support underlines the validity of social support as an autism proxy phenotype; mean ±SEM .Comparison of the extreme groups with high and low numbers of accumulated proautistic genotypes for the autism proxy phenotype social support in the discovery sample; binary logistic regression analysis; mean ±
SEM .Comparison of the extreme groups with high and low numbers of accumulated proautistic genotypes for the autism proxy phenotype social support in the male replication sample
III from general population; binary logistic regression analysis; mean ±SEM . For all replications, P‐values for one‐sided tests are shown.

FXR 1 expression inPBMC of individuals carrying the rs2601GG (low risk; N = 16) versusAA genotype (high risk; N = 27). Data represent mean ± SEM.PBMC microRNA expression was normalized and data are plotted from all 4 miR‐181‐5p members (miR‐181a, miR‐181b, miR‐181c, d miR‐181‐5p). The bottom and top of the box are the first and third quartiles; the band inside the box is the median; the ends of the whiskers represent minimum and maximum values of the data.Sequence homology of all four human mature miR‐181 species shown together with sequences in the broader fragile X gene family containing binding sites for the miR‐181 family (seed matches identified using Target Scan Human and
SFOLD ). The red letters specify seed sequences and seed matches, respectively. Chromosome positions for each seed sequence and seed match are denoted (human genome assemblyGRC h38/hg38).Denoted are ∆∆G values for binding of each of the miR‐181 family members to different 3′
UTR positions. Positions were identified using Target Scan Human andSFOLD and then processed usingPITA algorithm to yield the denoted ∆∆G values. ∆∆G is an energetic score, and the more negative its value, the stronger is the expected binding of the microRNA to the given site (Kertesz et al, 2007).
References
-
- American Psychiatric Association (2000) Diagnostic and Statistical Manual of Mental Disorders, 4th edn, text revision, Washington, DC: American Psychiatric Press;
-
- Ashley CT Jr, Wilkinson KD, Reines D, Warren ST (1993) FMR1 protein: conserved RNP family domains and selective RNA binding. Science 262: 563–566 - PubMed
Publication types
MeSH terms
Substances
LinkOut - more resources
Full Text Sources
Other Literature Sources
Medical

