. 2015 Nov 27;350(6264):aac9462.
doi: 10.1126/science.aac9462.

Principles of connectivity among morphologically defined cell types in adult neocortex

Affiliations

Principles of connectivity among morphologically defined cell types in adult neocortex

Xiaolong Jiang et al. Science. .

Abstract

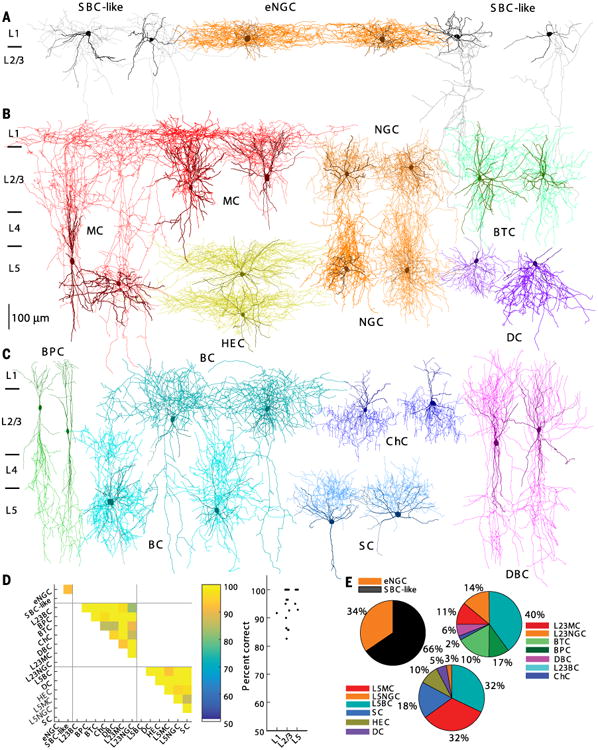
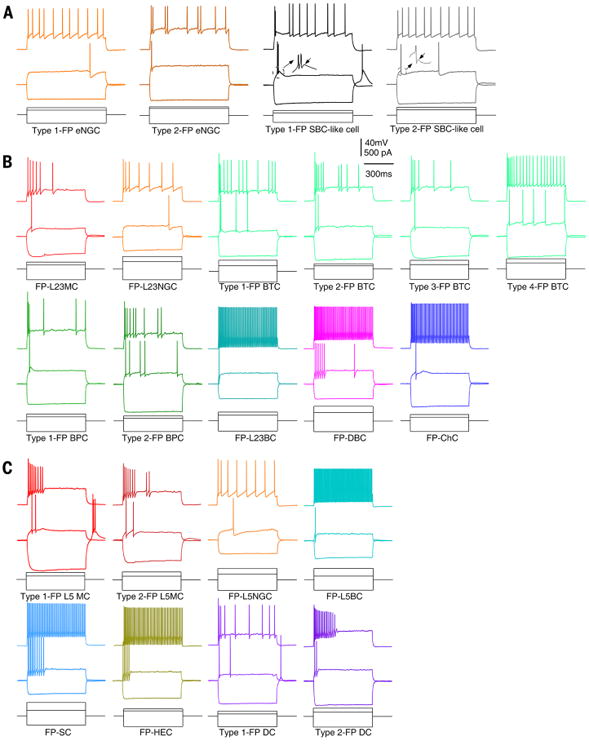
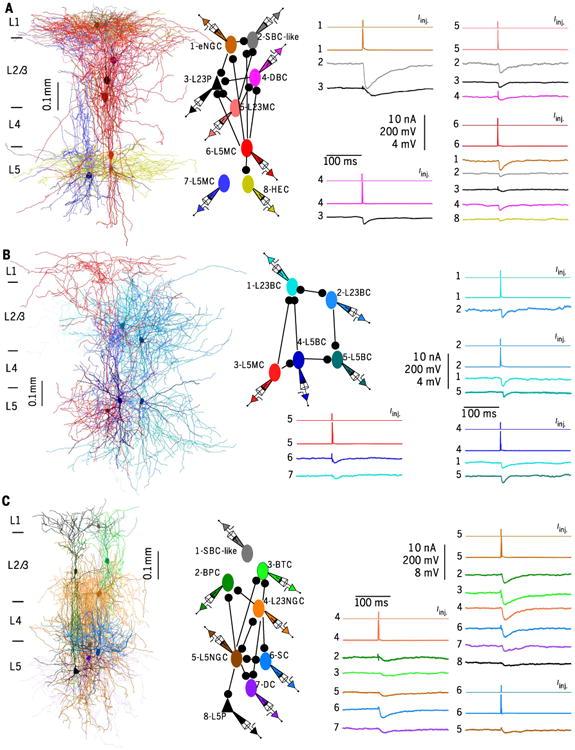
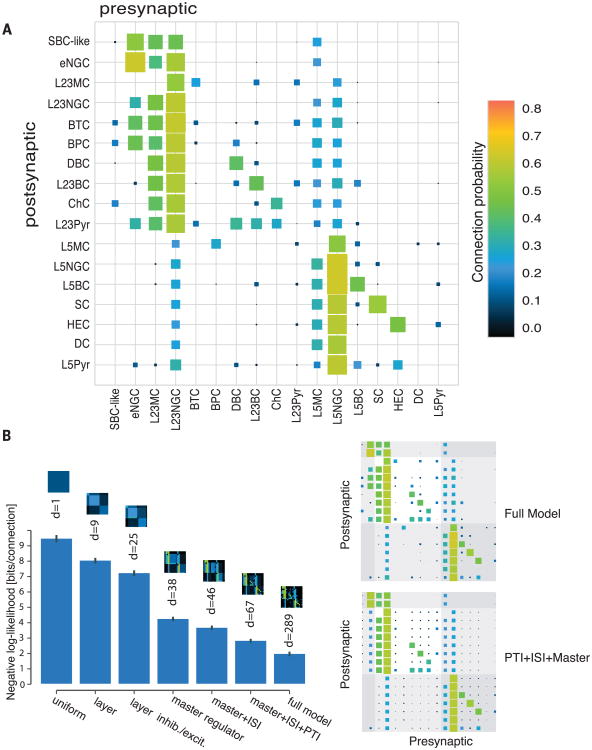
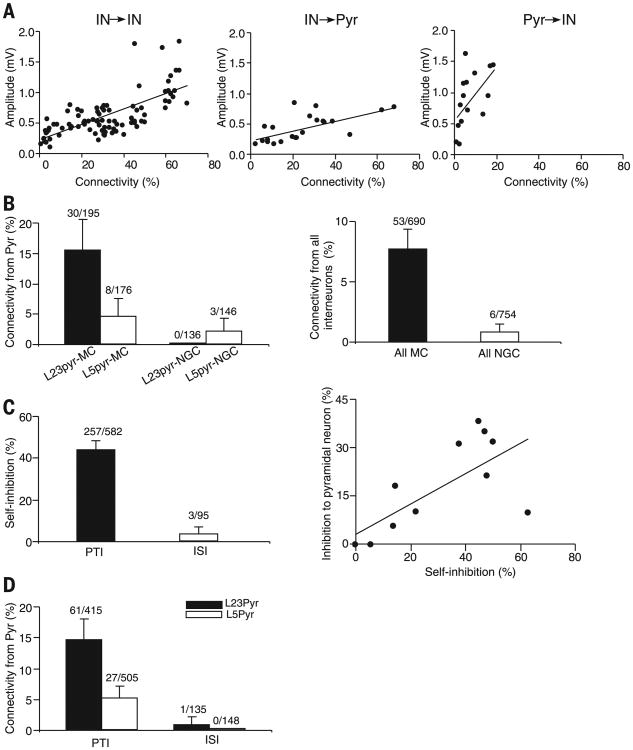
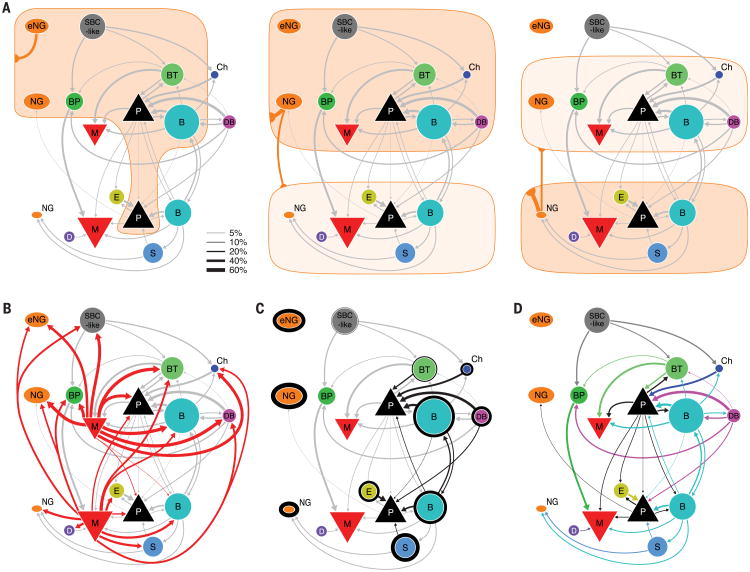
Since the work of Ramón y Cajal in the late 19th and early 20th centuries, neuroscientists have speculated that a complete understanding of neuronal cell types and their connections is key to explaining complex brain functions. However, a complete census of the constituent cell types and their wiring diagram in mature neocortex remains elusive. By combining octuple whole-cell recordings with an optimized avidin-biotin-peroxidase staining technique, we carried out a morphological and electrophysiological census of neuronal types in layers 1, 2/3, and 5 of mature neocortex and mapped the connectivity between more than 11,000 pairs of identified neurons. We categorized 15 types of interneurons, and each exhibited a characteristic pattern of connectivity with other interneuron types and pyramidal cells. The essential connectivity structure of the neocortical microcircuit could be captured by only a few connectivity motifs.


Figures

Fig. 1
Fig. 1. Morphologically distinct GABAergic interneurons in L1, L23, and L5 of V1
(A) Two eNGCs (two middle; axon in dark orange and dendrite in brown) and four SBC-like cells. SBC-like cells on the left (two leftmost; axon in gray) have the axon arborizing mostly within layer 1, whereas SBC-like cells on the right (two rightmost; axon in gray) have the axon projecting mostly toward the deep layers. (B) Four MCs (both L23 and L5; axon in red and dendrite in dark red), four NGCs (L23 and L5; axon in orange and dendrite in brown), two HECs (axon in yellow and dendrite in dark yellow), two BTCs (axon in aquamarine and dendrite in green), and two DCs (axon in blue violet and dendrite in dark blue). (C) Two BPCs (axon in lime and dendrite in green), four BCs (both L23 and L5; axons in cyan and dendrite in dark cyan), two ChCs (axon in blue and dendrite in dark blue), two DBCs (axon in magenta and dendrite in purple), and two SCs (axon in dodge blue and dendrite in dark blue). (D) (Left) Cross-validated classification performance for each pair of cell types within a layer. (Right) Classification performance collapsed within each layer. (E) The proportion of each morphologically distinct type of interneurons.
Fig. 2
Fig. 2. Firing patterns (FPs) of morphologically distinct types of interneurons in V1
(A) Responses to hyperpolarizing, near-threshold, and suprathreshold current injections are shown for L1 eNGCs and SBC-like cells. The eNGCs had two types of firing patterns [LS, orange (leftmost); non-LS, dark orange], and SBC-like cells had two types of firing patterns (burst, black; no burst, gray). The eNGCs can be differentiated from SBC-like cells based on the absence of ADPs (see inset). (B) Responses to hyperpolarizing, near-threshold and suprathreshold current injections are shown for L23MCs, L23NGCs, BTCs, BPCs, L23BCs, DBCs, and ChCs. BTCs had four major types of firing patterns with subtle differences, and BPCs had two types of firing patterns that differ in the capability of burst. (C) Responses to hyperpolarizing, near-threshold, and suprathreshold current injections are shown for L5MCs, L5NGCs, L5BCs, SCs, HECs, and DCs. L5MCs and DCs had two types of firing patterns with subtle differences.The intrinsic membrane properties for each type of L1, L23, and L5 interneurons are presented in table S1.
Fig. 3
Fig. 3. Connections between morphologically distinct types of interneurons in V1
Right-most vertical scale bars from top to bottom show amplitudes of current injection (Iinj. in nA), APs (mV), uIPSPs (mV). (A) (Left) Connections between eight simultaneously recorded neurons, including one eNGC, one SBClike cell, one DBC, one L23MC, one L23Pyr, one HEC, and two L5MCs. Each neuron was spatially separated in fig. S7A. (Middle) Connection diagram of the eight reconstructed neurons. (Right) APs elicited in presynaptic neurons and response traces of IPSPs evoked in postsynaptic neurons for each connection. (B) (Left) Connections between five simultaneously recorded neurons, including two L23BCs, two L5BCs, and one L5MC. Each neuron was spatially separated in fig. S7B. (Middle) Connection diagram of the five neurons. (Right) APs elicited in presynaptic neurons and response traces of IPSPs evoked in postsynaptic neurons for each connection. (C) (Left) Connections between eight simultaneously recorded neurons, including one SBC-like cell, one BPC, one BTC, one L23NGC, one L5Pyr, one L5NGC, one DC, and one SC. Each neuron was spatially separated in fig. S7C. (Middle) Connection diagram of the eight neurons. (Right) APs elicited in presynaptic neurons and response traces of IPSPs evoked in postsynaptic neurons for each connection.
Fig. 4
Fig. 4. Connectivity matrix for adult mouse V1
(A) Color-coded matrix showing the probability of finding a connected pair of neurons between two specific types within and across layers. For total connections found/total connections tested for each type of connection and the mean amplitude of the connections, see fig. S14, table S6, and the supplementary text. (B) A simple model incorporating three connectivity rules (master, ISI, and PTI) can explain most of the observed data. Bar height corresponds to the negative likelihood of the model per cell pair in bits, d denotes the degrees of freedom, and error bars show the standard deviation over 50 bootstrapped data sets. Models increase in complexity from left to right; pictograms on top of the bars show the corresponding connectivity matrix. The first four models assume that the connection probability is uniform, uniform within a layer, and uniform within a layer and excitatory/inhibitory neuron, respectively. The next three models include the connectivity rules. The full model has an individual connection probability for each type of connection. The Hinton plots on the right depict the connection probabilities according to the full model and the model including all three connectivity principles.
Fig. 5
Fig. 5. Principles of connectivity in neocortical circuits
(A) Connection probability correlates with mean synaptic strength. Plot of the mean amplitudes of uIPSPs or uEPSPs of each type of connection against the connectivity rate for each type of connection [r(96) = 0.70, P < 0.0001 for interneuron→interneuron connection; r(20) = 0.65, P = 0.001 for interneuron→pyramidal neuron connection; r(14) = 0.56, P = 0.03 or pyramidal neuron→interneuron connection]. (B) (Left) Connectivity rate from excitatory cells to MCs and NGCs. (Right) Connectivity rate from all (non-MC, non-NGC) interneurons to MCs and NGCs. (C) (Left) The self-connections of PTI occurs in 44.2% (257/582; pooling across all PTIs), whereas self-inhibition between ISIs occurs only in 3.2% (3/95) of tested connections (GLM with factor of class of interneuron (PTI vs. ISI); P < 0.0001). (Right) There is a strong positive correlation between inhibition of pyramidal neurons and self-inhibition [r(11) = 0.72; p = 0.01]. Note that origin contains three points. (D) Pyramidal cells provided input to PTIs in 14.7% (61/415; pooling across all PTIs, from L23Pyr) and 5.3% (27/505, from L5Pyr) of the tested connections, whereas pyramidal cells rarely provided input to ISIs (0.74%, 1/135; 0.0%, 0/148 for L23 and L5 pyramidal neurons, respectively; GLM with factors of class of interneuron (PTI vs. ISI) and layer of pyramidal neuron; effect of interneuron class: P = 0.005; layer: P = 0.009; interaction: P = 0.76).
Fig. 6
Fig. 6. Wiring diagram of V1 microcircuit
Different connectivity panels highlight different connectivity rules. Connectivity rates are indicated by line width (see legend). Connections with at least 5% connectivity rate are shown. Area of symbols indicate proportion of each cell type in the respective layer. Area of triangle depicting pyramidal cells does not represent proportion of pyramidal cells. (A) These diagrams illustrate volume transmission by eNGCs (left), L23NGCs (middle), and L5NGCs (right). The connections made by other neurons are shown in gray. (B) Connection of MCs to other cell types. (C) Self-inhibition is illustrated by the outline around each cell type (thickness illustrates the connectivity rate). Inhibition to pyramidal cells is highlighted in black. Connections from NGCs and MCs are omitted for clarity. (D) Connectivity between interneuron types and pyramidal cells is highlighted. Color of arrow is according to presynaptic cell type. Self-inhibition, volume transmission, and connections from MCs are omitted for clarity.

Comment in

References

    1. Markram H, et al. Interneurons of the neocortical inhibitory system. Nat Rev Neurosci. 2004;5:793–807. doi: 10.1038/nrn1519. - DOI - PubMed
    1. DeFelipe J, et al. New insights into the classification and nomenclature of cortical GABAergic interneurons. Nat Rev Neurosci. 2013;14:202–216. - PMC - PubMed
    1. Dumitriu D, Cossart R, Huang J, Yuste R. Correlation between axonal morphologies and synaptic input kinetics of interneurons from mouse visual cortex. Cereb Cortex. 2007;17:81–91. doi: 10.1093/cercor/bhj126. - DOI - PubMed
    1. Ascoli GA, et al. Petilla terminology: Nomenclature of features of GABAergic interneurons of the cerebral cortex. Nat Rev Neurosci. 2008;9:557–568. doi: 10.1038/nrn2402. - DOI - PMC - PubMed
    1. Jiang X, Wang G, Lee AJ, Stornetta RL, Zhu JJ. The organization of two new cortical interneuronal circuits. Nat Neurosci. 2013;16:210–218. doi: 10.1038/nn.3305. - DOI - PMC - PubMed

Publication types

MeSH terms