

T Cell Dynamic Activation and Functional Analysis in Nanoliter Droplet Microarray
- PMID: 26613065
- PMCID: PMC4657871
- DOI: 10.4172/2155-9899.1000334
T Cell Dynamic Activation and Functional Analysis in Nanoliter Droplet Microarray
Abstract
Objective: Characterization of the heterogeneity in immune reactions requires assessing dynamic single cell responses as well as interactions between the various immune cell subsets. Maturation and activation of effector cells is regulated by cell contact-dependent and soluble factor-mediated paracrine signalling. Currently there are few methods available that allow dynamic investigation of both processes simultaneously without physically constraining non-adherent cells and eliminating crosstalk from neighboring cell pairs. We describe here a microfluidic droplet microarray platform that permits rapid functional analysis of single cell responses and co-encapsulation of heterotypic cell pairs, thereby allowing us to evaluate the dynamic activation state of primary T cells.
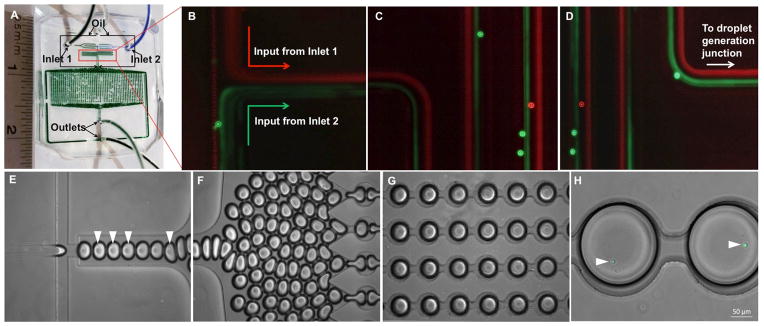
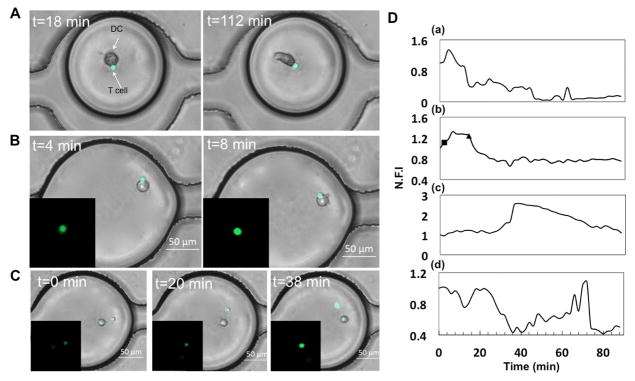
Methods: The microfluidic droplet platform enables generation and docking of monodisperse nanoliter volume (0.523 nl) droplets, with the capacity of monitoring a thousand droplets per experiment. Single human T cells were encapsulated in droplets and stimulated on-chip with the calcium ionophore ionomycin. T cells were also co-encapsulated with dendritic cells activated by ovalbumin peptide, followed by dynamic calcium signal monitoring.
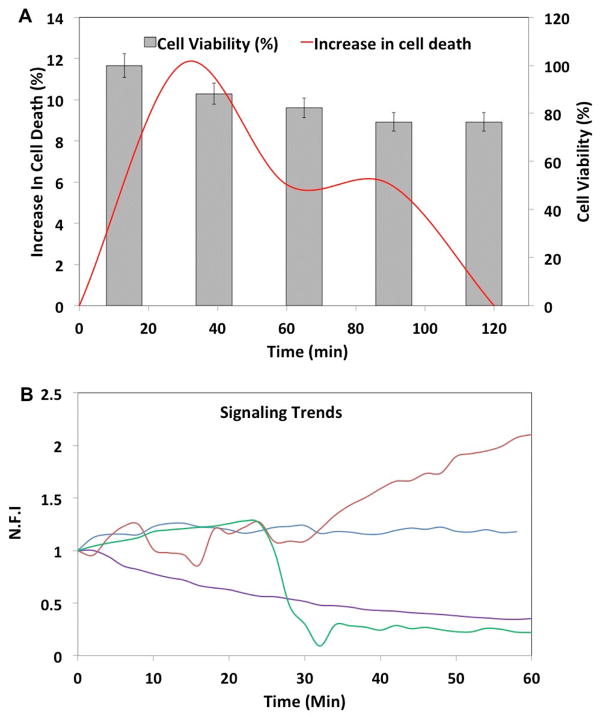
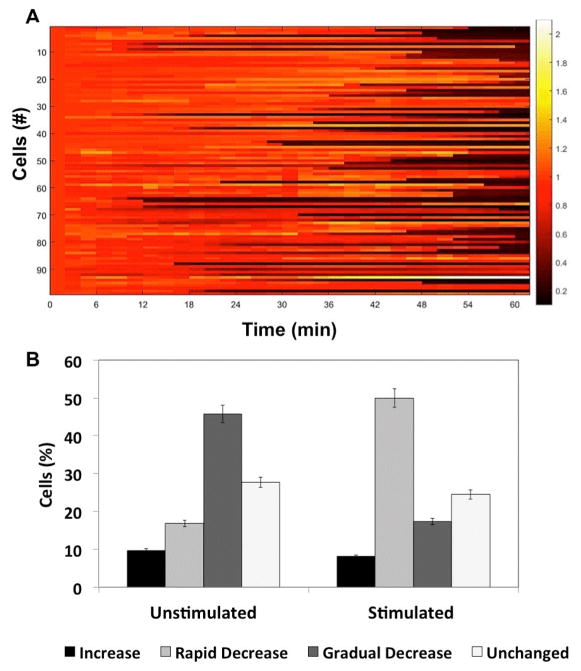
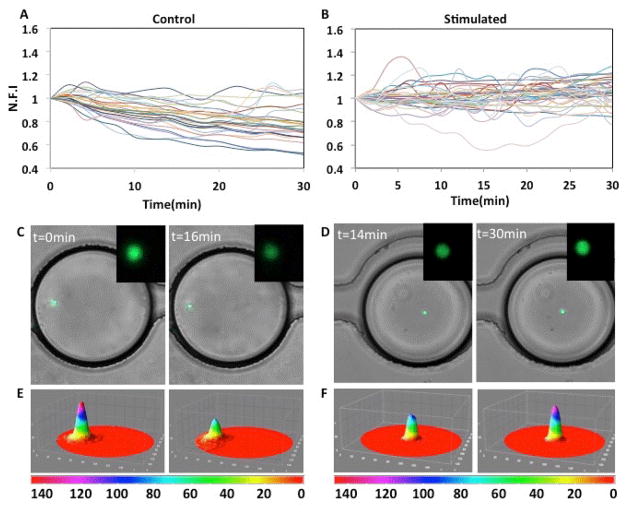
Results: Ionomycin-stimulated cells depicted fluctuation in calcium signalling compared to control. Both cell populations demonstrated marked heterogeneity in responses. Calcium signalling was observed in T cells immediately following contact with DCs, suggesting an early activation signal. T cells further showed non-contact mediated increase in calcium level, although this response was delayed compared to contact-mediated signals.
Conclusions: Our results suggest that this nanoliter droplet array-based microfluidic platform is a promising technique for assessment of heterogeneity in various types of cellular responses, detection of early/delayed signalling events and live cell phenotyping of immune cells.
Keywords: Calcium; Dynamics; Heterogeneity; Immune response; Lymphocytes; Microfluidics; Single cell analysis; Time-lapse microscopy.
Figures
Similar articles
-
Dynamic analysis of immune and cancer cell interactions at single cell level in microfluidic droplets.Biomicrofluidics. 2016 Oct 12;10(5):054115. doi: 10.1063/1.4964716. eCollection 2016 Sep. Biomicrofluidics. 2016. PMID: 27795747 Free PMC article.
-
Automated Droplet-Based Microfluidic Platform for Multiplexed Analysis of Biochemical Markers in Small Volumes.Anal Chem. 2019 Apr 16;91(8):5133-5141. doi: 10.1021/acs.analchem.8b05689. Epub 2019 Mar 27. Anal Chem. 2019. PMID: 30834743
-
Dynamic Analysis of Human Natural Killer Cell Response at Single-Cell Resolution in B-Cell Non-Hodgkin Lymphoma.Front Immunol. 2017 Dec 14;8:1736. doi: 10.3389/fimmu.2017.01736. eCollection 2017. Front Immunol. 2017. PMID: 29312292 Free PMC article.
-
Cooperation of liver cells in health and disease.Adv Anat Embryol Cell Biol. 2001;161:III-XIII, 1-151. doi: 10.1007/978-3-642-56553-3. Adv Anat Embryol Cell Biol. 2001. PMID: 11729749 Review.
-
Droplet microfluidics--a tool for single-cell analysis.Angew Chem Int Ed Engl. 2012 Dec 3;51(49):12176-92. doi: 10.1002/anie.201200460. Epub 2012 Nov 23. Angew Chem Int Ed Engl. 2012. PMID: 23180509 Review.
Cited by
-
Microfluidics-Based Single-Cell Research for Intercellular Interaction.Front Cell Dev Biol. 2021 Aug 12;9:680307. doi: 10.3389/fcell.2021.680307. eCollection 2021. Front Cell Dev Biol. 2021. PMID: 34458252 Free PMC article. Review.
-
Probing T-cell activation in nanoliter tumor co-cultures using membrane displacement trap arrays.Integr Biol (Camb). 2024 Jan 23;16:zyae014. doi: 10.1093/intbio/zyae014. Integr Biol (Camb). 2024. PMID: 39074471 Free PMC article.
-
Rapid video-based deep learning of cognate versus non-cognate T cell-dendritic cell interactions.Sci Rep. 2022 Jan 11;12(1):559. doi: 10.1038/s41598-021-04286-5. Sci Rep. 2022. PMID: 35017558 Free PMC article.
-
Measuring single-cell protein secretion in immunology: Technologies, advances, and applications.Eur J Immunol. 2021 Jun;51(6):1334-1347. doi: 10.1002/eji.202048976. Epub 2021 Apr 1. Eur J Immunol. 2021. PMID: 33734428 Free PMC article. Review.
-
A Microfluidic Approach for Probing Heterogeneity in Cytotoxic T-Cells by Cell Pairing in Hydrogel Droplets.Micromachines (Basel). 2022 Nov 4;13(11):1910. doi: 10.3390/mi13111910. Micromachines (Basel). 2022. PMID: 36363930 Free PMC article.
References
Grants and funding
LinkOut - more resources
Full Text Sources
Other Literature Sources