. 2016 Jun;10(6):1456-70.
doi: 10.1038/ismej.2015.209. Epub 2015 Nov 27.

Synbiotic approach restores intestinal homeostasis and prolongs survival in leukaemic mice with cachexia

Affiliations

Synbiotic approach restores intestinal homeostasis and prolongs survival in leukaemic mice with cachexia

Laure B Bindels et al. ISME J. 2016 Jun.

Abstract

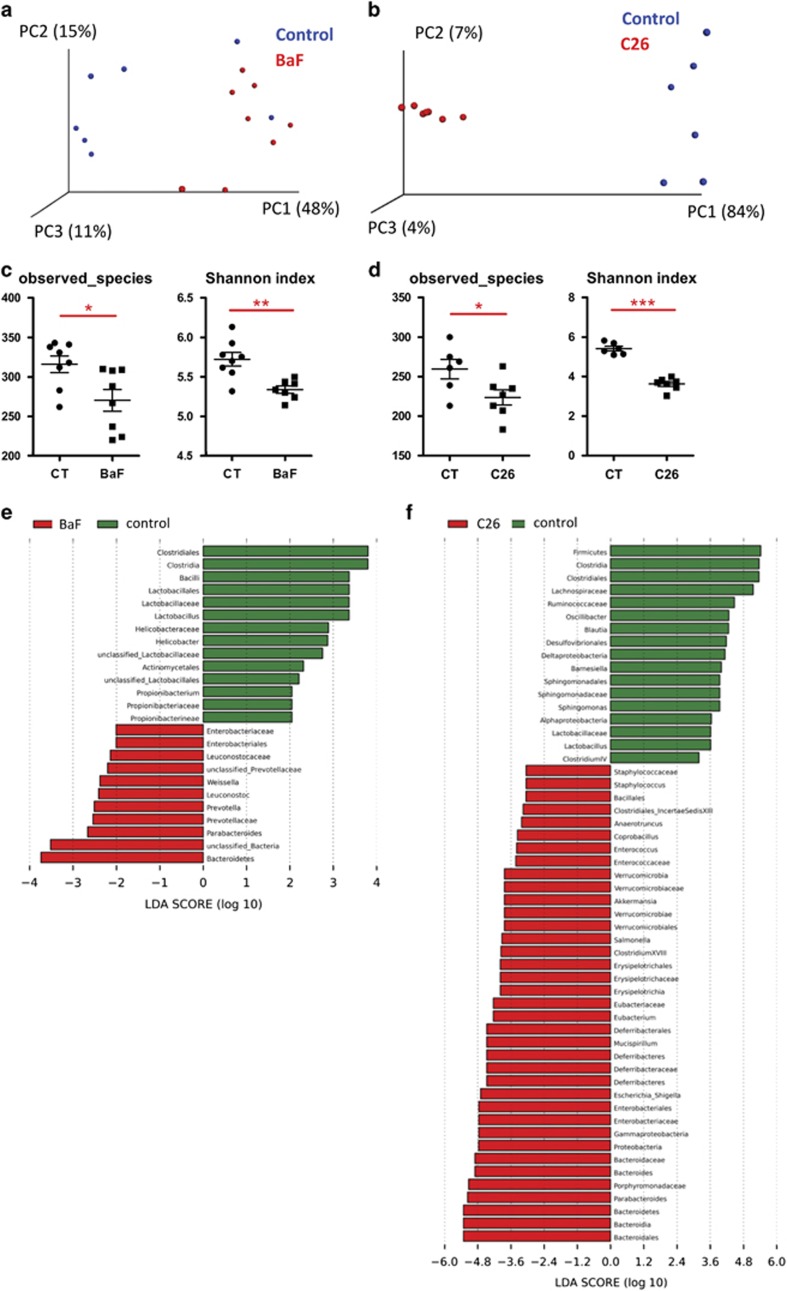
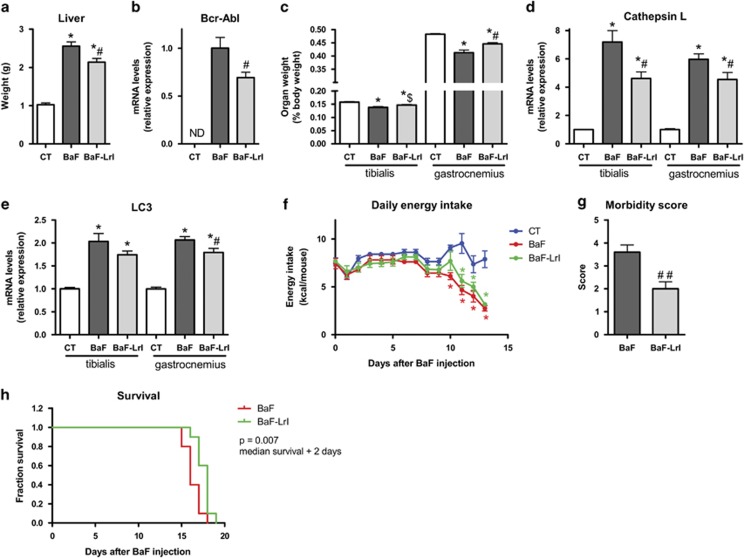
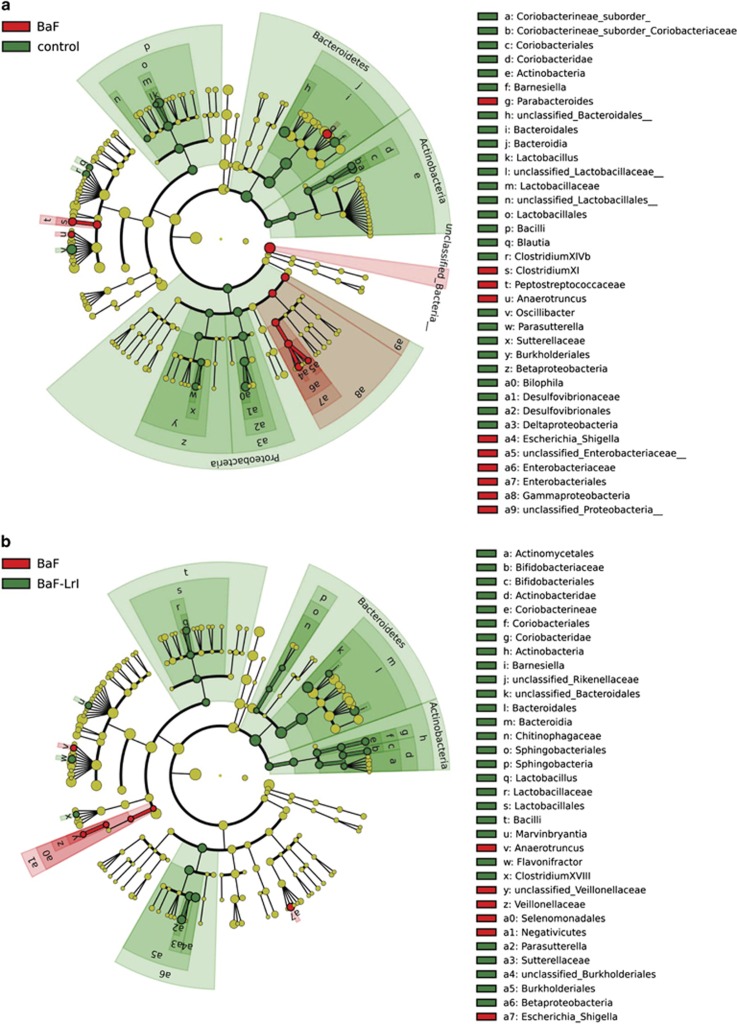
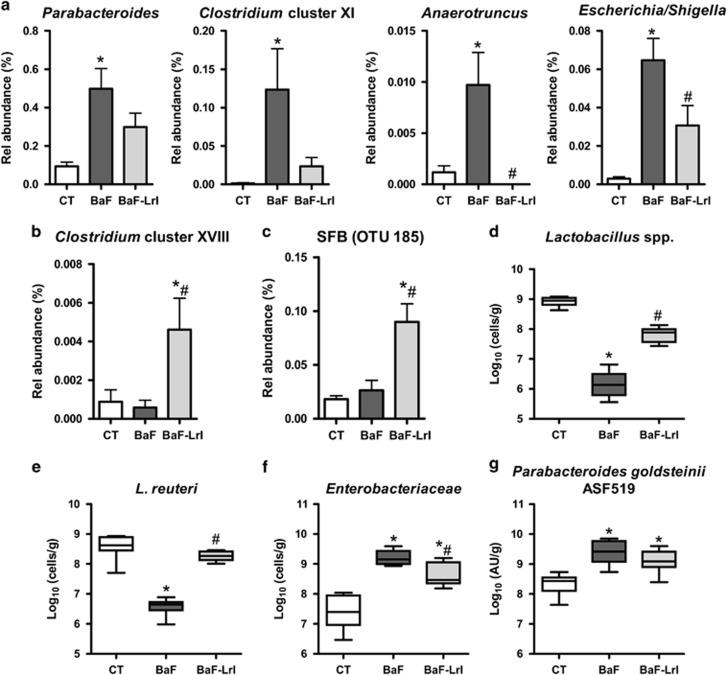
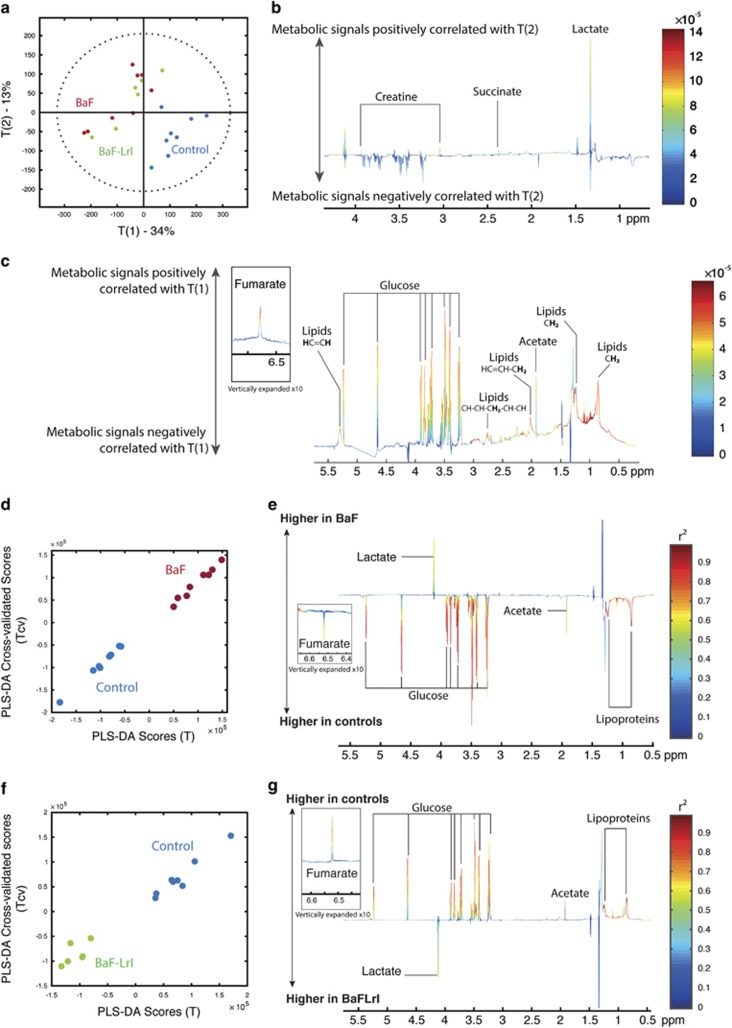
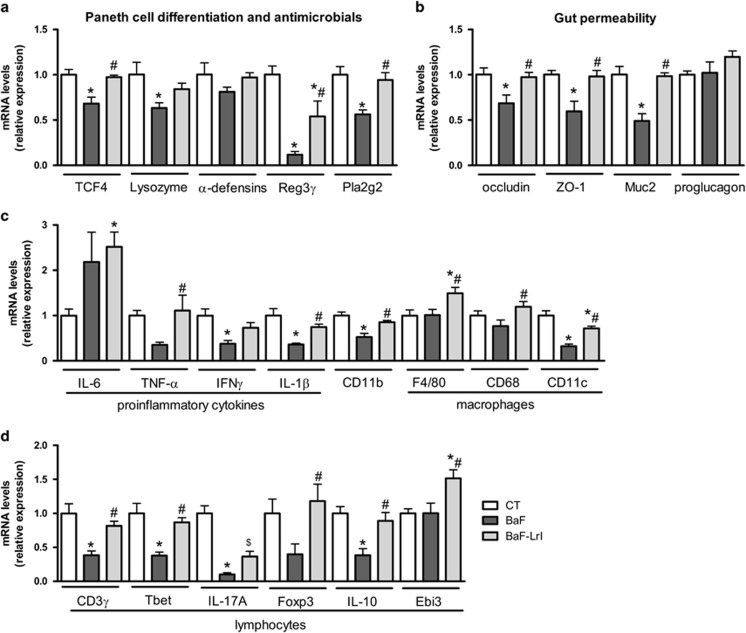
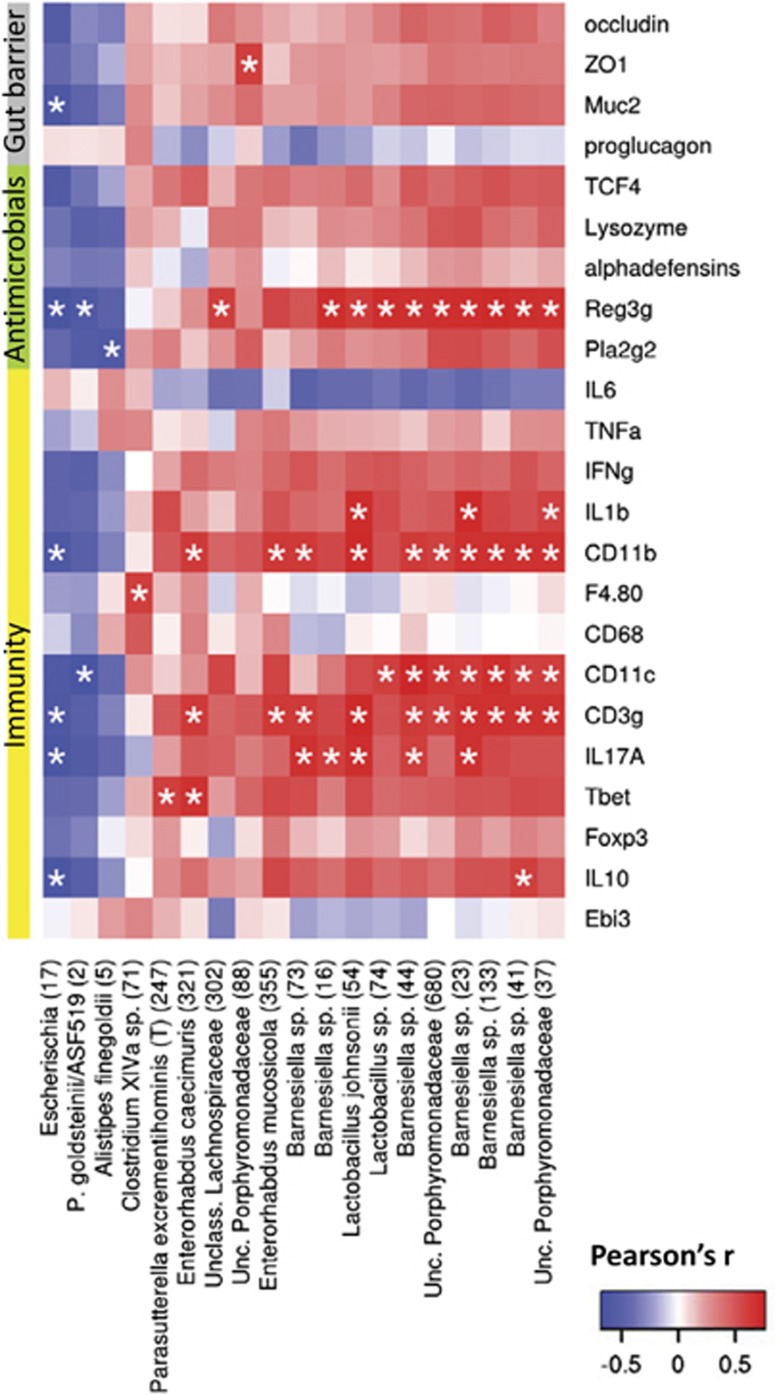
Cancer cachexia is a multifactorial syndrome that includes muscle wasting and inflammation. As gut microbes influence host immunity and metabolism, we investigated the role of the gut microbiota in the therapeutic management of cancer and associated cachexia. A community-wide analysis of the caecal microbiome in two mouse models of cancer cachexia (acute leukaemia or subcutaneous transplantation of colon cancer cells) identified common microbial signatures, including decreased Lactobacillus spp. and increased Enterobacteriaceae and Parabacteroides goldsteinii/ASF 519. Building on this information, we administered a synbiotic containing inulin-type fructans and live Lactobacillus reuteri 100-23 to leukaemic mice. This treatment restored the Lactobacillus population and reduced the Enterobacteriaceae levels. It also reduced hepatic cancer cell proliferation, muscle wasting and morbidity, and prolonged survival. Administration of the synbiotic was associated with restoration of the expression of antimicrobial proteins controlling intestinal barrier function and gut immunity markers, but did not impact the portal metabolomics imprinting of energy demand. In summary, this study provided evidence that the development of cancer outside the gut can impact intestinal homeostasis and the gut microbial ecosystem and that a synbiotic intervention, by targeting some alterations of the gut microbiota, confers benefits to the host, prolonging survival and reducing cancer proliferation and cachexia.


Figures

Figure 1
Figure 1
Shifts in the composition of the gut microbiota in the BaF and C26 models. (a, b) Principal coordinate analysis of the Morisita-Horn beta-diversity index computed based on the OTU table. (c, d) Alpha-diversity indexes in cancer-bearing mice vs controls (CT). The observed species represent an index of richness, and the Shannon index takes into account the richness and evenness. (e, f) LDA scores in red for the taxa enriched in cancer-bearing mice and in green for the taxa enriched in control mice. N=6–8, *P<0.05, **P<0.01, ***P<0.001.
Figure 2
Figure 2
L. gasseri evokes pro-Th1 responses, whereas L. reuteri appears to possess more anti-inflammatory properties. Cytokine levels in the medium after co-culture of human PBMC and Lactobacillus species (two independent experiments involving a total of nine PBMC donors). *P<0.01 vs medium, #P<0.01 vs L. gasseri 311476.
Figure 3
Figure 3
The synbiotic approach reduces hepatic cancer cell accumulation and cachectic features in leukaemic mice. (a) Liver weight. (b) Bcr-Abl mRNA expression in the liver. ND, not detected. (c) Muscle weights. (d, e) mRNA expression of atrophy markers in the tibialis and gastrocnemius muscle. (f) Daily energy intake. (g) Morbidity score performed at day 14. (h) Kaplan–Meier curve showing the survival fractions analysed by the log-rank test (P=0.007). N=8 for (af) and n=10 for (g) and (h), *P<0.05 vs control, #P<0.05 vs BaF, ##P<0.01 vs BaF, $P=0.06 vs BaF.
Figure 4
Figure 4
The synbiotic approach changes the gut microbiota composition. (a) LEfSe cladogram in red for the taxa enriched in BaF mice and in green for the taxa enriched in control mice. (b) LEfSe cladogram in red for the taxa enriched in BaF mice and in green for the taxa enriched in BaF-LrI mice. N=8.
Figure 5
Figure 5
The synbiotic approach changes the abundance of several bacterial taxa. (a) Species enriched in BaF mice according to the LEfSe analysis. (b) Clostridium cluster XVIII. (c) SFB/OTU 185. (dg) Bacteria levels in the caecal content of BaF mice fed or not the synbiotic, as determined by qPCR. AU, arbitrary units. N=8, *P<0.05 vs control, #P<0.05 vs BaF.
Figure 6
Figure 6
Cancer progression changes the portal metabolome. (a) Principal coordinate analysis plot of the metabolomics profiles derived from portal plasma of control (blue), BaF (red) and BaF-LrI (green) mice, and associated loadings of PC2 (b) and PC1 (c). Pairwise O-PLS-DA comparison showing the calculated scores (x axis) against the cross-validated scores (y axis) and their associated loading coefficients. The weights of the variables are color-coded according to the square of the O-PLS-DA correlation coefficients. (d, e) Controls vs BaF and (f, g) controls vs BaF-LrI. N=6–8.
Figure 7
Figure 7
The synbiotic approach improves intestinal immune and barrier biomarkers in leukaemic mice. (a) mRNA expression of markers involved in Paneth cell differentiation and antimicrobial proteins. (b) mRNA expression of markers involved in gut permeability. (c) mRNA expression of immune markers related to inflammation, innate immunity (CD11b) and macrophages. (d) mRNA expression of immune markers related to lymphocytes (CD3γ) Th1 (Tbet), Th17 (IL-17A) and Treg (Foxp3, IL-10, Ebi3) cells. N=7–8, *P<0.05 vs control, #P<0.05 vs BaF.
Figure 8
Figure 8
Synbiotic-mediated improvements in intestinal immune and barrier biomarkers correlate with microbial changes. Heat map representation of the Pearson's r correlation coefficient between intestinal biomarkers and significantly affected phylotypes. The closest known taxon is indicated with the OTU number within brackets. *Adjusted P<0.05.

References

    1. Argiles JM, Busquets S, Stemmler B, Lopez-Soriano FJ. (2014). Cancer cachexia: understanding the molecular basis. Nat Rev Cancer 14: 754–762. - PubMed
    1. Arpaia N, Campbell C, Fan X, Dikiy S, van der Veeken J, deRoos P et al. (2013). Metabolites produced by commensal bacteria promote peripheral regulatory T-cell generation. Nature 504: 451–455. - PMC - PubMed
    1. Arthur JC, Perez-Chanona E, Muhlbauer M, Tomkovich S, Uronis JM, Fan TJ et al. (2012). Intestinal inflammation targets cancer-inducing activity of the microbiota. Science 338: 120–123. - PMC - PubMed
    1. Atarashi K, Tanoue T, Oshima K, Suda W, Nagano Y, Nishikawa H et al. (2013). Treg induction by a rationally selected mixture of Clostridia strains from the human microbiota. Nature 500: 232–236. - PubMed
    1. Baracos VE, Pichard C, Attaix D. (2012). Survival: the relevant primary outcome for nutrition therapy in cancer patients. Curr Opin Clin Nutr Metab Care 15: 211–212. - PubMed

MeSH terms