. 2015 Nov;15(3):731-741.
doi: 10.1016/j.scr.2015.10.014. Epub 2015 Oct 24.

Rapid generation of sub-type, region-specific neurons and neural networks from human pluripotent stem cell-derived neurospheres

Affiliations

Rapid generation of sub-type, region-specific neurons and neural networks from human pluripotent stem cell-derived neurospheres

Aynun N Begum et al. Stem Cell Res. 2015 Nov.

Abstract

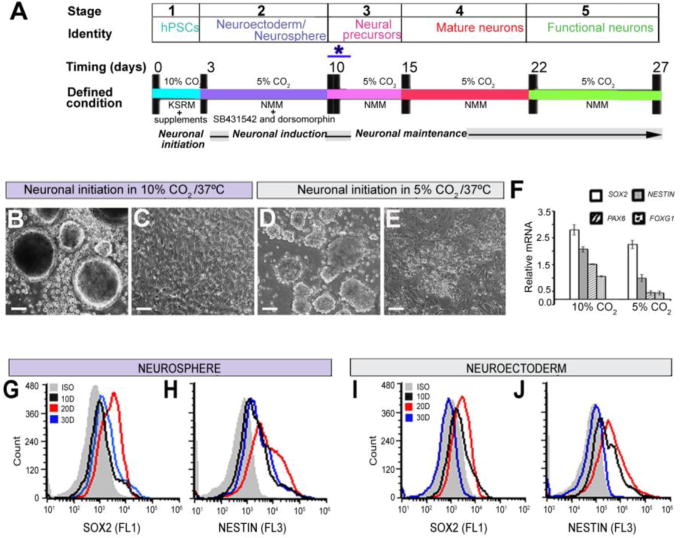
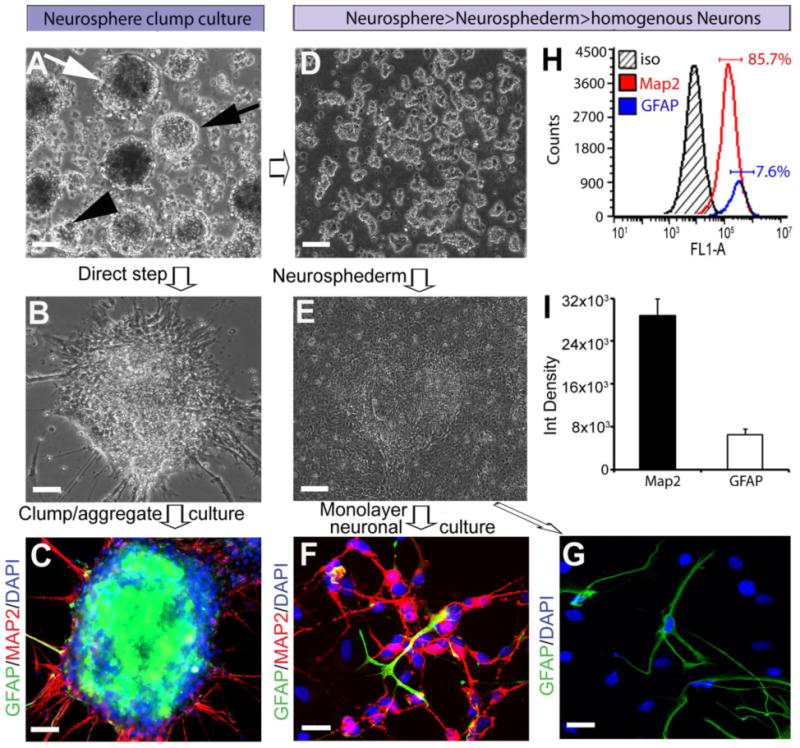
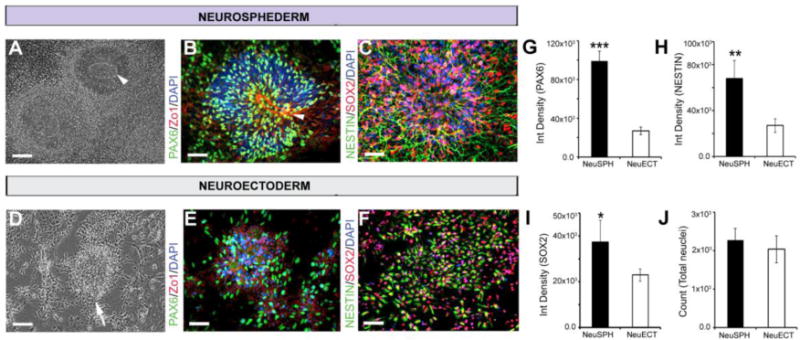
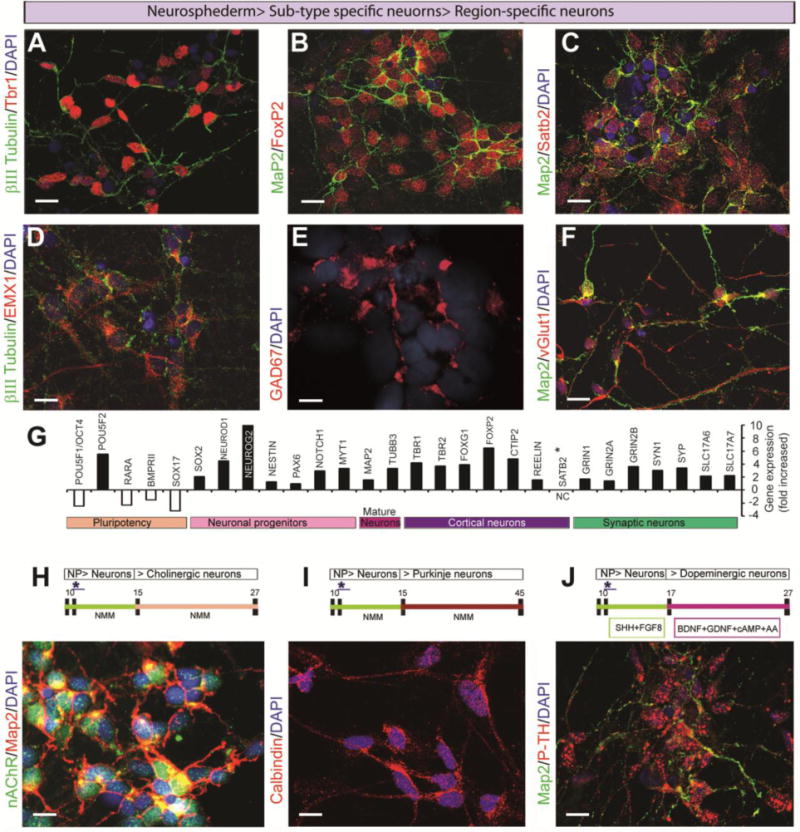
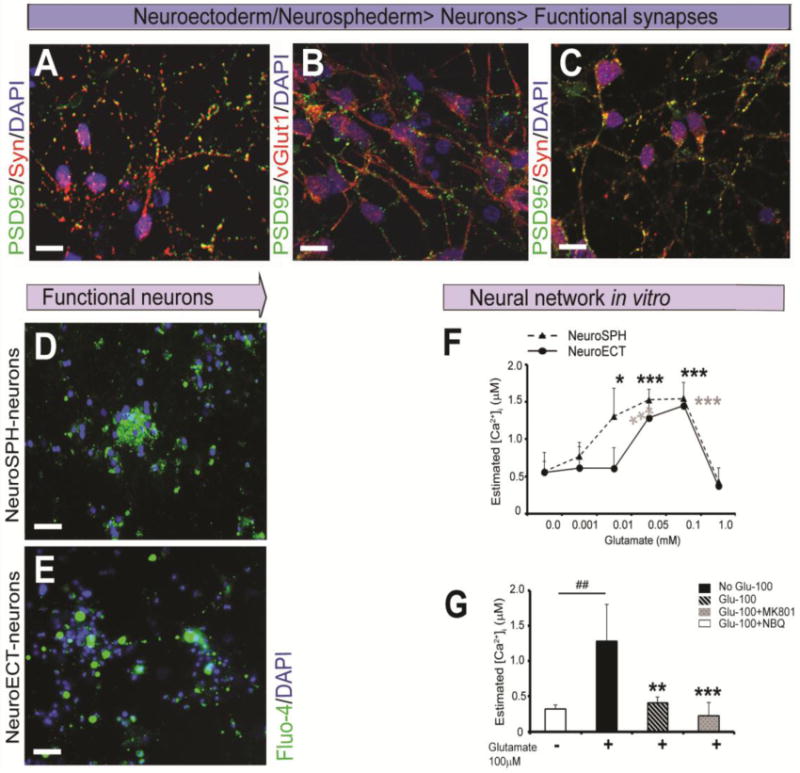
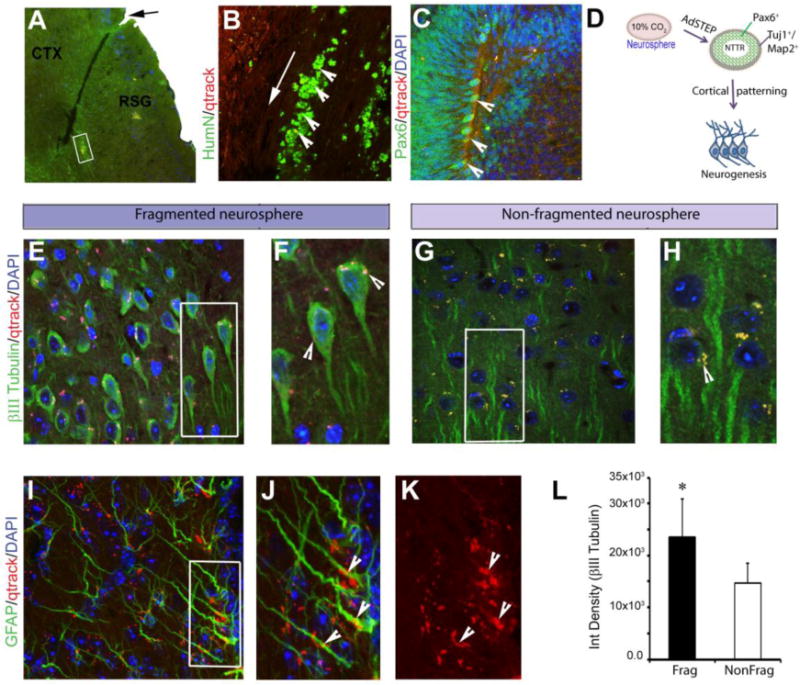
Stem cell-based neuronal differentiation has provided a unique opportunity for disease modeling and regenerative medicine. Neurospheres are the most commonly used neuroprogenitors for neuronal differentiation, but they often clump in culture, which has always represented a challenge for neurodifferentiation. In this study, we report a novel method and defined culture conditions for generating sub-type or region-specific neurons from human embryonic and induced pluripotent stem cells derived neurosphere without any genetic manipulation. Round and bright-edged neurospheres were generated in a supplemented knockout serum replacement medium (SKSRM) with 10% CO2, which doubled the expression of the NESTIN, PAX6 and FOXG1 genes compared with those cultured with 5% CO2. Furthermore, an additional step (AdSTEP) was introduced to fragment the neurospheres and facilitate the formation of a neuroepithelial-type monolayer that we termed the "neurosphederm". The large neural tube-type rosette (NTTR) structure formed from the neurosphederm, and the NTTR expressed higher levels of the PAX6, SOX2 and NESTIN genes compared with the neuroectoderm-derived neuroprogenitors. Different layers of cortical, pyramidal, GABAergic, glutamatergic, cholinergic neurons appeared within 27 days using the neurosphederm, which is a shorter period than in traditional neurodifferentiation-protocols (42-60 days). With additional supplements and timeline dopaminergic and Purkinje neurons were also generated in culture too. Furthermore, our in vivo results indicated that the fragmented neurospheres facilitated significantly better neurogenesis in severe combined immunodeficiency (SCID) mouse brains compared with the non-fragmented neurospheres. Therefore, this neurosphere-based neurodifferentiation protocol is a valuable tool for studies of neurodifferentiation, neuronal transplantation and high throughput screening assays.

Keywords: Human embryonic stem cells; Induced pluripotent stem cells; Neuroectoderm; Neurogenesis; Neurons; Neurosphere.


Figures

Figure 1
Figure 1
Flow diagram of the neurodifferentiation procedure from h/iPSCs and the characterization and stability of the neurospheres using defined culture conditions. (A) The five major stages and the corresponding cell types generated from these cultures. Neuronal initiation with SKSRM and 10% CO2 at 37°C takes 3 days. Neuronal induction took one week in NMM with SB431542 and dorsomorphin in 5% CO2 at 37°C. The AdSTEP (*) procedure was introduced to generate the neurosphederm from the neurosphere. After generating the neurosphederm and plating the cells, distinct neuronal rosettes appeared at 3–5 days in culture, and mature neurons and other sub type specific neurons appeared at 15–22 days in culture. At day 27, the neurons have fully functional synapses, as shown in the functional assays. (B, D) Generation of neurospheres from h/iPSCs with 10% and 5% CO2, respectively. (C, E) Generation of the neurosphederm from h/iPSCs with 10% and 5% CO2, respectively. (F). Graph of the relative expression levels of the SOX2, NESTIN, PAX6 and FOXG1 genes from neurospheres with 10% and 5% CO2, respectively. The data are presented as the means ± SD. (G, H & I, J) Flow cytometry histogram of the time-dependent expression of SOX2 and NESTIN in the neurosphere and neuroectoderm cultures, respectively. Scale bars, 50 μm.
Figure 2
Figure 2
Comparison of neurogenesis with or without the AdSTEP mechanical procedure. (A). One week after neuronal induction, round, different sized spheres were observed. The arrows indicate the different shapes of the neurospheres, including a contrast sphere (white arrow), bright neurosphere (black arrow), and small sized spheres (black arrowhead). Scale bar, 100 μm. (B) Neuronal processes emanating from the neurospheres were observed after transferring the neurospheres to polyornithine/laminin-coated plates. Scale bar, 50 μm. (C) The neuronal cultures of the neurospheres (21 days) remained as clumps. These neurons express the mature neuronal marker MAP2 (red) and also the astrocyte marker GFAP (green), but we were unable to identify the neuronal or astrocytic morphology due to the tight clumping of the cells in the neurosphere. Scale bar, 50 μm. (D) The AdSTEP procedure (see materials and methods for details) dissociated the neurosphere into neurosphere fragments. Scale bar, 100 μm. (E) After the AdSTEP procedure, a neuroepithelial-type sheet appeared in the culture, which is termed the “neurosphederm”. Scale bars, 100 μm. (F) The neurosphederm was then transferred onto polyornithine/laminin-coated plates and neural stem cells were generated as single monolayers of cells. The cells were double stained with MAP2 and GFAP (red and green, respectively) antibodies. (G) The astrocyte marker GFAP (green) was observed in these cultures. Scale bars, 50 μm. The nuclei are stained with DAPI (blue) and the images were captured by confocal microscopy. (H) The flow histogram of MAP2 and GFAP indicated that 85.7% of the cells were MAP2-positive and approximately 8% were GFAP-positive. (I) The bar graph showed the quantification of the MAP2/GFAP-positive cells using the ImageJ software.
Figure 3
Figure 3
Comparison of the expression of neuronal progenitor genes in the neurosphederm and neuroectoderm. (A) A distinct NTTR structure appeared (white arrowhead) 10 days after neuronal induction. (B) PAX6/Zo1 staining of the neurosphederm- and neuroectoderm-derived neuronal cultures and (C) SOX2/NESTIN staining of the neuroectoderm cultures. Scale bars, 100 and 50 μm, respectively. (D) The neuroectoderm-derived neuronal cultures lacked NTTR structures. (E) PAX6/Zo1 staining of the neuroectoderm-derived cells, and (F) SOX2/NESTIN staining of the neuroectoderm-derived cells. Scale bars, 100 and 50 μm, respectively. The nuclei are stained with DAPI. The bar graph shows the ImageJ quantification of (G–I) the PAX6-, NESTIN- and SOX2-positive cells. (J) The DAPI quantification represents the total number of cells in these experiments, which confirmed that the cultures were similarly confluent. ISO and D represent the isotype control and number of days, respectively.
Figure 4
Figure 4
Generation of sub-type- and region-specific neurons from the neurospheres. The confocal images of the cortical layer-specific neurons were produced by double staining with (A) βIII tubulin/TBR1 (green/red), (B) MAP2/FOXP2 (green/red), and (C) cortical layer 2 (SATB2, red). These neurons appeared over 2 weeks after neuronal induction, and (D) cortical pyramidal neurons (EMX1, red) also appeared from the βIII tubulin-stained (green) neurosphederm-derived neuronal cultures. (E) Interneuron expression was analyzed by staining with the GAD67 marker (red). (F) The excitatory glutamatergic neuronal cells were observed with double staining for vGLUT1 (red) and MAP2 (green). (G) The bar graph represents the percentage of the fold increase in gene expression in the neurosphederm-derived neurons compared to the neuroectoderm-derived neurons. Gene expression analysis was performed using NanoString Technologies software as described in detail in the materials and methods. (H) The forebrain cholinergic neurons were detectable between 19–27 days in culture. These cells were confirmed by the presence of the nicotine acetyl choline receptor (nAChR, green) and a mature neuron marker (MAP2, red). (I) Purkinje neurons appeared between 40–45 days and expressed high levels of calbindin, a human Purkinje cell marker (red). (J) Dopaminergic neurons were detected between 25–27 days in the presence of additional supplements (see materials and methods). The dopaminergic neurons were identified by staining with antibodies to p-tyrosine hydroxylase (p-TH, red) and MAP2 (green). All of the images in this panel were captured by confocal microscopy. The nuclei are stained with DAPI. All scale bars, 25 μm.
Figure 5
Figure 5
Generation of functional synapses and a neural network in vitro from the neuroectoderm- and neurosphederm-derived neurons. The confocal images of the excitatory synapses were obtained from day 27 neurosphederm-derived neurons (A,B). The expression of the post-synaptic density protein PSD95 (green) and presynaptic marker synaptophysin (SYN, red) appeared punctate staining that were expressed on opposing neurons. PSD95 (green) and vGLUT1 (red) were co-localized in the neurosphederm-derived neurons. Scale bars, 20 μm. (C) For comparison, the neuroectoderm-derived neurons were stained with PSD95 (green) and the presynaptic marker synaptophysin (SYN, red). Scale bars, 20 μm. (D, E) The functional activity of the neurosphederm- and neuroectoderm-derived neurons was determined using the Fluo-4 Ca2+ AM ester dye, which indicated the spontaneous Ca2+ activity through green fluorescence. Scale bars, 80 μm. The nuclei are stained with DAPI. (F) The graph shows a dose-dependent increase in the intraneuronal Ca2+ activity (μM) in response to glutamate, with the exception of 1 mM glutamate, which shows no activity in either the neurosphederm (dotted line)- and neuroectoderm (solid line)-derived neuronal cultures. (G) The bar graph shows the glutamate-dependent neuronal activity and specific inhibition via the glutamate receptor antagonists iGluRs, MK801 and NBQX. The black and white bars show the neurons from the neurosphederm and neuroectoderm cultures, respectively. The data are presented as the means ± SD, N=3. *p< 0.05 or *p < 0.05 represent significant differences. neuroSPH and neuroECT represented the neurosphederm and neuroectoderm, respectively.
Figure 6
Figure 6
Comparison of neurogenesis of the AdSTEP fragmented and non-fragmented neurospheres in the mouse brain. (A) Representative image of the fragmented Qtracker-labeled neurospheres in a mouse; the implanted site is indicated by an arrow. Dispersion of the fragmented neurospheres into the cortex (CTX, cortex; and RSG, Retrosplenial granular). Scale bars, 200 μm. (B) Staining of the area with antibodies against human-specific nuclear antigen (HumN) (an arrow shows the injection site) that overlaid with the Qtracker-labeled (red) cells (arrowhead). Scale bars, 50 μm. (C) After transplantation, a significant number of PAX6-positive cells were observed in the AdSTEP-fragmented neurosphere-implanted graft, and they co-localized with the Qtracker-labeled cells (Qtracker-labeled cell colocalized with the PAX6 cell indicated by the arrowhead). Scale bars, 50 μm. (D) Illustration of the mechanism of neurogenesis from the neurospheres. The cells cultured with 10% CO2 and SKSRM produce large and bright neurospheres. After introducing the AdSTEP process to the neurospheres, NTTR structures with increased numbers of PAX6-positive cells appeared in the culture within 3–5 days. (E) βIII Tubulin-positive neurons were abundant in the graft from the AdSTEP-fragmented neurospheres. (F) The arrowhead in the inset showed that the implanted cells overlaid with the Qtracker-labeled cells had differentiated into neurons. Scale bars, 25 μm. (G) The non-fragmented neurospheres displayed very few βIII tubulin-positive cells. (H) The arrowhead in the inset showed the Qtracker-labeled cells with no overlaid neurons. Scale bars, 25 μm. (I) GFAP-positive astrocytes in the graft, and the arrowhead showed the overlaid Qtracker-labeled implanted cells (J) with or (K) without GFAP staining. Scale bars, 25 μm. The nuclei of all images are stained with DAPI and all of the images in this panel were captured by confocal microscopy. (L) The bar diagram represents the ImageJ quantification of the integrated density of the βIII tubulin-positive cells from the implanted AdSTEP-fragmented and non-fragmented neurospheres. The data are presented as the means ± SD, N=4. *p< 0.05 represents a significant difference. Frag and NonFrag represented the implanted AdSTEP-fragmented and non-fragmented neurospheres, respectively.

References

    1. Ebert AD, Yu J, Rose FF, Jr, Mattis VB, Lorson CL, Thomson JA, Svendsen CN. Induced pluripotent stem cells from a spinal muscular atrophy patient. Nature. 2009;457(7227):277–280. - PMC - PubMed
    1. Lee G, Papapetrou EP, Kim H, Chambers SM, Tomishima MJ, Fasano CA, Ganat YM, Menon J, Shimizu F, Viale A, Tabar V, Sadelain M, Studer L. Modelling pathogenesis and treatment of familial dysautonomia using patient-specific iPSCs. Nature. 2009;461(7262):402–406. - PMC - PubMed
    1. Dimos JT, Rodolfa KT, Niakan KK, Weisenthal LM, Mitsumoto H, Chung W, Croft GF, Saphier G, Leibel R, Goland R, Wichterle H, Henderson CE, Eggan K. Induced pluripotent stem cells generated from patients with ALS can be differentiated into motor neurons. Science. 2008;321(5893):1218–1221. - PubMed
    1. Park IH, Arora N, Huo H, Maherali N, Ahfeldt T, Shimamura A, Lensch MW, Cowan C, Hochedlinger K, Daley GQ. Disease-specific induced pluripotent stem cells. Cell. 2008;134(5):877–886. - PMC - PubMed
    1. Yagi T, Ito D, Okada Y, Akamatsu W, Nihei Y, Yoshizaki T, Yamanaka S, Okano H, Suzuki N. Modeling familial Alzheimer’s disease with induced pluripotent stem cells. Hum Mol Genet. 2011;20(23):4530–4539. - PubMed

Publication types

MeSH terms