. 2015 Nov 27:4:e11571.
doi: 10.7554/eLife.11571.

Maturation of metabolic connectivity of the adolescent rat brain

Affiliations

Maturation of metabolic connectivity of the adolescent rat brain

Hongyoon Choi et al. Elife. .

Abstract

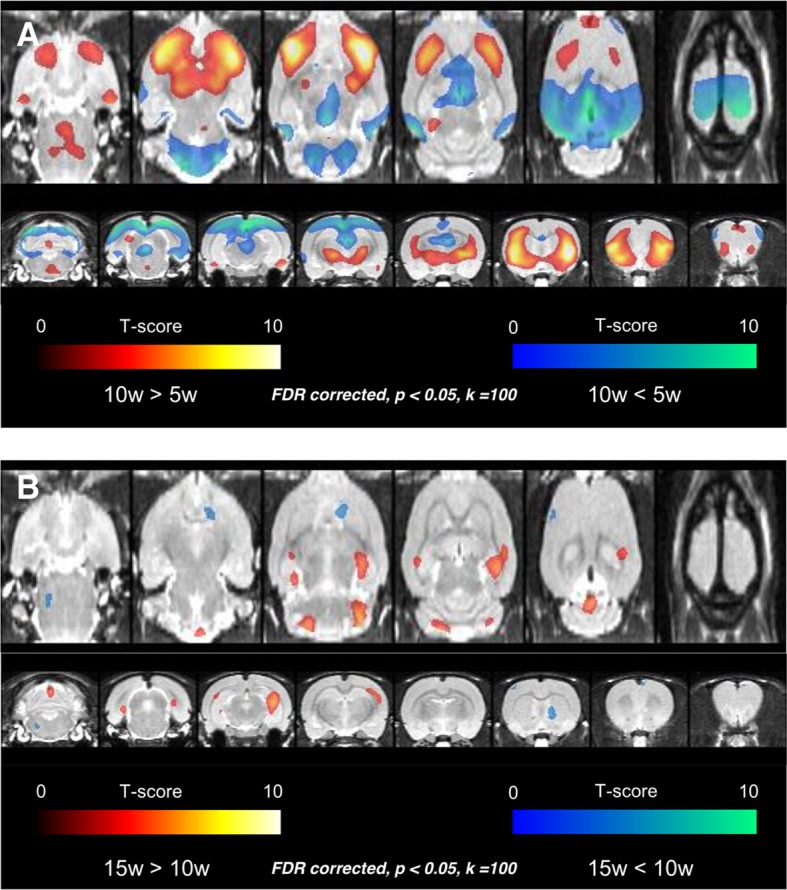
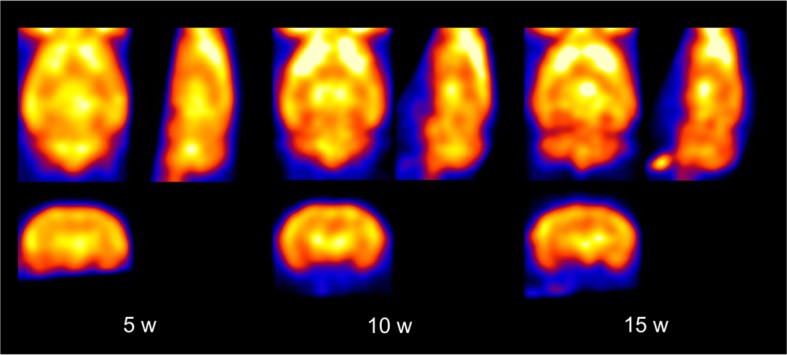
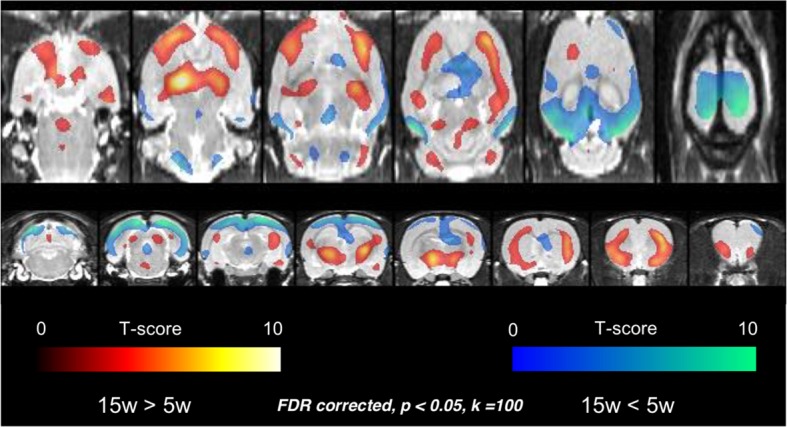
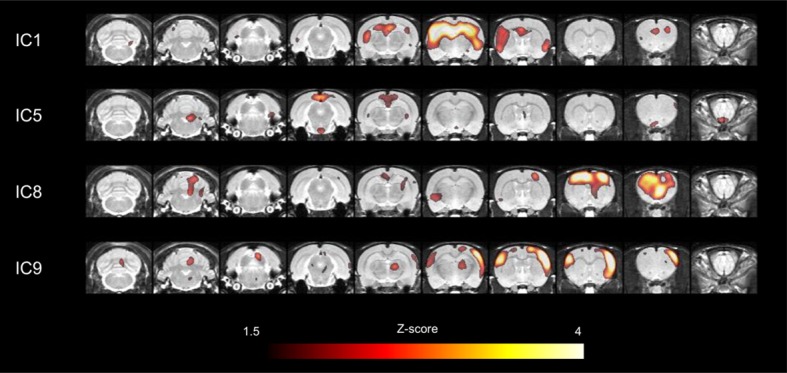
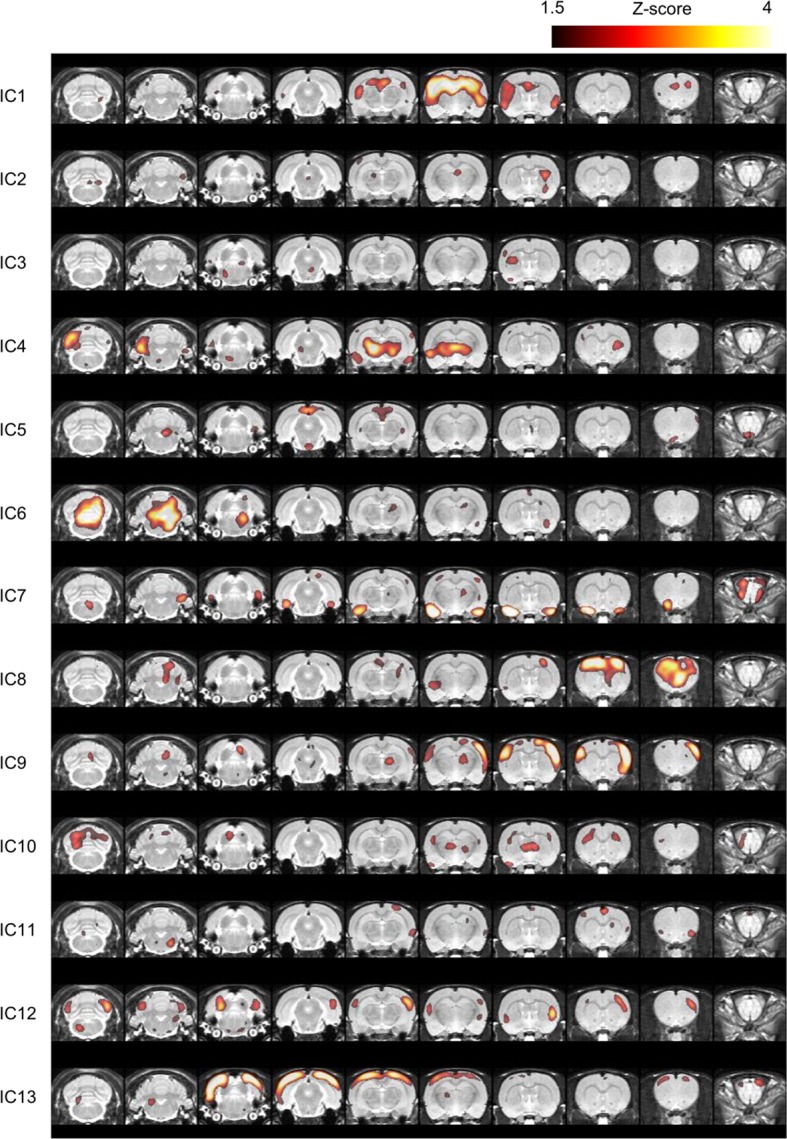
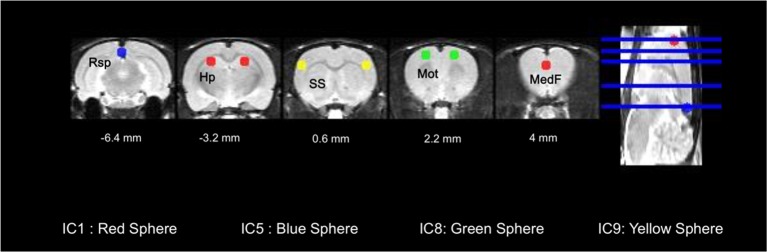
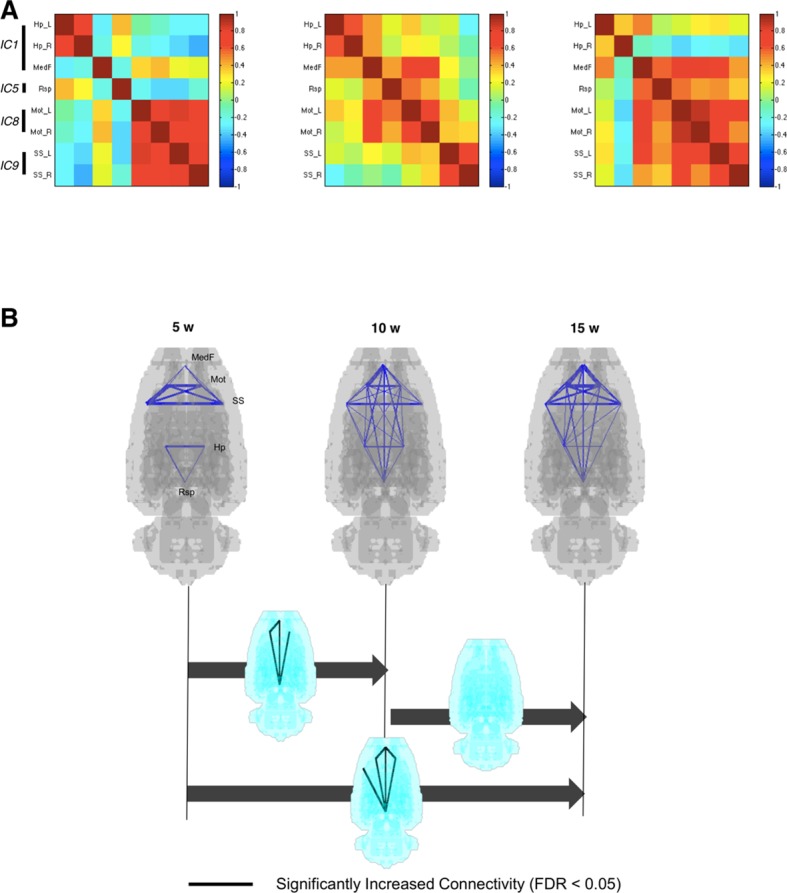
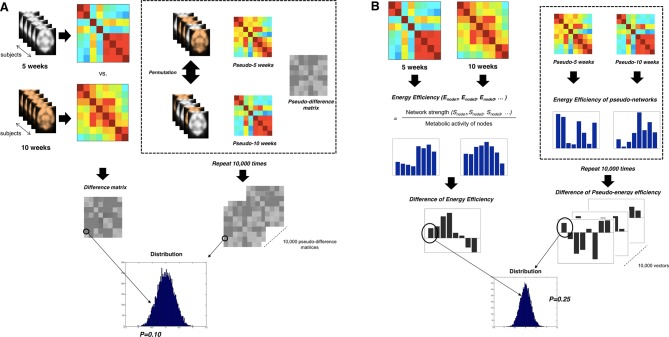
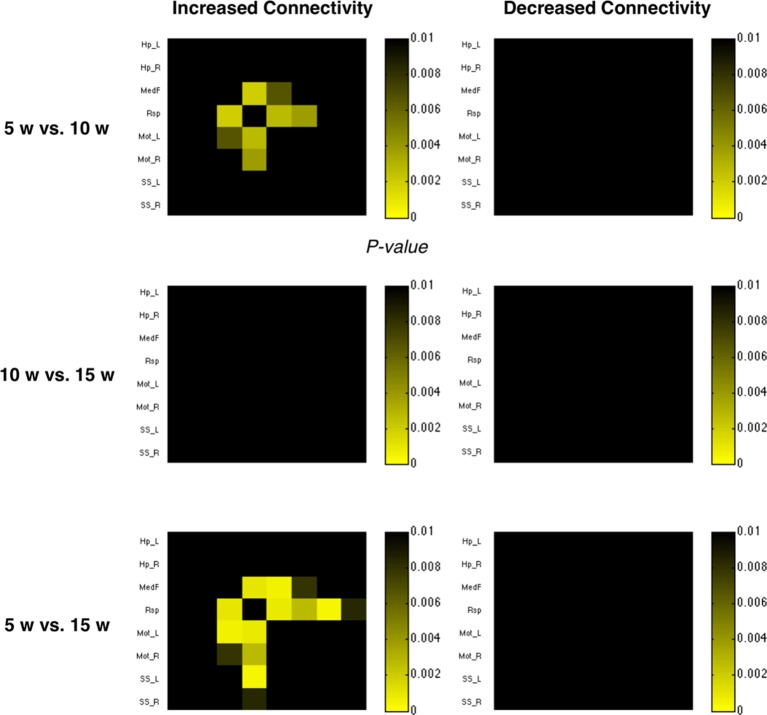
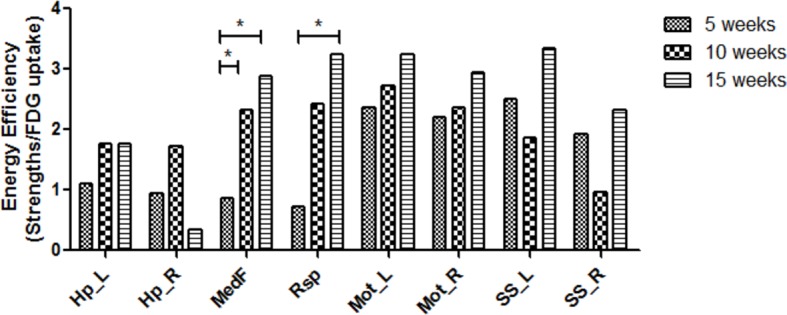
Neuroimaging has been used to examine developmental changes of the brain. While PET studies revealed maturation-related changes, maturation of metabolic connectivity of the brain is not yet understood. Here, we show that rat brain metabolism is reconfigured to achieve long-distance connections with higher energy efficiency during maturation. Metabolism increased in anterior cerebrum and decreased in thalamus and cerebellum during maturation. When functional covariance patterns of PET images were examined, metabolic networks including default mode network (DMN) were extracted. Connectivity increased between the anterior and posterior parts of DMN and sensory-motor cortices during maturation. Energy efficiency, a ratio of connectivity strength to metabolism of a region, increased in medial prefrontal and retrosplenial cortices. Our data revealed that metabolic networks mature to increase metabolic connections and establish its efficiency between large-scale spatial components from childhood to early adulthood. Neurodevelopmental diseases might be understood by abnormal reconfiguration of metabolic connectivity and efficiency.

Keywords: FDG PET; adolescent; brain maturation; energy efficiency; metabolic connectivity; neuroscience; rat; resting-state network.


Conflict of interest statement

The authors declare that no competing interests exist.

Figures

Figure 1.
Figure 1.. Voxelwise comparison results among rats aged 5, 10, and 15 weeks.
(A) Age-related increase of metabolism was found in bilateral frontal cortices and anterior aspect of striatum in 10 weeks. Age-related decrease of metabolism was detected in bilateral cerebellar cortices, thalamus, parietooccipital cortices, and retrosplenial cortices. (B) In the comparison between 10-week and 15-week-old rats, age-related increase of metabolism was found in the clusters of both hippocampi and decrease of metabolism in the small clusters of right striatum and left frontal cortex. The finding implies that considerable metabolic maturation in frontal cortices occurs between 5 and 10 weeks, i.e. during adolescence. DOI: http://dx.doi.org/10.7554/eLife.11571.003
Figure 1—figure supplement 1.
Figure 1—figure supplement 1.. Representative FDG PET images for each age.
Visual inspection can detect increase of metabolism in anterior part of the brain during maturation concordant with the results of voxelwise comparison. DOI: http://dx.doi.org/10.7554/eLife.11571.004
Figure 1—figure supplement 2.
Figure 1—figure supplement 2.. Voxelwise comparison between 5-week-old and 15-week-old rats.
The patterns of increase and decrease of metabolism were similar to the comparison between 5-week and 10-week-old rats. The findings imply that metabolic maturation in the brain occurs before 10 weeks and almost reaches plateau. DOI: http://dx.doi.org/10.7554/eLife.11571.005
Figure 2.
Figure 2.. Major network components in cerebral cortices obtained by ICA.
Among 13 large-scale network components, 4 independent components which corresponded to those in humans were selected for further connectivity analyses. In particular, independent component (IC) 1 included bilateral hippocampi and medial prefrontal cortex. IC5 included retrosplenial cortex, a core of default-mode network. IC8 included motor cortex and IC9 included somatosensory cortex. ICA, independent component analysis. DOI: http://dx.doi.org/10.7554/eLife.11571.006
Figure 2—figure supplement 1.
Figure 2—figure supplement 1.. Independent components identified by ICA of FDG PET images (n = 88).
Thirteen large-scale functional networks were extracted. DOI: http://dx.doi.org/10.7554/eLife.11571.007
Figure 2—figure supplement 2.
Figure 2—figure supplement 2.. Eight volume-of-interests (VOIs) were defined as spheres with a radius of 0.8 mm (actual size), located on each of independent components (ICs).
Red spheres are VOIs of IC1, blue sphere is VOIs of IC5, green spheres and yellow spheres are VOIs of IC8 and IC9, respectively. Metabolic activity of the VOIs was measured, and correlations of them per each group of rats of each age were analyzed to yield metabolic connectivity. DOI: http://dx.doi.org/10.7554/eLife.11571.008
Figure 3.
Figure 3.. Metabolic connectivity between brain regions.
(A) To find functional relevance between brain regions, metabolic activities of several brain regions were correlated to each other. Eight volume-of-interests (VOIs) were selected from the results of independent component analysis, and interregional correlations between them were calculated. Correlation strengths between different networks increased according to age. (B) Blue lines indicate pairwise connections which showed positive correlation. Note that line width means strength of the connectivity. Significant increase of metabolic connectivity is shown mainly in anterior-posterior connections according to maturation (for multiple comparison, false discovery rate < 0.05 was applied). More number of pairs of significant increase in metabolic connectivity was shown between 5 and 15 weeks of age than 5 and 10 weeks of age. DOI: http://dx.doi.org/10.7554/eLife.11571.010
Figure 3—figure supplement 1.
Figure 3—figure supplement 1.. Statistical analysis for metabolic connectivity maturation based on permutation test.
We analyzed different pairwise connections between rats aged 5 vs 10 weeks and 10 vs.  15 weeks. (A) Correlation matrices were generated and their differences were calculated between paired groups, and data of paired groups were permuted 10,000 times to yield the distribution of correlation matrices and their differences (pseudorandom matrices) were obtained from these randomly permuted groups. Type I errors were determined by the comparison of the observed difference matrix with the distribution of pseudo-difference matrices from permuted data. (B) Energy efficiency of nodes of rats aged 5 vs 10 weeks and 10 vs 15 weeks was also compared using the same permutation test as above. Data of paired groups were permuted 10,000 times to yield the distribution of efficiency vector, and their differences (pseudorandom vectors) were obtained from these permuted groups. Type I errors were determined by the comparison of the observed difference vector with the distribution of pseudo-difference vectors from permuted data. DOI: http://dx.doi.org/10.7554/eLife.11571.011
Figure 3—figure supplement 2.
Figure 3—figure supplement 2.. Statistical significance (p-values) for difference in strengths of connections between groups of different aged rats.
Statistical significance was represented by color scale. Of note, in the comparison between 5- and 10-week-old rats, connectivity between retrosplenial cortex, medial prefrontal, and motor cortices was strengthened. These patterns were more prominent in the comparison between 5- and 15-week-old rats. There was no significant connectivity weakening during maturation from 5 to 15 weeks of age. DOI: http://dx.doi.org/10.7554/eLife.11571.012
Figure 4.
Figure 4.. Increased energy efficiency in the medial prefrontal and retrosplenial cortices during maturation.
Energy efficiency defined as a ratio of metabolic connectivity strength to normalized FDG uptake was estimated for each region. The energy efficiency changes and was interpreted to be reorganized during brain maturation. While efficiency in the midline structure was lower at 5 week of age, that is, medial prefrontal and retrosplenial cortices, but increased significantly in 10 and 15 weeks. (*p < 0.05 based on Bonferroni correction over permutation test). FDG, 18F-Fluorodeoxyglucose. DOI: http://dx.doi.org/10.7554/eLife.11571.013

References

    1. Apostolova I, Wunder A, Dirnagl U, Michel R, Stemmer N, Lukas M, Derlin T, Gregor-Mamoudou B, Goldschmidt J, Brenner W, Buchert R. Brain perfusion SPECT in the mouse: normal pattern according to gender and age. NeuroImage. 2012;63:1807–1817. doi: 10.1016/j.neuroimage.2012.08.038. - DOI - PubMed
    1. Blakemore S-J. Imaging brain development: the adolescent brain. NeuroImage. 2012;61:397–406. doi: 10.1016/j.neuroimage.2011.11.080. - DOI - PubMed
    1. Broyd SJ, Demanuele C, Debener S, Helps SK, James CJ, Sonuga-Barke EJS. Default-mode brain dysfunction in mental disorders: a systematic review. Neuroscience & Biobehavioral Reviews. 2009;33:279–296. doi: 10.1016/j.neubiorev.2008.09.002. - DOI - PubMed
    1. Bullmore E, Sporns O. The economy of brain network organization. Nature Reviews Neuroscience. 2012;13:336–349. doi: 10.1038/nrn3214. - DOI - PubMed
    1. Choi H, Kim YK, Kang H, Lee H, Im H-J, Hwang DW, Kim EE, Chung J-K, Lee DS. Abnormal metabolic connectivity in the pilocarpine-induced epilepsy rat model: a multiscale network analysis based on persistent homology. NeuroImage. 2014;99:226–236. doi: 10.1016/j.neuroimage.2014.05.039. - DOI - PubMed

Publication types